1. Day 11 Slope.notebook November 26, 2012
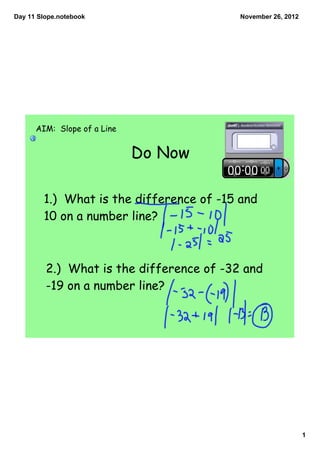
AIM: Slope of a Line
Do Now
1.) What is the difference of -15 and
10 on a number line?
2.) What is the difference of -32 and
-19 on a number line?
1
2. Day 11 Slope.notebook November 26, 2012
Anticipatory Set: Does the graph on the right show a
proportional relationship? If so, what is the constant of
proportionality? How did you find the constant?
2
3. Day 11 Slope.notebook November 26, 2012
y
Slope: y
6
5
4
x 3
2
1
x
y 2 - y1 6 5 4 3 2 1
1
0 1 2 3 4 5 6
= 2
x2 - x1 3
4
5
6
Find the slope of the graph on the right.
3
4. Day 11 Slope.notebook November 26, 2012
Find the slope
y
10
(2 ,
10)
9
8
7
6
(1 ,
5 5)
4
3
2
1
x
0 1 2 3 4 5 6 7 8 9 10
4
5. Day 11 Slope.notebook November 26, 2012
Find the slope
y
10
9
8
7
6
5
(4 ,
4 4)
(3 ,
3 3)
(2 ,
2 2)
(1 ,
1 1)
x
0 1 2 3 4 5 6 7 8 9 10
5
6. Day 11 Slope.notebook November 26, 2012
Find the slope
y
10
9
8
7
6
5
(8 ,
4 4)
(6 ,
3 3)
(4 ,
2 2)
(2 ,
1 1)
x
0 1 2 3 4 5 6 7 8 9 10
6
7. Day 11 Slope.notebook November 26, 2012
Fill in the table of values and create
the graph. y = 4x
x 4x y
2
1
0
1
2
y
6
5
4
3
2
1
x
6 5 4 3 2 1 0 1 2 3 4 5 6
1
2
3
4
5
6
7
8. Day 11 Slope.notebook November 26, 2012
Fill in the table of values and create the
graph. y = -3x
x 3x y
2
1
0
1
2
y
6
5
4
3
2
1
x
6 5 4 3 2 1 0 1 2 3 4 5 6
1
2
3
4
5
6
8
9. Day 11 Slope.notebook November 26, 2012
Before You Leave
How are the two graphs above different? How are their equations different?
9