SlideShare a Scribd company logo
1 of 18
Download to read offline
Martagan, T. G., Ertek, G., Birbil, S. I., Yasar, M., Cakır, A., Okur, N., Gullu, G., Hacıoglu, A. and
Sevim, O. (2006). "Optimizing waste collection in an organized industrial region: A case study.”
4th International Logistics and Supply Chain Congress, İzmir, Turkey.

Note: This is the final draft version of this paper. Please cite this paper (or this final draft) as
above. You can download this final draft from http://research.sabanciuniv.edu.


                                      OPTIMIZING WASTE COLLECTION
             IN AN ORGANIZED INDUSTRIAL REGION: A CASE STUDY

                      Tuğçe Gizem Martağan1, Gürdal Ertek2, Ş. İlker Birbil3, Murat Yaşar,
                Ahmet Çakır, Nazım Okur, Gürdal Güllü, Ahmet Hacıoğlu, and Özgür Sevim


                                                                   Abstract

In this paper we present a case study which involves the design of a supply chain
network for industrial waste collection. The problem is to transport metal waste
from 17 factories to containers and from containers to a disposal center (DC) at an
organized region of automobile parts suppliers. We applied the classic mixed-
integer programming (MIP) model for the two-stage supply chain to the solution


1
  Sabancı University, Turkey,
2
  Sabancı University, Turkey,
3
  Sabancı University, Turkey,

4th International Logistics and Supply Chain Management Congress
of this problem. The visualization of the optimal solution provided us with several
interesting insights that would not be easily discovered otherwise.


Keywords:              Logistics of industrial waste, Supply chain network design, Waste
collection, Waste management, Facility location, Organized industrial regions.

1. Introduction

    The problem presented in this paper consists of planning the logistics of industrial waste
collection from factories located in an organized industrial region, to suitable intermediate points
which are possible container locations, and finally to disposal centers. The main process leading
to solution of this waste collection problem is designing a network model according to the cost
analysis, and determining waste container locations based on their capacities and locations. The
problem can be treated as a transhipment problem aiming to select the best intermediate points
for waste transfer while minimizing transportation costs in the waste collection network (Section
2). After building the model and reaching the optimal solution minimizing the total cost, a Java
program that can read input files was coded in order to visualize the solution (Section 3). At the
visualization stage, the values of the parameters and variables were mapped to the sizes of the
nodes and thickness of the arcs.


                   Figure 1. The candidate container locations displayed on a map of TOSB.

4th International Logistics and Supply Chain Management Congress
The industrial waste collection problem discussed in this paper was done as a graduation project
at Sabancı University in 2005-2006 academic year. Distinguishing aspects of this study are that
the problem is an example of environmental operations research is based on an estimate of real
world data and that visualization is carried out. The used method and obtained solution have
practical aspects which make them be easily adoptable to the one of the problems of organized
industrial regions. This has also environmental contributions because of the fact that collected
industrial waste such as metals are recycled. Furthermore, network visualization obtained by Java
in the final phase leads to a better understanding of the solution and assessment of the designed
supply chain network.

In the model, data from TOSB (TAYSAD Organize Sanayi Bölgesi - TAYSAD Organized Industrial
Region) was used. The reasons for selecting to develop a model with TOSB (TOSB) data were as
follows:

           TAYSAD (Taşıt Araçları Yan Sanayicileri Derneği, Association of Automotive Parts &
          Components Manufacturers), founded in 1978, is the most powerful association in the
          automobile parts supplier industry with %65 market share in Turkey. TAYSAD companies
          operate especially in Istanbul, Kocaeli and Bursa. TAYSAD is also a member of CLEPA,
          European Association of Automotive Suppliers.

           TOSB consists of 59 of 170 members of TAYSAD. Founded on a 625 acre (2.53 km2) of
          land, TOSB is one of the most important industrial regions chosen by Turkish and as well
          as foreign automotive parts manufacturers. Additionally, Turkish automotive parts
          supplier industry has approximately 700 firms operating with latest technology and makes
          %70 of its exports to European Union countries. This industry has a considerable
          contribution to the Turkish economy: In 2003, $2.4 billion of exports were achieved by
          Turkish automotive parts suppliers.

           The fact that TOSB is located in Gebze, within close proximity of Sabancı University has
          highly motivated us as the project team, since we would have a chance to suggest a solution
          to a practical real-world problem in our neighbourhood. Meanwhile, Sabancı University
          has close ties with TAYSAD thanks to common projects between The Competitiveness
          Forum (Competitiveness Forum) of Sabancı University and TAYSAD.


4th International Logistics and Supply Chain Management Congress
2. The Model

In TOSB, 17 factories, 5 candidate container locations and one disposal center (DC) where total
waste will be sent are available (Figure 1). Different amounts of waste from each factory are sent
to suitable container locations from where they will be than transferred to the DC. The objective is
to minimize total transportation cost under capacity constraints for the containers. This supply
chain network design problem contains three sets of nodes (factories, containers and DC) and two
sets of arcs (from factories to containers and from containers to the DC), hence the name two-
stage supply chain. The set I represents factories which are the source nodes producing wi tons of
waste monthly. Intermediate nodes representing candidate container locations constitute the set
J. In these sites indexed by j, container location decisions are reflected by binary variables zj.
There are three sets of decision variables: zj, xij, yj representing location and flow decisions. Since
binary variables are present in the model together with continuous variables, the problem can be
classified as a mixed integer programming (MIP) problem. The model is given bellow:


SETS
I : set of factories, i  1,, n
J : set of candidate container locations, j  1,, m


PARAMETERS
aij : cost of sending one ton of waste from factory i to container location j

b j : cost of sending one ton of waste from container location j to DC

wi : monthly waste amount of factory i
C : maximum monthly capacity of each container
 f j : monthly fixed cost of operating a container at container location j


VARIABLES
z j : 1, if a container is located at container location j ; 0 otherwise

xij : amount of monthly flow of waste from factory i to container location j

y j : amount of monthly flow of waste from container location j to disposal center (DC)


4th International Logistics and Supply Chain Management Congress
Min          a
            iI jJ
                       ij   xij   f j z j   b j y j
                                  jJ         jJ


s.t.
y j  Cz j                  j  J                  (1) Capacity and Linking constraints


x
iI
       ij    yj        j  J                      (2) Flow balance constraints: Containers


x
jJ
       ij    wi            i  I                  (3) Flow balance constraints: Factories


z j binary; xij , y j  0                            (4) Binary z j and Nonnegativity


In the objective function, the total cost in the supply chain is to be minimized: The first
summation represents the total cost of transferring waste from factories to container locations;
the second summation represents the total fixed cost of opened containers (assuming that each
container has a lifetime of one year); and the last summation represents the total cost of
transferring waste from containers to the DC.

The constraints are as follows:

             1.       The first constraint set representing capacity constraints assures that monthly flow of
             waste from container location j does not exceed the maximum monthly capacity. As can be
             observed, the capacity of every container is assumed to be identical, namely C. This
             constraint set also links the selection of container location j to the monthly waste flow from
             that container to DC. There can be a monthly flow from container location j to DC only if a
             container is located at a container location j.

             2. The second constraint set assures that the total amount of waste coming from different
             factories to a container j is the same as the total amount of waste transferred from that
             container j to the DC.

             3. The third constraint set ensures that outgoing waste from a factory i is equal to its
             monthly amount of waste.

4th International Logistics and Supply Chain Management Congress
4. The fourth constraint set specifies that the zj are binary and that the other variables are
          nonnegative

In order to solve the model presented above, we have decided to use GAMS (General Algebraic
Modelling Systems), a high-level modeling system for mathematical programming and
optimization (GAMS). We have decided to use CPLEX (ILOG) as the MIP solver. The model is
built based on the TOSB data, which contains 17 factories, 5 candidate container locations and
one DC. The complete GAMS model is given in Appendix A. We would like to remark that the real
world values are distorted and thus hidden in the given GAMS model due to confidentiality
issues. However the magnitude of costs are of the same scale. Construction of the model required
the declaration of sets I and J and their elements as I = {f1, f2, f3,…., f16, f17} and J = {c1,c2, c3,
c4, c5}, respectively. The maximum monthly capacity C of each container is taken as 600 tons.
Distances are calculated based on the actual road structure of TOSB for each arc and then the
costs on the arcs are determined by taking fuel costs and staff expenses into account. All of the
costs are monthly and in terms of YTL (new Turkish lira).

In the optimal solution, minimum monthly cost of the waste transfer from factories to container
locations and then to the DC is 70,338 YTL (approximately $48,000). Three container locations
(c1, c3, c4) out of the five candidates were selected to be opened by the solver.


3. Network Visualization

    Following the development of the mathematical model and the GAMS model, we have carried
out a visualization of the solution that was found by CPLEX. Visualization can dramatically
enhance one’s understanding of the optimization results and enable perception of useful and
interesting insights. Some supply chain design/optimization software (CIMPEL, HKUST,
Llamasoft, LogisticTools, Logistics Simulation, The Logistics Institute) are known to visually
represent supply chain networks. Meanwhile, the paper by Camm et al. (1997) is a supply chain
classic from the operations research / industrial engineering literature. In their paper, the
authors describe an optimization based information system that is supported by GIS
(Geographical Information System) visualization. The system they describe is reported to save
more than $200 million for the consumer products giant Procter & Gamble.

The visualization in our study (Figure 2) was carried out through a simple Java program that
reads two input files, namely problem.txt and solution.txt (given in Appendix B with distorted
parameter values, ex: factory coordinates and flows). In this visualization only the containers that

4th International Logistics and Supply Chain Management Congress
appear in the optimal solution are displayed. Each factory is represented by a circle filled with
blue. The magnitudes of the flows between nodes are reflected in the thickness of the arcs. Flows
in the first stage (factories and containers) of the supply chain are represented by red arcs and
flows in the second stage (containers and DC) are represented by black arcs. The arc labels denote
the amount of flows on the arcs in tons.


                      Figure 2. The Java visualization of the optimal supply chain network.


    From Figure 2 one can observe that there exists a significant amount of flow from factories 8
and 16 (f8, f16) to container 4 (c4). Meanwhile there exist relatively significant amounts of flow


4th International Logistics and Supply Chain Management Congress
from factories 4, 9, 12 (f4, f9, f12) to container 1 (c1). By observing the thickness of the black arcs
from containers 1 and 4 to the DC, one can conclude that these two containers are utilized to full
capacity. On the other hand, container 3 is not utilized to full capacity, since the arc from that
container to the DC is approximately half as thick as the other black arcs. All the factories send
their waste to a single container (single-sink), except factories 4 and 15 (f4, f15).

    The visualization of the network allowed us to make the above observations, which would be
very hard to make by looking at the text output of the GAMS solution. Thus we believe that the
extra effort spent for the visualization is highly justified.


4. Related Literature

    Amponsah and Salhi (2004) argue that waste collection problem is one of the most crucial
problems for large cities and local authorities. Waste collection and solid waste management pose
importance since some wastes contain toxic and hazardous ingredients, where some others are
recycled. Literature contains studies focusing on efficient waste collection, supply chain network
designs leading to operational cost savings. There are many related problems, including Vehicle
Routing Problem (VRP), where the main aim is to incur the minimum total cost while routing
multiple numbers of vehicles, going out from a depot, visiting intermediate nodes and returning
back to the depot. (Tung, D. V., Pinnoi, A., 1999). Minimizing number of vehicles can be another
objective in VRP. Vehicle Scheduling and Routing Problem (VSRP) can be considered as an
extension of VRP with time periods and place requirements constraints (Johansson, O. M.,
2005). Additionally, Vehicle Routing Problem with Time Windows (VRPTW) includes time
windows between which the nodes have to be visited (Kim, B. I. et al., 2005). Other problem
variants include Periodic Vehicle Routing Problem (PVRP) (Teixeira et al., 2004) and Capacitated
Arc Routing Problem (CARP) (Chu, et al., 2004).

The model which is most related to the network design problem in this paper is presented by
Rahman et al. (1995). The authors refer to the problem as the Solid Waste Transfer Stations
(SWTS) location problem and solve it for the City of Phoenix, Arizona. Their model aims to select
the most suitable intermediate nodes to transfer materials with the objective of minimizing
transportation costs. In their paper, they also develop an additional approach to SWTS by
minimizing public opposition.

    It is also possible to find out several works about waste management in Turkey. For example,
Koçer et al. (2003) investigated waste collection, waste transfer costs and waste disposal areas in

4th International Logistics and Supply Chain Management Congress
Elazığ, Turkey. In their research, they considered criteria such as location of the waste area,
population, daily amount of waste, container capacities, weight of waste, costs, time, and
productivity in waste management. They conclude that first of all, records for waste quantities
and costs should be kept and secondly the number of workers, distances of transportation,
capacities of the containers and their technical capabilities affect productivity. Another research
is done by Karagüzel and Mutlutürk (2005), who considered geological, hydro geological,
topographical criteria and observed environmental protection areas, land sliding and flooding in
order to select the most suitable waste area in Isparta, Turkey. Demir et al. (2001) studied the
design of waste transportation and waste collection in Yenimahalle, Ankara, Turkey. They have
developed a long-term and short-term plan for waste collection and logistics and selected the
transfer stations. They have developed a mathematical model similar to the one presented in our
paper but additionally, they also considered allocation of trucks to collection areas, frequency of
the collections and definition of the optimal roads. Their study also includes financial analysis.


5. Conclusions

    We have presented the application of optimization to a real-world industrial waste collection
problem. Two distinguishing aspects of our study are the following:

          1.    The model was built using real-world data provided by the management of the
          industrial region and estimated values which we believe are close enough to the real values
          (however, the values given in the paper for the model and its solution are distorted due to
          confidentiality agreements).

          2. The optimal solution was visualized, enabling the observation of several interesting
          issues.

Mathematical programming, specifically mixed integer programming (MIP) is an essential tool to
model and solve strategic and tactical managerial problems of industrial regions. Industrial
regions in developing countries such as Turkey can highly benefit from this approach, as
illustrated in our study. Meanwhile, visualization can contribute greatly to the usability and thus
acceptance of optimization models in industry.


4th International Logistics and Supply Chain Management Congress
6. References


Amponsah, S. K., Salhi, S. 2004. The investigation of a class of capacitated arc routing problems:
the collection of garbage in developing countries. Waste Management, 24: 711–721.


CIMPEL. http://www2.isye.gatech.edu/~mgoetsch/research.html#Cimpel


Camm, J. D., Chorman, T. E., Dill, F. A., Evans, J. R., Sweeney, D. J., Wegryn, G. W. 1997.
Blending OR/MS, judgment, and GIS: Restructuring P&G’s supply chain. Interfaces, 27: 128-
142.


Chu, F., Labadi, N., Prins, C. 2004. Heuristics for the periodic capacitated arc routing problem.
Journal of Intelligent Manufacturing, 16: 243-251.


Competitiveness Forum. http://www.ref.sabanciuniv.edu


Demir, E., Gültekin, D., Sandıkçıoğlu, S., Şayhan, A., Yeşildağ, M., Kırca, Ö., Süral, H.,
Yenimahalle Belediyesi Katı Atık Toplama ve Taşıma Sistemleri tasarımı. Endüstri
Mühendisliği Dergisi, 12(3-4): 52-64.


GAMS. http://www.gams.com


HKUST. http://www1.ieem.ust.hk/research/project_img/web9_l.jpg


ILOG. http://www.ilog.com

4th International Logistics and Supply Chain Management Congress
Johansson, O. M., 2006. The effect of dynamic scheduling and routing in a solid waste
management system. Waste Management, 26: 875-885.


Karagüzel, R., Mutlutürk, M., 2005. Katı atık depolamada yer seçimi: Isparta örneği.
Mühendislik Jeolojisi Bülteni, 21: 19-33.


Kim, B. I., Kim, S., Sahoo, S. 2006. Waste collection vehicle routing problem with time windows.
Computers & Operations Research, 33: 3627-3642.


Koçer, N., Öbek, E., Uslu, G. 2003. Elazığ kentinde atıkların toplama ve taşıma maliyeti ile çöp
sahasının durumu. Fırat Üniversitesi Fen ve Mühendislik Dergisi, 15(2): 173-182.


Llamasoft. http://www.llamasoft.com/network.html


LogicTools. http://logic-tools.com


Logistics Simulation. http://www.logsim.co.uk/index.htm


Rahman, M., Kuby, M. 1995. A multiobjective model for locating solid waste transfer facilities
using an empirical opposition function. INFOR, Ottowa, 33: 34-49


TAYSAD. http://www.taysad.org.tr


4th International Logistics and Supply Chain Management Congress
Teixeira, J., Antunes, A. P., de Sousa, J. P. 2004. Recyclable waste collection planning - a case
study. European Journal of Operational Research, 543-554.


The Logistics Institute. http://www.tli.gatech.edu/research/projects/detail.php?id=22


TOSB. http://www.tosb.com.tr


Tung, D. V., Pinnoi, A. 1999. Vehicle routing-scheduling for waste collection in Hanoi.
European Journal of Operational Research, 125: 449-468.


4th International Logistics and Supply Chain Management Congress
Appendix A. The GAMS Model


SETS

    I Factories / f1*f17 /

    J Container Locations / c1*c5 /

    DC Disposal Center                 /d1/ ;

 PARAMETERS


    F(J) fixed monthly cost

      / c1 626

          c2 626

          c3 1252

          c4 750

          c5 750

                 /

    W(I) average monthly waste amount of factory i

      /

f1 25

f2 75

f3 15

f4 120

f5 45

f6 30

f7 20

f8 270


4th International Logistics and Supply Chain Management Congress
f9 140

f10 35

f11 80

f12 170

f13 55

f14 70

f15 90

f16 240

f17 25

      /


     B(J)    unit cost per ton from location j to dc

            / c1       36

             c2        40

             c3        36

             c4        32

             c5        44

                        /;


     TABLE A(I,J) unit cost per ton from factory i to location j

      c1      c2        c3       c4     c5

f1     26       16          6    32      24

f2     32         16        10    20       34

f3     30         32        22    46         6

f4     18         14        28    4       46


4th International Logistics and Supply Chain Management Congress
f5      14      24       24       34       16

f6      28      30       18       44       10

f7      8      14       20       30       28

f8      26      22       32       4       54

f9      4      6       20        20       30

f10      24      12      6        22       32

f11     26      24       14       40       14

f12      16     30       26       38        16

f13      12     6       18       12       38

f14      22      34       24       44       10

f15      14     20       16       34       24

f16      26      20       34       12      52

f17      14     2       16       16       42


SCALAR capacity /600/;


VARIABLES obj ;


 POSITIVE VARIABLES

      X(I,J)

      Y(J) ;


 BINARY VARIABLES Z(J) ;


EQUATIONS


4th International Logistics and Supply Chain Management Congress
COST          objective function

      CAPLINK(J)

      FLOW(J)

      FLOW2(I);


 COST ..         OBJ =E= SUM((I,J),A(I,J)*X(I,J)) + SUM(J, F(J)*Z(J))

                   + SUM(J, B(J)*Y(J));

 CAPLINK(J).. Y(J) =L= CAPACITY*Z(j) ;

 FLOW(J)..         SUM(I, X(I,J)) =E= Y(J) ;

 FLOW2(I)..         SUM(J, X(I,J)) =E= W(I) ;


 MODEL TOSB_PROJECT /ALL/ ;


 option lp=CPLEX;

 SOLVE TOSB_PROJECT USING MIP MINIMIZING OBJ ;


Appendix B


problem.txt


4th International Logistics and Supply Chain Management Congress
PROBLEM_FILE

NO_OF_FACTORIES

17

NO_OF_CONTAINER_LOCATIONS

5

FACTORY_COORDINATES

16 10

12 14

…

10 8

CONTAINER_LOCATIONS

13 4

12 8

15 12

5 11

26 5

DISPOSAL_CENTER_LOCATION

10 10

a_ij

26 16 6 32 24

…

b_j

36 40 36 32 44

w_i

25 75 15 120 45 30 20 270 140 35 80 170 55 70 90 240 25


4th International Logistics and Supply Chain Management Congress
C

600

f_j

25 75 15 120 45 30 20 270 140 35 80 170 55 70 90 240 25


solution.txt


SOLUTION_FILE

x_ij

0 0 25 0 0 0 0 75 0 0 0 0 15 0 0 30 0 0 90 0 45 0 0 0 0 0 0 30 0 0 20 0 0 0 0 0 0 0 270 0 140 0 0 0 0 0 0 35 0 0 0 0
80 0 0 170 0 0 0 0 55 0 0 0 0 70 0 0 0 0 45 0 45 0 0 0 0 0 240 0 25 0 0 0 0

y_j

600 0 305 600 0

z_j

10110


4th International Logistics and Supply Chain Management Congress

More Related Content

What's hot

Robust Counterpart Open Capacitated Vehicle Routing (RC-OCVRP) Model in Opti...
Robust Counterpart Open Capacitated Vehicle Routing  (RC-OCVRP) Model in Opti...Robust Counterpart Open Capacitated Vehicle Routing  (RC-OCVRP) Model in Opti...
Robust Counterpart Open Capacitated Vehicle Routing (RC-OCVRP) Model in Opti...IJECEIAES
 
On The Use of Transportation Techniques to Determine the Cost of Transporting...
On The Use of Transportation Techniques to Determine the Cost of Transporting...On The Use of Transportation Techniques to Determine the Cost of Transporting...
On The Use of Transportation Techniques to Determine the Cost of Transporting...IOSR Journals
 
Logistics and Supply Chain: An integrated production, inventory, warehouse lo...
Logistics and Supply Chain: An integrated production, inventory, warehouse lo...Logistics and Supply Chain: An integrated production, inventory, warehouse lo...
Logistics and Supply Chain: An integrated production, inventory, warehouse lo...FGV Brazil
 
Perfect vs Oligopolistic Competition Assignment Help
Perfect vs Oligopolistic Competition Assignment HelpPerfect vs Oligopolistic Competition Assignment Help
Perfect vs Oligopolistic Competition Assignment HelpSample Assignment
 
The Effects of Crossdock Shapes on Material Handling Costs
The Effects of Crossdock Shapes on Material Handling CostsThe Effects of Crossdock Shapes on Material Handling Costs
The Effects of Crossdock Shapes on Material Handling Costsijceronline
 
HYBRID ANT COLONY ALGORITHM FOR THE MULTI-DEPOT PERIODIC OPEN CAPACITATED ARC...
HYBRID ANT COLONY ALGORITHM FOR THE MULTI-DEPOT PERIODIC OPEN CAPACITATED ARC...HYBRID ANT COLONY ALGORITHM FOR THE MULTI-DEPOT PERIODIC OPEN CAPACITATED ARC...
HYBRID ANT COLONY ALGORITHM FOR THE MULTI-DEPOT PERIODIC OPEN CAPACITATED ARC...ijaia
 

What's hot (7)

Robust Counterpart Open Capacitated Vehicle Routing (RC-OCVRP) Model in Opti...
Robust Counterpart Open Capacitated Vehicle Routing  (RC-OCVRP) Model in Opti...Robust Counterpart Open Capacitated Vehicle Routing  (RC-OCVRP) Model in Opti...
Robust Counterpart Open Capacitated Vehicle Routing (RC-OCVRP) Model in Opti...
 
On The Use of Transportation Techniques to Determine the Cost of Transporting...
On The Use of Transportation Techniques to Determine the Cost of Transporting...On The Use of Transportation Techniques to Determine the Cost of Transporting...
On The Use of Transportation Techniques to Determine the Cost of Transporting...
 
Logistics and Supply Chain: An integrated production, inventory, warehouse lo...
Logistics and Supply Chain: An integrated production, inventory, warehouse lo...Logistics and Supply Chain: An integrated production, inventory, warehouse lo...
Logistics and Supply Chain: An integrated production, inventory, warehouse lo...
 
Perfect vs Oligopolistic Competition Assignment Help
Perfect vs Oligopolistic Competition Assignment HelpPerfect vs Oligopolistic Competition Assignment Help
Perfect vs Oligopolistic Competition Assignment Help
 
The Effects of Crossdock Shapes on Material Handling Costs
The Effects of Crossdock Shapes on Material Handling CostsThe Effects of Crossdock Shapes on Material Handling Costs
The Effects of Crossdock Shapes on Material Handling Costs
 
HYBRID ANT COLONY ALGORITHM FOR THE MULTI-DEPOT PERIODIC OPEN CAPACITATED ARC...
HYBRID ANT COLONY ALGORITHM FOR THE MULTI-DEPOT PERIODIC OPEN CAPACITATED ARC...HYBRID ANT COLONY ALGORITHM FOR THE MULTI-DEPOT PERIODIC OPEN CAPACITATED ARC...
HYBRID ANT COLONY ALGORITHM FOR THE MULTI-DEPOT PERIODIC OPEN CAPACITATED ARC...
 
Jiec.12964
Jiec.12964Jiec.12964
Jiec.12964
 

Similar to Optimizing Industrial Waste Collection Network Design

Optimizing waste collection in an organized industrial region: A case study
Optimizing waste collection in an organized industrial region: A case studyOptimizing waste collection in an organized industrial region: A case study
Optimizing waste collection in an organized industrial region: A case studyGurdal Ertek
 
Spreadsheet Optimization of Flow for WIP Goods at a Yarn and Tire Cord Manufa...
Spreadsheet Optimization of Flow for WIP Goods at a Yarn and Tire Cord Manufa...Spreadsheet Optimization of Flow for WIP Goods at a Yarn and Tire Cord Manufa...
Spreadsheet Optimization of Flow for WIP Goods at a Yarn and Tire Cord Manufa...Gurdal Ertek
 
Optimal Allocation Policy for Fleet Management
Optimal Allocation Policy for Fleet ManagementOptimal Allocation Policy for Fleet Management
Optimal Allocation Policy for Fleet ManagementYogeshIJTSRD
 
A New Network Flow Model for Determining the Assortment of Roll Types in Pack...
A New Network Flow Model for Determining the Assortment of Roll Types in Pack...A New Network Flow Model for Determining the Assortment of Roll Types in Pack...
A New Network Flow Model for Determining the Assortment of Roll Types in Pack...Gurdal Ertek
 
Application of local search methods for solving a quadratic assignment proble...
Application of local search methods for solving a quadratic assignment proble...Application of local search methods for solving a quadratic assignment proble...
Application of local search methods for solving a quadratic assignment proble...Gurdal Ertek
 
smartcities-04-00022 (1).pdf
smartcities-04-00022 (1).pdfsmartcities-04-00022 (1).pdf
smartcities-04-00022 (1).pdfVara Prasad
 
Inclusion of environmental constraints into siting and sizing
Inclusion of environmental constraints into siting and sizingInclusion of environmental constraints into siting and sizing
Inclusion of environmental constraints into siting and sizingIAEME Publication
 
Vehicle route scheduling and transportation cost minimization in a latex indu...
Vehicle route scheduling and transportation cost minimization in a latex indu...Vehicle route scheduling and transportation cost minimization in a latex indu...
Vehicle route scheduling and transportation cost minimization in a latex indu...IJRES Journal
 
IRJET- A Review: Design, Analysis & Optimization of Drag Chain Conveyer
IRJET- A Review: Design, Analysis & Optimization of Drag Chain ConveyerIRJET- A Review: Design, Analysis & Optimization of Drag Chain Conveyer
IRJET- A Review: Design, Analysis & Optimization of Drag Chain ConveyerIRJET Journal
 
A Minimum Spanning Tree Approach of Solving a Transportation Problem
A Minimum Spanning Tree Approach of Solving a Transportation ProblemA Minimum Spanning Tree Approach of Solving a Transportation Problem
A Minimum Spanning Tree Approach of Solving a Transportation Probleminventionjournals
 
Financial Benchmarking Of Transportation Companies In The New York Stock Exc...
Financial Benchmarking Of Transportation Companies  In The New York Stock Exc...Financial Benchmarking Of Transportation Companies  In The New York Stock Exc...
Financial Benchmarking Of Transportation Companies In The New York Stock Exc...ertekg
 
Application Of Local Search Methods For Solving A Quadratic Assignment Probl...
Application Of Local Search Methods For Solving  A Quadratic Assignment Probl...Application Of Local Search Methods For Solving  A Quadratic Assignment Probl...
Application Of Local Search Methods For Solving A Quadratic Assignment Probl...ertekg
 
A Minimum Spanning Tree Approach of Solving a Transportation Problem
A Minimum Spanning Tree Approach of Solving a Transportation ProblemA Minimum Spanning Tree Approach of Solving a Transportation Problem
A Minimum Spanning Tree Approach of Solving a Transportation Probleminventionjournals
 
Risk management and identification of side effects
Risk management and identification of side effectsRisk management and identification of side effects
Risk management and identification of side effectsOlgaRodrguezLargo
 
23 Equipment Selection For Mining With Case Studies
23 Equipment Selection For Mining  With Case Studies23 Equipment Selection For Mining  With Case Studies
23 Equipment Selection For Mining With Case StudiesBrittany Brown
 
A New Mathematical Model for Minimization of Exceptional Load in Cellular Man...
A New Mathematical Model for Minimization of Exceptional Load in Cellular Man...A New Mathematical Model for Minimization of Exceptional Load in Cellular Man...
A New Mathematical Model for Minimization of Exceptional Load in Cellular Man...IJRES Journal
 
An application of fuzzy cognitive mapping in optimization of inventory functi...
An application of fuzzy cognitive mapping in optimization of inventory functi...An application of fuzzy cognitive mapping in optimization of inventory functi...
An application of fuzzy cognitive mapping in optimization of inventory functi...iaemedu
 

Similar to Optimizing Industrial Waste Collection Network Design (20)

Optimizing waste collection in an organized industrial region: A case study
Optimizing waste collection in an organized industrial region: A case studyOptimizing waste collection in an organized industrial region: A case study
Optimizing waste collection in an organized industrial region: A case study
 
Spreadsheet Optimization of Flow for WIP Goods at a Yarn and Tire Cord Manufa...
Spreadsheet Optimization of Flow for WIP Goods at a Yarn and Tire Cord Manufa...Spreadsheet Optimization of Flow for WIP Goods at a Yarn and Tire Cord Manufa...
Spreadsheet Optimization of Flow for WIP Goods at a Yarn and Tire Cord Manufa...
 
C0151823
C0151823C0151823
C0151823
 
Optimal Allocation Policy for Fleet Management
Optimal Allocation Policy for Fleet ManagementOptimal Allocation Policy for Fleet Management
Optimal Allocation Policy for Fleet Management
 
A New Network Flow Model for Determining the Assortment of Roll Types in Pack...
A New Network Flow Model for Determining the Assortment of Roll Types in Pack...A New Network Flow Model for Determining the Assortment of Roll Types in Pack...
A New Network Flow Model for Determining the Assortment of Roll Types in Pack...
 
Application of local search methods for solving a quadratic assignment proble...
Application of local search methods for solving a quadratic assignment proble...Application of local search methods for solving a quadratic assignment proble...
Application of local search methods for solving a quadratic assignment proble...
 
smartcities-04-00022 (1).pdf
smartcities-04-00022 (1).pdfsmartcities-04-00022 (1).pdf
smartcities-04-00022 (1).pdf
 
Inclusion of environmental constraints into siting and sizing
Inclusion of environmental constraints into siting and sizingInclusion of environmental constraints into siting and sizing
Inclusion of environmental constraints into siting and sizing
 
Vehicle route scheduling and transportation cost minimization in a latex indu...
Vehicle route scheduling and transportation cost minimization in a latex indu...Vehicle route scheduling and transportation cost minimization in a latex indu...
Vehicle route scheduling and transportation cost minimization in a latex indu...
 
IRJET- A Review: Design, Analysis & Optimization of Drag Chain Conveyer
IRJET- A Review: Design, Analysis & Optimization of Drag Chain ConveyerIRJET- A Review: Design, Analysis & Optimization of Drag Chain Conveyer
IRJET- A Review: Design, Analysis & Optimization of Drag Chain Conveyer
 
A Minimum Spanning Tree Approach of Solving a Transportation Problem
A Minimum Spanning Tree Approach of Solving a Transportation ProblemA Minimum Spanning Tree Approach of Solving a Transportation Problem
A Minimum Spanning Tree Approach of Solving a Transportation Problem
 
Financial Benchmarking Of Transportation Companies In The New York Stock Exc...
Financial Benchmarking Of Transportation Companies  In The New York Stock Exc...Financial Benchmarking Of Transportation Companies  In The New York Stock Exc...
Financial Benchmarking Of Transportation Companies In The New York Stock Exc...
 
Optimisation of Recycled Thermoplastic Plate (Tile)
Optimisation of Recycled Thermoplastic Plate (Tile)Optimisation of Recycled Thermoplastic Plate (Tile)
Optimisation of Recycled Thermoplastic Plate (Tile)
 
Application Of Local Search Methods For Solving A Quadratic Assignment Probl...
Application Of Local Search Methods For Solving  A Quadratic Assignment Probl...Application Of Local Search Methods For Solving  A Quadratic Assignment Probl...
Application Of Local Search Methods For Solving A Quadratic Assignment Probl...
 
A Minimum Spanning Tree Approach of Solving a Transportation Problem
A Minimum Spanning Tree Approach of Solving a Transportation ProblemA Minimum Spanning Tree Approach of Solving a Transportation Problem
A Minimum Spanning Tree Approach of Solving a Transportation Problem
 
Risk management and identification of side effects
Risk management and identification of side effectsRisk management and identification of side effects
Risk management and identification of side effects
 
23 Equipment Selection For Mining With Case Studies
23 Equipment Selection For Mining  With Case Studies23 Equipment Selection For Mining  With Case Studies
23 Equipment Selection For Mining With Case Studies
 
A New Mathematical Model for Minimization of Exceptional Load in Cellular Man...
A New Mathematical Model for Minimization of Exceptional Load in Cellular Man...A New Mathematical Model for Minimization of Exceptional Load in Cellular Man...
A New Mathematical Model for Minimization of Exceptional Load in Cellular Man...
 
Ar31302307
Ar31302307Ar31302307
Ar31302307
 
An application of fuzzy cognitive mapping in optimization of inventory functi...
An application of fuzzy cognitive mapping in optimization of inventory functi...An application of fuzzy cognitive mapping in optimization of inventory functi...
An application of fuzzy cognitive mapping in optimization of inventory functi...
 

More from ertekg

Rule-based expert systems for supporting university students
Rule-based expert systems for supporting university studentsRule-based expert systems for supporting university students
Rule-based expert systems for supporting university studentsertekg
 
Optimizing the electric charge station network of EŞARJ
Optimizing the electric charge station network of EŞARJOptimizing the electric charge station network of EŞARJ
Optimizing the electric charge station network of EŞARJertekg
 
Competitiveness of Top 100 U.S. Universities: A Benchmark Study Using Data En...
Competitiveness of Top 100 U.S. Universities: A Benchmark Study Using Data En...Competitiveness of Top 100 U.S. Universities: A Benchmark Study Using Data En...
Competitiveness of Top 100 U.S. Universities: A Benchmark Study Using Data En...ertekg
 
Industrial Benchmarking through Information Visualization and Data Envelopmen...
Industrial Benchmarking through Information Visualization and Data Envelopmen...Industrial Benchmarking through Information Visualization and Data Envelopmen...
Industrial Benchmarking through Information Visualization and Data Envelopmen...ertekg
 
Modelling the supply chain perception gaps
Modelling the supply chain perception gapsModelling the supply chain perception gaps
Modelling the supply chain perception gapsertekg
 
Risk Factors and Identifiers for Alzheimer’s Disease: A Data Mining Analysis
Risk Factors and Identifiers for Alzheimer’s Disease:  A Data Mining AnalysisRisk Factors and Identifiers for Alzheimer’s Disease:  A Data Mining Analysis
Risk Factors and Identifiers for Alzheimer’s Disease: A Data Mining Analysisertekg
 
Text Mining with RapidMiner
Text Mining with RapidMinerText Mining with RapidMiner
Text Mining with RapidMinerertekg
 
Competitive Pattern-Based Strategies under Complexity: The Case of Turkish Ma...
Competitive Pattern-Based Strategies under Complexity: The Case of Turkish Ma...Competitive Pattern-Based Strategies under Complexity: The Case of Turkish Ma...
Competitive Pattern-Based Strategies under Complexity: The Case of Turkish Ma...ertekg
 
Supplier and Buyer Driven Channels in a Two-Stage Supply Chain
Supplier and Buyer Driven Channels in a  Two-Stage Supply ChainSupplier and Buyer Driven Channels in a  Two-Stage Supply Chain
Supplier and Buyer Driven Channels in a Two-Stage Supply Chainertekg
 
Simulation Modeling For Quality And Productivity In Steel Cord Manufacturing
Simulation Modeling For Quality And Productivity In Steel Cord ManufacturingSimulation Modeling For Quality And Productivity In Steel Cord Manufacturing
Simulation Modeling For Quality And Productivity In Steel Cord Manufacturingertekg
 
Visual and analytical mining of transactions data for production planning f...
Visual and analytical mining of transactions data  for production planning  f...Visual and analytical mining of transactions data  for production planning  f...
Visual and analytical mining of transactions data for production planning f...ertekg
 
A Tutorial On Crossdocking
A Tutorial On CrossdockingA Tutorial On Crossdocking
A Tutorial On Crossdockingertekg
 
Demonstrating Warehousing Concepts Through Interactive Animations
Demonstrating Warehousing Concepts Through Interactive AnimationsDemonstrating Warehousing Concepts Through Interactive Animations
Demonstrating Warehousing Concepts Through Interactive Animationsertekg
 
A Framework for Visualizing Association Mining Results
A Framework for Visualizing  Association Mining ResultsA Framework for Visualizing  Association Mining Results
A Framework for Visualizing Association Mining Resultsertekg
 
Compiere kurulumu
Compiere kurulumuCompiere kurulumu
Compiere kurulumuertekg
 
Application of the Cutting Stock Problem to a Construction Company: A Case Study
Application of the Cutting Stock Problem to a Construction Company: A Case StudyApplication of the Cutting Stock Problem to a Construction Company: A Case Study
Application of the Cutting Stock Problem to a Construction Company: A Case Studyertekg
 
Benchmarking The Turkish Apparel Retail Industry Through Data Envelopment Ana...
Benchmarking The Turkish Apparel Retail Industry Through Data Envelopment Ana...Benchmarking The Turkish Apparel Retail Industry Through Data Envelopment Ana...
Benchmarking The Turkish Apparel Retail Industry Through Data Envelopment Ana...ertekg
 
Visual Mining of Science Citation Data for Benchmarking Scientific and Techno...
Visual Mining of Science Citation Data for Benchmarking Scientific and Techno...Visual Mining of Science Citation Data for Benchmarking Scientific and Techno...
Visual Mining of Science Citation Data for Benchmarking Scientific and Techno...ertekg
 
An Open Source Java Code For Visualizing Supply Chain Problems
An Open Source Java Code For Visualizing Supply Chain ProblemsAn Open Source Java Code For Visualizing Supply Chain Problems
An Open Source Java Code For Visualizing Supply Chain Problemsertekg
 
Dairy Logistics: A Tutorial
Dairy Logistics: A TutorialDairy Logistics: A Tutorial
Dairy Logistics: A Tutorialertekg
 

More from ertekg (20)

Rule-based expert systems for supporting university students
Rule-based expert systems for supporting university studentsRule-based expert systems for supporting university students
Rule-based expert systems for supporting university students
 
Optimizing the electric charge station network of EŞARJ
Optimizing the electric charge station network of EŞARJOptimizing the electric charge station network of EŞARJ
Optimizing the electric charge station network of EŞARJ
 
Competitiveness of Top 100 U.S. Universities: A Benchmark Study Using Data En...
Competitiveness of Top 100 U.S. Universities: A Benchmark Study Using Data En...Competitiveness of Top 100 U.S. Universities: A Benchmark Study Using Data En...
Competitiveness of Top 100 U.S. Universities: A Benchmark Study Using Data En...
 
Industrial Benchmarking through Information Visualization and Data Envelopmen...
Industrial Benchmarking through Information Visualization and Data Envelopmen...Industrial Benchmarking through Information Visualization and Data Envelopmen...
Industrial Benchmarking through Information Visualization and Data Envelopmen...
 
Modelling the supply chain perception gaps
Modelling the supply chain perception gapsModelling the supply chain perception gaps
Modelling the supply chain perception gaps
 
Risk Factors and Identifiers for Alzheimer’s Disease: A Data Mining Analysis
Risk Factors and Identifiers for Alzheimer’s Disease:  A Data Mining AnalysisRisk Factors and Identifiers for Alzheimer’s Disease:  A Data Mining Analysis
Risk Factors and Identifiers for Alzheimer’s Disease: A Data Mining Analysis
 
Text Mining with RapidMiner
Text Mining with RapidMinerText Mining with RapidMiner
Text Mining with RapidMiner
 
Competitive Pattern-Based Strategies under Complexity: The Case of Turkish Ma...
Competitive Pattern-Based Strategies under Complexity: The Case of Turkish Ma...Competitive Pattern-Based Strategies under Complexity: The Case of Turkish Ma...
Competitive Pattern-Based Strategies under Complexity: The Case of Turkish Ma...
 
Supplier and Buyer Driven Channels in a Two-Stage Supply Chain
Supplier and Buyer Driven Channels in a  Two-Stage Supply ChainSupplier and Buyer Driven Channels in a  Two-Stage Supply Chain
Supplier and Buyer Driven Channels in a Two-Stage Supply Chain
 
Simulation Modeling For Quality And Productivity In Steel Cord Manufacturing
Simulation Modeling For Quality And Productivity In Steel Cord ManufacturingSimulation Modeling For Quality And Productivity In Steel Cord Manufacturing
Simulation Modeling For Quality And Productivity In Steel Cord Manufacturing
 
Visual and analytical mining of transactions data for production planning f...
Visual and analytical mining of transactions data  for production planning  f...Visual and analytical mining of transactions data  for production planning  f...
Visual and analytical mining of transactions data for production planning f...
 
A Tutorial On Crossdocking
A Tutorial On CrossdockingA Tutorial On Crossdocking
A Tutorial On Crossdocking
 
Demonstrating Warehousing Concepts Through Interactive Animations
Demonstrating Warehousing Concepts Through Interactive AnimationsDemonstrating Warehousing Concepts Through Interactive Animations
Demonstrating Warehousing Concepts Through Interactive Animations
 
A Framework for Visualizing Association Mining Results
A Framework for Visualizing  Association Mining ResultsA Framework for Visualizing  Association Mining Results
A Framework for Visualizing Association Mining Results
 
Compiere kurulumu
Compiere kurulumuCompiere kurulumu
Compiere kurulumu
 
Application of the Cutting Stock Problem to a Construction Company: A Case Study
Application of the Cutting Stock Problem to a Construction Company: A Case StudyApplication of the Cutting Stock Problem to a Construction Company: A Case Study
Application of the Cutting Stock Problem to a Construction Company: A Case Study
 
Benchmarking The Turkish Apparel Retail Industry Through Data Envelopment Ana...
Benchmarking The Turkish Apparel Retail Industry Through Data Envelopment Ana...Benchmarking The Turkish Apparel Retail Industry Through Data Envelopment Ana...
Benchmarking The Turkish Apparel Retail Industry Through Data Envelopment Ana...
 
Visual Mining of Science Citation Data for Benchmarking Scientific and Techno...
Visual Mining of Science Citation Data for Benchmarking Scientific and Techno...Visual Mining of Science Citation Data for Benchmarking Scientific and Techno...
Visual Mining of Science Citation Data for Benchmarking Scientific and Techno...
 
An Open Source Java Code For Visualizing Supply Chain Problems
An Open Source Java Code For Visualizing Supply Chain ProblemsAn Open Source Java Code For Visualizing Supply Chain Problems
An Open Source Java Code For Visualizing Supply Chain Problems
 
Dairy Logistics: A Tutorial
Dairy Logistics: A TutorialDairy Logistics: A Tutorial
Dairy Logistics: A Tutorial
 

Optimizing Industrial Waste Collection Network Design

  • 1. Martagan, T. G., Ertek, G., Birbil, S. I., Yasar, M., Cakır, A., Okur, N., Gullu, G., Hacıoglu, A. and Sevim, O. (2006). "Optimizing waste collection in an organized industrial region: A case study.” 4th International Logistics and Supply Chain Congress, İzmir, Turkey. Note: This is the final draft version of this paper. Please cite this paper (or this final draft) as above. You can download this final draft from http://research.sabanciuniv.edu. OPTIMIZING WASTE COLLECTION IN AN ORGANIZED INDUSTRIAL REGION: A CASE STUDY Tuğçe Gizem Martağan1, Gürdal Ertek2, Ş. İlker Birbil3, Murat Yaşar, Ahmet Çakır, Nazım Okur, Gürdal Güllü, Ahmet Hacıoğlu, and Özgür Sevim Abstract In this paper we present a case study which involves the design of a supply chain network for industrial waste collection. The problem is to transport metal waste from 17 factories to containers and from containers to a disposal center (DC) at an organized region of automobile parts suppliers. We applied the classic mixed- integer programming (MIP) model for the two-stage supply chain to the solution 1 Sabancı University, Turkey, 2 Sabancı University, Turkey, 3 Sabancı University, Turkey, 4th International Logistics and Supply Chain Management Congress
  • 2. of this problem. The visualization of the optimal solution provided us with several interesting insights that would not be easily discovered otherwise. Keywords: Logistics of industrial waste, Supply chain network design, Waste collection, Waste management, Facility location, Organized industrial regions. 1. Introduction The problem presented in this paper consists of planning the logistics of industrial waste collection from factories located in an organized industrial region, to suitable intermediate points which are possible container locations, and finally to disposal centers. The main process leading to solution of this waste collection problem is designing a network model according to the cost analysis, and determining waste container locations based on their capacities and locations. The problem can be treated as a transhipment problem aiming to select the best intermediate points for waste transfer while minimizing transportation costs in the waste collection network (Section 2). After building the model and reaching the optimal solution minimizing the total cost, a Java program that can read input files was coded in order to visualize the solution (Section 3). At the visualization stage, the values of the parameters and variables were mapped to the sizes of the nodes and thickness of the arcs. Figure 1. The candidate container locations displayed on a map of TOSB. 4th International Logistics and Supply Chain Management Congress
  • 3. The industrial waste collection problem discussed in this paper was done as a graduation project at Sabancı University in 2005-2006 academic year. Distinguishing aspects of this study are that the problem is an example of environmental operations research is based on an estimate of real world data and that visualization is carried out. The used method and obtained solution have practical aspects which make them be easily adoptable to the one of the problems of organized industrial regions. This has also environmental contributions because of the fact that collected industrial waste such as metals are recycled. Furthermore, network visualization obtained by Java in the final phase leads to a better understanding of the solution and assessment of the designed supply chain network. In the model, data from TOSB (TAYSAD Organize Sanayi Bölgesi - TAYSAD Organized Industrial Region) was used. The reasons for selecting to develop a model with TOSB (TOSB) data were as follows:  TAYSAD (Taşıt Araçları Yan Sanayicileri Derneği, Association of Automotive Parts & Components Manufacturers), founded in 1978, is the most powerful association in the automobile parts supplier industry with %65 market share in Turkey. TAYSAD companies operate especially in Istanbul, Kocaeli and Bursa. TAYSAD is also a member of CLEPA, European Association of Automotive Suppliers.  TOSB consists of 59 of 170 members of TAYSAD. Founded on a 625 acre (2.53 km2) of land, TOSB is one of the most important industrial regions chosen by Turkish and as well as foreign automotive parts manufacturers. Additionally, Turkish automotive parts supplier industry has approximately 700 firms operating with latest technology and makes %70 of its exports to European Union countries. This industry has a considerable contribution to the Turkish economy: In 2003, $2.4 billion of exports were achieved by Turkish automotive parts suppliers.  The fact that TOSB is located in Gebze, within close proximity of Sabancı University has highly motivated us as the project team, since we would have a chance to suggest a solution to a practical real-world problem in our neighbourhood. Meanwhile, Sabancı University has close ties with TAYSAD thanks to common projects between The Competitiveness Forum (Competitiveness Forum) of Sabancı University and TAYSAD. 4th International Logistics and Supply Chain Management Congress
  • 4. 2. The Model In TOSB, 17 factories, 5 candidate container locations and one disposal center (DC) where total waste will be sent are available (Figure 1). Different amounts of waste from each factory are sent to suitable container locations from where they will be than transferred to the DC. The objective is to minimize total transportation cost under capacity constraints for the containers. This supply chain network design problem contains three sets of nodes (factories, containers and DC) and two sets of arcs (from factories to containers and from containers to the DC), hence the name two- stage supply chain. The set I represents factories which are the source nodes producing wi tons of waste monthly. Intermediate nodes representing candidate container locations constitute the set J. In these sites indexed by j, container location decisions are reflected by binary variables zj. There are three sets of decision variables: zj, xij, yj representing location and flow decisions. Since binary variables are present in the model together with continuous variables, the problem can be classified as a mixed integer programming (MIP) problem. The model is given bellow: SETS I : set of factories, i  1,, n J : set of candidate container locations, j  1,, m PARAMETERS aij : cost of sending one ton of waste from factory i to container location j b j : cost of sending one ton of waste from container location j to DC wi : monthly waste amount of factory i C : maximum monthly capacity of each container f j : monthly fixed cost of operating a container at container location j VARIABLES z j : 1, if a container is located at container location j ; 0 otherwise xij : amount of monthly flow of waste from factory i to container location j y j : amount of monthly flow of waste from container location j to disposal center (DC) 4th International Logistics and Supply Chain Management Congress
  • 5. Min  a iI jJ ij xij   f j z j   b j y j jJ jJ s.t. y j  Cz j j  J (1) Capacity and Linking constraints x iI ij  yj j  J (2) Flow balance constraints: Containers x jJ ij  wi i  I (3) Flow balance constraints: Factories z j binary; xij , y j  0 (4) Binary z j and Nonnegativity In the objective function, the total cost in the supply chain is to be minimized: The first summation represents the total cost of transferring waste from factories to container locations; the second summation represents the total fixed cost of opened containers (assuming that each container has a lifetime of one year); and the last summation represents the total cost of transferring waste from containers to the DC. The constraints are as follows: 1. The first constraint set representing capacity constraints assures that monthly flow of waste from container location j does not exceed the maximum monthly capacity. As can be observed, the capacity of every container is assumed to be identical, namely C. This constraint set also links the selection of container location j to the monthly waste flow from that container to DC. There can be a monthly flow from container location j to DC only if a container is located at a container location j. 2. The second constraint set assures that the total amount of waste coming from different factories to a container j is the same as the total amount of waste transferred from that container j to the DC. 3. The third constraint set ensures that outgoing waste from a factory i is equal to its monthly amount of waste. 4th International Logistics and Supply Chain Management Congress
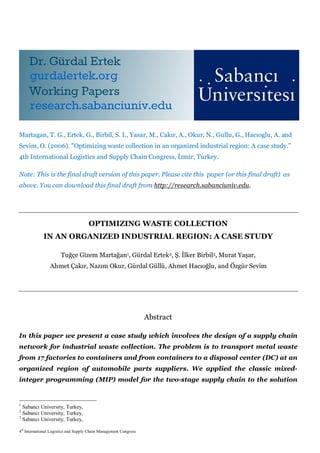
  • 6. 4. The fourth constraint set specifies that the zj are binary and that the other variables are nonnegative In order to solve the model presented above, we have decided to use GAMS (General Algebraic Modelling Systems), a high-level modeling system for mathematical programming and optimization (GAMS). We have decided to use CPLEX (ILOG) as the MIP solver. The model is built based on the TOSB data, which contains 17 factories, 5 candidate container locations and one DC. The complete GAMS model is given in Appendix A. We would like to remark that the real world values are distorted and thus hidden in the given GAMS model due to confidentiality issues. However the magnitude of costs are of the same scale. Construction of the model required the declaration of sets I and J and their elements as I = {f1, f2, f3,…., f16, f17} and J = {c1,c2, c3, c4, c5}, respectively. The maximum monthly capacity C of each container is taken as 600 tons. Distances are calculated based on the actual road structure of TOSB for each arc and then the costs on the arcs are determined by taking fuel costs and staff expenses into account. All of the costs are monthly and in terms of YTL (new Turkish lira). In the optimal solution, minimum monthly cost of the waste transfer from factories to container locations and then to the DC is 70,338 YTL (approximately $48,000). Three container locations (c1, c3, c4) out of the five candidates were selected to be opened by the solver. 3. Network Visualization Following the development of the mathematical model and the GAMS model, we have carried out a visualization of the solution that was found by CPLEX. Visualization can dramatically enhance one’s understanding of the optimization results and enable perception of useful and interesting insights. Some supply chain design/optimization software (CIMPEL, HKUST, Llamasoft, LogisticTools, Logistics Simulation, The Logistics Institute) are known to visually represent supply chain networks. Meanwhile, the paper by Camm et al. (1997) is a supply chain classic from the operations research / industrial engineering literature. In their paper, the authors describe an optimization based information system that is supported by GIS (Geographical Information System) visualization. The system they describe is reported to save more than $200 million for the consumer products giant Procter & Gamble. The visualization in our study (Figure 2) was carried out through a simple Java program that reads two input files, namely problem.txt and solution.txt (given in Appendix B with distorted parameter values, ex: factory coordinates and flows). In this visualization only the containers that 4th International Logistics and Supply Chain Management Congress
  • 7. appear in the optimal solution are displayed. Each factory is represented by a circle filled with blue. The magnitudes of the flows between nodes are reflected in the thickness of the arcs. Flows in the first stage (factories and containers) of the supply chain are represented by red arcs and flows in the second stage (containers and DC) are represented by black arcs. The arc labels denote the amount of flows on the arcs in tons. Figure 2. The Java visualization of the optimal supply chain network. From Figure 2 one can observe that there exists a significant amount of flow from factories 8 and 16 (f8, f16) to container 4 (c4). Meanwhile there exist relatively significant amounts of flow 4th International Logistics and Supply Chain Management Congress
  • 8. from factories 4, 9, 12 (f4, f9, f12) to container 1 (c1). By observing the thickness of the black arcs from containers 1 and 4 to the DC, one can conclude that these two containers are utilized to full capacity. On the other hand, container 3 is not utilized to full capacity, since the arc from that container to the DC is approximately half as thick as the other black arcs. All the factories send their waste to a single container (single-sink), except factories 4 and 15 (f4, f15). The visualization of the network allowed us to make the above observations, which would be very hard to make by looking at the text output of the GAMS solution. Thus we believe that the extra effort spent for the visualization is highly justified. 4. Related Literature Amponsah and Salhi (2004) argue that waste collection problem is one of the most crucial problems for large cities and local authorities. Waste collection and solid waste management pose importance since some wastes contain toxic and hazardous ingredients, where some others are recycled. Literature contains studies focusing on efficient waste collection, supply chain network designs leading to operational cost savings. There are many related problems, including Vehicle Routing Problem (VRP), where the main aim is to incur the minimum total cost while routing multiple numbers of vehicles, going out from a depot, visiting intermediate nodes and returning back to the depot. (Tung, D. V., Pinnoi, A., 1999). Minimizing number of vehicles can be another objective in VRP. Vehicle Scheduling and Routing Problem (VSRP) can be considered as an extension of VRP with time periods and place requirements constraints (Johansson, O. M., 2005). Additionally, Vehicle Routing Problem with Time Windows (VRPTW) includes time windows between which the nodes have to be visited (Kim, B. I. et al., 2005). Other problem variants include Periodic Vehicle Routing Problem (PVRP) (Teixeira et al., 2004) and Capacitated Arc Routing Problem (CARP) (Chu, et al., 2004). The model which is most related to the network design problem in this paper is presented by Rahman et al. (1995). The authors refer to the problem as the Solid Waste Transfer Stations (SWTS) location problem and solve it for the City of Phoenix, Arizona. Their model aims to select the most suitable intermediate nodes to transfer materials with the objective of minimizing transportation costs. In their paper, they also develop an additional approach to SWTS by minimizing public opposition. It is also possible to find out several works about waste management in Turkey. For example, Koçer et al. (2003) investigated waste collection, waste transfer costs and waste disposal areas in 4th International Logistics and Supply Chain Management Congress
  • 9. Elazığ, Turkey. In their research, they considered criteria such as location of the waste area, population, daily amount of waste, container capacities, weight of waste, costs, time, and productivity in waste management. They conclude that first of all, records for waste quantities and costs should be kept and secondly the number of workers, distances of transportation, capacities of the containers and their technical capabilities affect productivity. Another research is done by Karagüzel and Mutlutürk (2005), who considered geological, hydro geological, topographical criteria and observed environmental protection areas, land sliding and flooding in order to select the most suitable waste area in Isparta, Turkey. Demir et al. (2001) studied the design of waste transportation and waste collection in Yenimahalle, Ankara, Turkey. They have developed a long-term and short-term plan for waste collection and logistics and selected the transfer stations. They have developed a mathematical model similar to the one presented in our paper but additionally, they also considered allocation of trucks to collection areas, frequency of the collections and definition of the optimal roads. Their study also includes financial analysis. 5. Conclusions We have presented the application of optimization to a real-world industrial waste collection problem. Two distinguishing aspects of our study are the following: 1. The model was built using real-world data provided by the management of the industrial region and estimated values which we believe are close enough to the real values (however, the values given in the paper for the model and its solution are distorted due to confidentiality agreements). 2. The optimal solution was visualized, enabling the observation of several interesting issues. Mathematical programming, specifically mixed integer programming (MIP) is an essential tool to model and solve strategic and tactical managerial problems of industrial regions. Industrial regions in developing countries such as Turkey can highly benefit from this approach, as illustrated in our study. Meanwhile, visualization can contribute greatly to the usability and thus acceptance of optimization models in industry. 4th International Logistics and Supply Chain Management Congress
  • 10. 6. References Amponsah, S. K., Salhi, S. 2004. The investigation of a class of capacitated arc routing problems: the collection of garbage in developing countries. Waste Management, 24: 711–721. CIMPEL. http://www2.isye.gatech.edu/~mgoetsch/research.html#Cimpel Camm, J. D., Chorman, T. E., Dill, F. A., Evans, J. R., Sweeney, D. J., Wegryn, G. W. 1997. Blending OR/MS, judgment, and GIS: Restructuring P&G’s supply chain. Interfaces, 27: 128- 142. Chu, F., Labadi, N., Prins, C. 2004. Heuristics for the periodic capacitated arc routing problem. Journal of Intelligent Manufacturing, 16: 243-251. Competitiveness Forum. http://www.ref.sabanciuniv.edu Demir, E., Gültekin, D., Sandıkçıoğlu, S., Şayhan, A., Yeşildağ, M., Kırca, Ö., Süral, H., Yenimahalle Belediyesi Katı Atık Toplama ve Taşıma Sistemleri tasarımı. Endüstri Mühendisliği Dergisi, 12(3-4): 52-64. GAMS. http://www.gams.com HKUST. http://www1.ieem.ust.hk/research/project_img/web9_l.jpg ILOG. http://www.ilog.com 4th International Logistics and Supply Chain Management Congress
  • 11. Johansson, O. M., 2006. The effect of dynamic scheduling and routing in a solid waste management system. Waste Management, 26: 875-885. Karagüzel, R., Mutlutürk, M., 2005. Katı atık depolamada yer seçimi: Isparta örneği. Mühendislik Jeolojisi Bülteni, 21: 19-33. Kim, B. I., Kim, S., Sahoo, S. 2006. Waste collection vehicle routing problem with time windows. Computers & Operations Research, 33: 3627-3642. Koçer, N., Öbek, E., Uslu, G. 2003. Elazığ kentinde atıkların toplama ve taşıma maliyeti ile çöp sahasının durumu. Fırat Üniversitesi Fen ve Mühendislik Dergisi, 15(2): 173-182. Llamasoft. http://www.llamasoft.com/network.html LogicTools. http://logic-tools.com Logistics Simulation. http://www.logsim.co.uk/index.htm Rahman, M., Kuby, M. 1995. A multiobjective model for locating solid waste transfer facilities using an empirical opposition function. INFOR, Ottowa, 33: 34-49 TAYSAD. http://www.taysad.org.tr 4th International Logistics and Supply Chain Management Congress
  • 12. Teixeira, J., Antunes, A. P., de Sousa, J. P. 2004. Recyclable waste collection planning - a case study. European Journal of Operational Research, 543-554. The Logistics Institute. http://www.tli.gatech.edu/research/projects/detail.php?id=22 TOSB. http://www.tosb.com.tr Tung, D. V., Pinnoi, A. 1999. Vehicle routing-scheduling for waste collection in Hanoi. European Journal of Operational Research, 125: 449-468. 4th International Logistics and Supply Chain Management Congress
  • 13. Appendix A. The GAMS Model SETS I Factories / f1*f17 / J Container Locations / c1*c5 / DC Disposal Center /d1/ ; PARAMETERS F(J) fixed monthly cost / c1 626 c2 626 c3 1252 c4 750 c5 750 / W(I) average monthly waste amount of factory i / f1 25 f2 75 f3 15 f4 120 f5 45 f6 30 f7 20 f8 270 4th International Logistics and Supply Chain Management Congress
  • 14. f9 140 f10 35 f11 80 f12 170 f13 55 f14 70 f15 90 f16 240 f17 25 / B(J) unit cost per ton from location j to dc / c1 36 c2 40 c3 36 c4 32 c5 44 /; TABLE A(I,J) unit cost per ton from factory i to location j c1 c2 c3 c4 c5 f1 26 16 6 32 24 f2 32 16 10 20 34 f3 30 32 22 46 6 f4 18 14 28 4 46 4th International Logistics and Supply Chain Management Congress
  • 15. f5 14 24 24 34 16 f6 28 30 18 44 10 f7 8 14 20 30 28 f8 26 22 32 4 54 f9 4 6 20 20 30 f10 24 12 6 22 32 f11 26 24 14 40 14 f12 16 30 26 38 16 f13 12 6 18 12 38 f14 22 34 24 44 10 f15 14 20 16 34 24 f16 26 20 34 12 52 f17 14 2 16 16 42 SCALAR capacity /600/; VARIABLES obj ; POSITIVE VARIABLES X(I,J) Y(J) ; BINARY VARIABLES Z(J) ; EQUATIONS 4th International Logistics and Supply Chain Management Congress
  • 16. COST objective function CAPLINK(J) FLOW(J) FLOW2(I); COST .. OBJ =E= SUM((I,J),A(I,J)*X(I,J)) + SUM(J, F(J)*Z(J)) + SUM(J, B(J)*Y(J)); CAPLINK(J).. Y(J) =L= CAPACITY*Z(j) ; FLOW(J).. SUM(I, X(I,J)) =E= Y(J) ; FLOW2(I).. SUM(J, X(I,J)) =E= W(I) ; MODEL TOSB_PROJECT /ALL/ ; option lp=CPLEX; SOLVE TOSB_PROJECT USING MIP MINIMIZING OBJ ; Appendix B problem.txt 4th International Logistics and Supply Chain Management Congress
  • 17. PROBLEM_FILE NO_OF_FACTORIES 17 NO_OF_CONTAINER_LOCATIONS 5 FACTORY_COORDINATES 16 10 12 14 … 10 8 CONTAINER_LOCATIONS 13 4 12 8 15 12 5 11 26 5 DISPOSAL_CENTER_LOCATION 10 10 a_ij 26 16 6 32 24 … b_j 36 40 36 32 44 w_i 25 75 15 120 45 30 20 270 140 35 80 170 55 70 90 240 25 4th International Logistics and Supply Chain Management Congress
  • 18. C 600 f_j 25 75 15 120 45 30 20 270 140 35 80 170 55 70 90 240 25 solution.txt SOLUTION_FILE x_ij 0 0 25 0 0 0 0 75 0 0 0 0 15 0 0 30 0 0 90 0 45 0 0 0 0 0 0 30 0 0 20 0 0 0 0 0 0 0 270 0 140 0 0 0 0 0 0 35 0 0 0 0 80 0 0 170 0 0 0 0 55 0 0 0 0 70 0 0 0 0 45 0 45 0 0 0 0 0 240 0 25 0 0 0 0 y_j 600 0 305 600 0 z_j 10110 4th International Logistics and Supply Chain Management Congress