Arsenic ..comarca lagunera
•
1 like•700 views

The document analyzes arsenic concentrations in water, soil, milk, and forage samples collected from dairy farms in Comarca Lagunera, Mexico, a region with naturally high arsenic levels. Water samples showed total arsenic concentrations ranging from 7 to 740 μg/L, with 90% as As(V). Soil samples had total arsenic up to 30 μg/g, though extractable arsenic did not exceed 12% of total. Arsenic in alfalfa, a key crop, ranged from 0.24 to 3.16 μg/g, with 40% in roots. Significant correlations were found between water and soil arsenic and between soil and alfalfa arsenic. Milk samples had

Recommended
Recommended
More Related Content
What's hot
What's hot (20)
Viewers also liked
Viewers also liked (8)
Similar to Arsenic ..comarca lagunera
Similar to Arsenic ..comarca lagunera (20)
More from Encuentro Ciudadano Lagunero
More from Encuentro Ciudadano Lagunero (20)
Arsenic ..comarca lagunera
- 1. ARSENIC CONCENTRATIONS IN WATER, SOIL, MILK AND FORAGE IN COMARCA LAGUNERA, MEXICO I. ROSAS1∗ , R. BELMONT1 , A. ARMIENTA2 and A. BAEZ1 1 Centro de Ciencias de la Atmósfera and 2 Instituto de Geofisica, Universidad Nacional Autónoma de México, México, D.F. 04510, México (∗ author for correspondence, e-mail: iarp@ccaunam.atmosfcu.unam.mx) (Received 10 June 1996; accepted 4 February 1997) Abstract. Arsenic levels were determined in seventy three samples of well water, and in fifty samples of soil, forage and cow’s milk collected at the most important dairy farms of the Comarca Lagunera located in Coahuila and Durango, Mexico, region naturally rich in As. The total inorganic arsenic concentration in well water ranged from 7 to 740 µg L−1 and about ninety percent of the total arsenic was found as As(V). The agricultural soil texture of the sampled area was sandy clay loam type with total arsenic levels up to 30 µg g−1 , however, the extractable arsenic was not higher than 12% of the total and it was higher in the 0–30 cm depth horizon. In alfalfa, the most important crop, the total aresenic ranged from 0.24 to 3.16 µg g−1 , with 40% of it accumulated at the root level. Significant correlations (p=0.05) were obtained between arsenic (III), (V) and total inorganic arsenic in groundwater with arsenic in soil (0–30 cm depth), and with arsenic in alfalfa (leaves and roots). It was also found a good correlation between extractable arsenic in soil with As concentrations in alfalfa (roots). Arsenic concentrations found in milk ranged from <0.9 to 27.4 ng g−1 . The cow’s milk biotransfer factor for arsenic was up to 6 × 10⁻⁴ , applying a pharmacokinetic approach. It was associated with the exposure not only to food but also to water arsenic. Keywords: arsenic, cow’s milk, forage, groundwater 1. Introduction Although high arsenic levels are found in several water sources in Mexico (Gonzá- lez, 1972; Armienta et al., 1997b), the As found in groundwater in Durango and Coahuila (Comarca Lagunera) has received more attention. The Comarca Lagunera is located in the central part of northern Mexico. It is an important cotton producing area, and other main economical activities are related to dairy products and mining operations. The climate is very dry with an annual rainfall around 250–350 mm. Therefore, the extraction of ground water from about 62 m depth is the main water resource. Since 1963, it is well known that most of this region has a substrate rich in arsenic, which produces high arsenic levels in ground water, as well as health effects on the population by the consumption of this water (Ortiz et al., 1963; Torres de Navarro, 1976; Cebrian et al., 1983). Water, Air, and Soil Pollution 112: 133–149, 1999. © 1999 Kluwer Academic Publishers. Printed in the Netherlands.
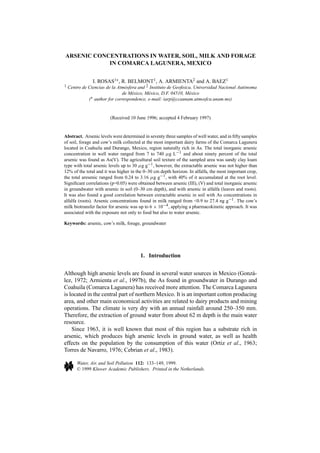
- 2. 134 I. ROSAS ET AL. Figure 1. Location of the counties (indicated by number) where dairy farms were sampled (indicated by circle). On the other hand, the distribution and fate of this metalloid in the agricul- tural environment has not yet been evaluated. Therefore the present study was undertaken with the following objectives: a) To determine arsenic concentration speciation in water, and to correlate these levels with the amount of extractable arsenic in soil. b) To determine the concentration of As in Alfalfa (leaves and roots) and corn’s silage, considering that these forages are consumed by dairy cattle. c) To evaluate the As biotransfer factor to milk. 2. Materials and Methods 2.1. S AMPLING Dairy farms of seven counties located at Durango and Coahuila States, Mexico (Figure 1), were sampled during 1992, in both rainy and dry seasons. Well-water, soil, alfalfa (leaves and roots), corn’s silage, and cow’s milk were sampled in six- teen dairy farms during the first sampling period (April) and in seventeen farms during the second and third sampling periods (July and October). The samples were obtained from each as follows:
- 3. ARSENIC CONCENTRATIONS IN WATER, SOIL, MILK AND FORAGE 135 2.1.1. Well Water To determine arsenic, 1-L samples were collected in polyethylene bottles, previ- ously rinsed with 20% nitric acid and deionized water. To determine the physico- chemical parameters, 1-L samples were also collected in the same way, except that bottles were not rinsed with nitric acid. Samples were placed into an ice box but not frozen for transportation to the laboratory. 2.1.2. Forage Samples of alfalfa (Medicago sativa) crops (roots and leaves) and corn’s silage were put apart and placed into plastic bags. For the calculation of the As biotransfer factor to milk, 500 g (fresh weight) of the general dairy cow’s diet were collected from 5 food containers at each farm (alfalfa, corn’s silage, soybean meal, calcium carbonate, minerals and vitamins) and transported to the laboratory in plastic bags. 2.1.3. Soils Soils from alfalfa fields were sampled at 0–30 and 30–60 cm depth and 1 kg from each level was placed into plastic bags. 2.1.4. Cow’s Milk Cow’s milk was obtained during the cow’s milking and 1-L was placed into a polyethylene bottle previously rinsed with 20% nitric acid in deionized water. 2.2. A RSENIC ANALYSIS 2.2.1. Sample Preparation 2.2.1.1. Water. The arsenic (III) was determined by extraction with ammonium pyrrolidinedithiocarbamate (APDC) and methyl isobutyl ketone (MIBK) following the method described by Subramanian and Meranger (1981). The total arsenic was determined in an aliquot of 10 mL acidified with 3 mL of concentrated HCl (Perkin Elmer, 1979). 2.2.1.2. Forage. In the laboratory, roots were rinsed with tap water and scrubbed with a laboratory nylon brush until all soil was removed, after they were rinsed sev- eral times with distilled water and finally with deionized water. Leaves and corn’s silage were carefully washed with distilled and deionized water. The samples were dried at 60 ◦ C. Afterwards, were grounded in a blender and 1 g was digested with 5 mL of concentrated nitric and 2 mL of perchloric acids (Perkin-Elmer, 1982). After digestion, the samples were diluted to 50 mL with 1.5% hydrochloric acid. 2.2.1.3. Soil. Soil samples were dried at 60 ◦ C and grounded in an agate mortar and passed through a 0.177 mm sieve. To determine total arsenic, 0.1 g of grounded soil was digested with 20 mL of concentrated nitric acid and 10 mL of 15 N sulfuric acid, after the oxidation of organic matter was completed and fumes of
- 4. 136 I. ROSAS ET AL. sulfur trioxide were produced, the samples were cooled and diluted to 50 mL with deionized water (Thompson and Thoresby, 1977). For extractable arsenic, 5 g of soil were extracted by shaking with 20 ml of a mixture of 0.05N HCl + 0.025N H2 SO4 acids (Kahn et al., 1972; Perkin-Elmer, 1982). The solutions were filtered and made up to 50 ml with the extracting solution. 2.2.1.4. Milk. Samples of 10 g of raw milk were digested with concentrated nitric and sulfuric acids and 30% hydrogen peroxide, and diluted to 50 mL with 20 mL of concentrated hydrochloric acid and deionized water. 2.2.2. Analysis A Perkin-Elmer Model 460 atomic absorption spectrophotometer equipped with a MHS-10 Mercury/Hydride System and a HGA-2100 graphite furnace was used. A Perkin-Elmer arsenic electrodeless discharge lamp was used as a light source. Measurements were made with deuterium background correction. To determine total arsenic in water, forage, soil and milk, 1 mL of 10% potas- sium iodide solution was added to 10 mL of sample or an aliquot diluted to 10 mL, after 60 min, arsenic was determined by the hydride evolution method with sodium borohydride and the MHS-10 Mercury/Hydride System (Perkin-Elmer, 1979). Cal- ibration was performed by preparing series of standards adding specific chemicals from the various matrices. The As (III) was measured by Graphite Furnace Atomic Absorption Spectrometry (GFAAS) by injecting 20 µL of the MIBK phase into the graphite tube. The concentration of As (V) in water samples was obtained by subtracting the values of As (III) from the total arsenic concentrations. 2.2.3. Quality Control For quality control, the total inorganic arsenic was determined in a Water Pollu- tion Quality Control Sample supplied by US Environmental Protection Agency, Environmental Monitoring and Support Laboratory-Cincinnati (WP 476E). The mean value found was 22.4 ± 2.7 µg L−1 (average of 7 determinations), the value reported by USEPA was 24 µg L−1 . Forage, soils and milk samples were spiked with known amounts of arsenic, prepared and analyzed in the same way that the samples. Recovery in spiked samples ranged from 100–103% for forage, 96–100% for soils (total and extractable arsenic) and 95–106% for milk. For each group of processed samples, blanks (deionized water and reagents) were included throughout the entire sample preparation and analytical process. 2.3. P HYSICOCHEMICAL ANALYSIS 2.3.1. Water The samples were analyzed for pH, SO2− , Cl− , NO− , Ca2+ , and Mg2+ . pH was 4 3 measured using a Philips Model PW 9409 digital pH meter with a combination glass electrode. Sulfates, Cl− and NO− were determined by ion chromatography 3
- 5. ARSENIC CONCENTRATIONS IN WATER, SOIL, MILK AND FORAGE 137 with a Perkin-Elmer instrument equipped with a Model 250 Isocratic LC Pump, a Conducto Monitor III conductivity detector and a strong anion analytical col- umn Hamilton PRP-X100. Sodium, Ca2+ and Mg2+ were determined by atomic absorption spectrophotometry. 2.3.2. Soil Texture analysis was performed by the hydrometer method (Palmer and Troeh, 1980). pH was measured in a slurry (shaking 5 parts of distilled water and 1 part of soil during 15 min). The organic matter was determined by oxidation of 1 g of sample with 10 ml of 1 N K2 Cr2 O7 and 20 ml of concentrated H2 SO4 and titration with 0.5 N FeSO4 .7H2 O and o-phenanthroline as indicator (Palmer and Troeh, 1980). 2.4. S TATISTICAL ANALYSIS For the statistical analysis, whenever a value of an element was below detec- tion limit, the half of the detection limit was used for computation purposes. The one-way Kruskal Wallis test (one-tail test) was used to compare the arsenic con- centrations in groundwater, soil, forage, and cow’s milk samples measured at dif- ferent farms. The relationship between arsenic levels found in soil, forage, milk, and water were calculated by the Spearman coefficient correlation. The Mann- Whitney test (two-tail test) was applied to compare the probability of differences between means of total arsenic concentrations of two soils horizons and washed and unwashed plants. The As biotransfer factor (BTF) to milk was calculated using Steven’s equation (Stevens, 1991): Concentration of As in milk (mg L−1 ) BTF (day L−1 ) = Mean daily animal intake of As (mg day−1 ) · Holstein breed: body weight, 600–700 Kg Animal intake = 10 kg of food (dry matter), 65L water 3. Results The highest As concentrations were found in the following counties: Francisco I. Madero with 740 µg L−1 , Tlahualilo, 590 µg L−1 and San Pedro, 490 µ L−1 (Table I). Ninety percent of the total arsenic was detected as As (V). The Kruskal-Wallis test (H=23.6, p=0.05) indicated significant differences among the water As levels measured at the sampled counties. The results of the physicochemical analyses of the well water samples indicated that the pH ranged from 7.8 to 8.2, but much higher differences were found among the analyzed ions. Chloride ranged from 21.3 to 87.2 mg L−1 , SO2− from 182 to 428 mg L−1 , Na+ from 34 to 410 mg L−1 , Mg2+ 4 from 3.4 to 36.4 mg L−1 and Ca2+ from 29 to 120 mg L−1 (Table II).
- 6. 138 I. ROSAS ET AL. Figure 2. Concentrations of total arsenic in 0–30 cm and 30–60 cm soil horizons.
- 7. ARSENIC CONCENTRATIONS IN WATER, SOIL, MILK AND FORAGE 139 TABLE I Statistical summary of the total inorganic arsenic, As(III) and As(V) concentrations (µg L−1 ) determined in 73 wa- ter samples from deep artesian wells collected at the dairy farms located at the seven counties of Comarca Lagunera Countiesa N Arithmetic Standard Maximum mean deviation Arsenic (III) 1 12 0.67 0.25 1 2 15 8.33 5.12 19 3 6 5.83 5.04 12 4 26 1.08 1.18 5 5 3 6.67 – 9 6 3 0.50 – <1 7 8 0.68 1.13 2 Arsenic (V) 1 12 42.33 14.57 73 2 15 349 156 581 3 6 406 315 730 4 26 57.54 74.45 262 5 3 415 – 484 6 3 7.00 – 7 7 8 29.00 3.12 35 Inorganic total arsenic 1 12 42.67 52.19 74 2 15 357 160 590 3 6 411 319 740 4 26 58.23 75.58 265 5 3 422 – 490 6 3 7.00 – 7 7 8 29.65 3.10 35 a The county numbers are indicated in Figure 1. Total arsenic soil levels ranged from 11 to 30 µg g−1 (Figure 2). The main type of soil in the sampled farms was sandy clay loam (Table III). The extractable ar- senic was not higher than 15%, with the highest values found in farms at Tlahualilo and Francisco I. Madero counties (Figures 3 and 4). The Mann-Whitney test showed non-significant differences in total As between soils 0–30 and 30–60 cm depth horizons (Z=0.50, p=0.05).
- 8. 140 I. ROSAS ET AL. TABLE II Chemical parameters in groundwater samples from farms located in different counties at the Comarca Lagunera Countiesa SO2− 4 Cl− PO3− -P 4 Na+ K+ Ca2+ Mg2+ pH mg L−1 1 213 24.4 0.02 72.5 52.4 70.9 7.2 7.9 2 335 29.5 0.04 410 16.3 120 15.1 8.0 3 245 21.3 0.04 198 7.8 29.0 3.4 8.2 4 344 68.0 0.02 95.0 39.3 108 20.4 7.9 5 278 87.2 0.01 66.0 22.6 39.5 5.3 8.2 6 182 19.3 0.01 34.0 48.5 57.3 5.9 7.9 7 428 70.1 0.01 185 24.8 116 36.4 7.8 a The county numbers are indicated in Figure 1. Figure 3. Arsenic concentrations in washed alfalfa and extractable arsenic in soils from dairy farms located at different counties.
- 9. ARSENIC CONCENTRATIONS IN WATER, SOIL, MILK AND FORAGE 141 Figure 4. Proportion of extractable arsenic in soil from alfalfa fields in farms located at different counties. TABLE III Physical and chemical characteristics of soil samples from alfalfa fields at the Comarca Lagunera Countiesa Soil texture O.M. Sand Silt Clay pH % 1 Sandy clay loam 1.4 26 40 34 8.4 2 Sandy clay loam 0.6 33 40 27 8.3 3 Sandy clay loam 0.5 33 36 31 8.3 4 Sandy clay loam 0.7 35 36 29 8.5 5 Sandy clay loam 0.9 27 41 32 8.3 6 Clay loam 1.2 27 34 39 8.3 7 Sandy clay loam 1.05 36 36 28 8.6 a The county numbers are indicated in Figure 1.
- 10. 142 I. ROSAS ET AL. TABLE IV Values of total arsenic in milk (ng g−1 ) collected from farms located at different counties Countiesa N Arithmetic Standard Minimum Maximum mean deviation 1 6 1.63 1.64 <0.90 3.90 2 6 1.04 0.50 <0.90 1.50 3 6 8.59 11.75 <0.90 27.40 4 18 2.42 3.49 <0.90 14.80 5 3 5.18 – 2.50 6.70 6 3 2.60 – <0.90 5.05 7 8 1.37 1.24 0.90 3.87 a The county numbers are indicated in Figure 1. A higher percent of total arsenic was observed in alfalfa at root level than at the aerial structures (Figure 3), but a good correlation (r=0.70, p=0.01) exist be- tween the arsenic in roots and extractable arsenic in soil 0–30 and 30–60 cm depth horizons. The median of the washed and unwashed alfalfa corresponded to 0.9 and 1.6 µg g , respectively and those corresponding to corn’s silage were 0.5 and 1 µg g−1 , −1 respectively (Figure 5). About 50% of the arsenic was removed by washing. Sig- nificant differences (Z=3.3, p=0.05) were observed between washed and unwashed plants. Total arsenic concentrations from cow’s milk ranged from 0.9 to 27.4 ng g−1 with the highest values in farms at Francisco I. Madero and Matamoros counties (Table IV). Significant correlations (p=0.01) between arsenic (III), (V) and total inorganic concentrations in water with extractable As in soil (0–30 cm depth horizon), with As in alfalfa (leaves and roots) and with As in milk were observed (Table V). The biotransfer factor calculated for arsenic in milk was 10−4 , except for Tlahualilo county, with 10−5 . It was calculated based on the cow’s average daily intake of arsenic that ranged from 4 to 38.8 mg day−1 (Table VI). 4. Discussion High concentrations of arsenic in water, air and soil have been associated with industrial wastes or natural processes (Borgoño et al., 1977; Whanger et al., 1977; Sims and Kline, 1991; Retana et al., 1993; Santander et al., 1994; Nakadaira et al., 1995; Hwang et al., 1997). Due to the toxicity of As to plants, animals and human,
- 11. ARSENIC CONCENTRATIONS IN WATER, SOIL, MILK AND FORAGE 143 Figure 5. Box plot of arsenic concentrations in washed (1) and unwashed (2) of alfalfa and forage samples. The triangle symbol marks the minimum and maximum values. The symbols in bottom and top of the vertical line mark the 5th and 95th percentiles, respectively. The circle symbol, median line, the bottom and the top in the box mark: the arithmetic mean, 50th, 25th and 75th percentiles, respectively. it is desirable to understand its behavior in the environment (Vahter and Morin, 1980; Nissen and Benson 1982; USEPA, 1984; Wu et al., 1989; Sheppard, 1992). In the Comarca Lagunera, Mexico, high levels of arsenic have been detected in ground water, used not only as drinking water for humans and dairy cattle, but also for agricultural irrigation. Forty percent of the water samples from dairy farms had total arsenic contents above the USEPA (1980) and DOF (1996) National Drinking Water Standards (50 µg L−1 )], but only 5 samples were below the WHO (1993) standard of 10 µg L−1 . Arsenic contents below the drinking water standard were found only in one farm of Torreón. The arsenic concentrations measured in the studied area were lower than those reported at other zones of Mexico, like Zimapan, a Village in Hidalgo (up to 1.09 mg L−1 ) (Armienta et al., 1997a). On the other hand, As levels at Francisco I. Madero, Tlahualilo and San Pedro farms are within those values reported in Antofagasta, Chile, where skin cancers were described
- 12. 144 I. ROSAS ET AL. TABLE V Linear correlation coefficients between arsenic concentration in water and those from soil, alfalfa crops and milk Groundwater As (III) As (V) Inorganic total As Soil total As, 0–30 cm –0.289 –0.056 –0.046 total As, 30–60 cm –0.188 –0.145 –0.152 extractable As, 0–30 cm 0.494a –0.553a 0.539a extractable As, 30–60 cm 0.137 0.214 0.229 Alfalfa: stem 0.475a 0.509a 0.504a root 0.546a 0.559a 0.571a Milk 0.525a 0.510a 0.507a a Significant at the 1% level (N=43). TABLE VI Estimated biotransfer factor to milk collected from dairy farms at the Comarca Lagunera Countiesa Forage Water Intake Milk BTF mg kg−1 mg L−1 mg day−1 µg L−1 1 0.60 0.042 8.7 1.7 1.9* 10−4 2 1.34 0.36 36.6 1.2 3.2* 10−5 3 1.21 0.41 38.8 8.9 2.2* 10−4 4 1.20 0.06 15.6 2.6 1.6* 10−4 5 0.88 0.42 36.1 5.3 1.4* 10−4 6 0.40 0.007 4.0 2.7 6.7* 10−4 7 1.03 0.30 12.1 1.4 1.1* 10−4 a The county numbers are indicated in Figure 1. among the residents, who had been drinking water containing from 0.05 to 0.96 mg L−1 of As; and in southwestern Taiwan, where the As level ranged from 0.01 to 1.82 mg L−1 , in artesian water (Morton and Dunnette, 1994; Tseng, 1977). It has been established a consensus of a threshold value of 100 µg L−1 (tropical consumption) for arsenic disease (Stöhrer, 1991).
- 13. ARSENIC CONCENTRATIONS IN WATER, SOIL, MILK AND FORAGE 145 Arsenic-concentration in the studied area, showed an increase of the As to- wards the north of the Comarca Lagunera, with lower levels at its center. The observed variations may be due to differences in the geology, the hydrogeology and the abstraction regime of this area. The arsenic enrichment has been ascribed to magmatic processes giving rise to a hydrothermal system with high contents of lithium, boron, arsenic and fluoride (González-Hita et al., 1991). Differences in arsenic concentrations have been found also at Zimapán, related to the various arsenic sources (natural and anthropogenic) and to the hydrogeology of the valley (Armienta et al., 1997a). According to the results of pH and of major ions concentrations in the water samples, the Souliné classification was used (Custodio, 1983). Most of the water samples pertain to the sulfate-sodium type and some of them to the bicarbonate- sodium type. The pH results, of 7.5 to 8.4, also indicate that precipitation re- actions including As are not likely to occur. It seems that this element is not totally eliminated from water (Cherry et al., 1979). However, it is necessary to complete the data with more analyses of major and minor species to fully support this conclusion. None of the samples exceeded the allowable limit (1.0 mg L−1 ) of arsenic for water used in irrigation (USEPA, 1973). Ground water is also consumed by dairy cattle at the Comarca Lagunera, which is one of the most important dairy cows raising zone in Mexico. The arsenic con- centrations in the water could affect human health through milk intake, since the allowable limit for water used to feed cattle is 0.05 mg L−1 (USEPA, 1973). Total arsenic concentrations in soils from alfalfa fields at the dairy farms varied from 11 to 30 µg g−1 . These values are within the average normal concentrations for arsenic in agriculture soils in the USA (from 1 to 40 µg g−1 ) (Walsh et al., 1977), and lower than 50 µg g−1 , considered as guideline for soil pollution (Min- istry of Environment, 1990). Nevertheless, the As average concentrations are above 6 µg g−1 reported for non-polluted soils (USEPA, 1985), and exceeded the 10 µg g−1 suggested as background (O’Neil, 1995; Sheppard, 1992). Arsenic in soils is normally bounded to clay containing amorphous aluminum and iron oxihydroxides. The mobility of arsenic depends on the kind of soil, pH, and on the iron, aluminum and phosphate contents (Pierce and Moore, 1982; Mok and Wai, 1994). It has been observed that a drop in pH and an increase in fulvic acid increases arsenic leaching (Bowell, 1994). At the Comarca Lagunera the soil is mostly clay, with a low content of organic matter and a alkaline pH (> 8.0). These characteristics explain the low percentage of extractable arsenic with respect to total arsenic. It seems that arsenic is mostly retained on the silt and clay fractions of the soils which constitute more than 50% of their granulometry. Nevertheless, some differences were observed among the sampled farms, the highest proportions of extractable arsenic were found at Tlahualilo, F. I. Madero and San Pedro farms with soil samples containing more than 30% of sand.
- 14. 146 I. ROSAS ET AL. Arsenic pollution in soils may have effects on vegetation and easily affects the animals that graze on grass. The observed concentrations of total arsenic in soils, although above the EPA values, are within those reported for agricultural soils in the United States (Walsh and Keeney, 1975). The plant damage has been used as indicator to determine the critical concen- tration of soluble As in soils. Above 1 µg g−1 cause damage to crops (Huang, 1994). The extractable arsenic at La Comarca Lagunera does not seem to represent an important risk for the vegetation. However, some plants can tolerate higher concentrations of arsenic. For plants to reach levels of 1 mg kg−1 of As on fresh weight basis, soils levels must exceed 200 to 500 mg kg−1 (Aten et al., 1980). On the other hand, some crops can accumulate high levels of As even at much lower levels of arsenic in soil. For instance, alfalfa and grass accumulate up to 14 mg kg−1 of As when growing in soils containing 60 mg kg−1 of As (Bhumbla and Keefer, 1994). At the Comarca Lagunera, alfalfa and corn’s silage As concentrations were similar to the arsenic content in grass (as much as 3 mg kg−1 ) growing in soils containing up to 20 mg kg−1 of As (O’Neill, 1995). The As distribution in the plants was in general similar to that observed in other studies, with higher As levels in roots than in stem and leaves. Variations in arsenic concentrations in plants were also observed for the various farms, related to As contents in soils. Higher As values were measured in plants growing in soils with higher extractable arsenic. The samples from counties, 2, 3, 4 and 5, corresponding to soils with higher peoportion of sand, had the highest As levels. In general, lower levels have been found in plants growing on clays and silts, with higher clay, minerals and Fe/Al oxide content, than in plants growing in lighter soils, e.g. sands or sandy-loam soils (O’Neill, 1995). This behavior reflects the fact that the composition of vegetation depends on the availability of an element in the vicinity of the root system and the ability of the plant to absorb, transport, and accumulate the element (Lintern et al., 1997). The adsorption of metals from the liquid phase to the solid phase controls the concentrations of metal ions and complexes in the soil solution and thus exerts a major influence on their uptake by plant roots (Alloway, 1995). The high proportion of sand in counties 2, 3, 4 and 5, implies lower adsorption of arsenic and higher availability for the plants. A soil-plant transfer coefficient (metal concentration in the plant divided by the total metal content of the superficial soil) from 0.02 to 0.09 was calculated, this values agree with the reported coefficients at other places (Alloway et al., 1988; Alloway, 1995). Alfalfa and corn’s silage were analyzed because they are important components of the diet of dairy cattle. The arsenic present in soil was absorbed by alfalfa crop and 37% of the samples were higher than 2.6 µg g−1 , considered as permissible limit for edible crops by US Public Health Service (Jones and Hatch, 1945). It has been reported an important accumulation of arsenic at root level (Sheppard, et al., 1985; Sheppard, 1992; Retana et al., 1993). The average root/stem-leaves
- 15. ARSENIC CONCENTRATIONS IN WATER, SOIL, MILK AND FORAGE 147 ratio was of 1.7. However, almost the whole plant (with part of the roots) is used as forage for dairy cattle including the absorbed arsenic associated to soil particles, this represented about 30% of the total arsenic in plants. The fact that the heavy metals have been capable of translocating into bovine milk has been previously reported (Sharma et al., 1982; Stevens, 1991). The Co- marca Lagunera is one of the most important dairy producers in Mexico. Therefore, it is important to determine the contribution of arsenic from agricultural food chain to bovine milk. Ten percent of the milk samples had a concentration of As > 10 ng g−1 , suggested as permitted arsenic level (International Dairy Federation, 1986). The biotransfer factor has been calculated based in metal levels in food, but in this study the arsenic present in drinking water was included, and factors up to 6.7 × 10⁻⁴ , were higher than those reported in an experimental study (1.1 × 10⁻⁵ ) (Stevens, 1991). It is important to consider that more than 30% of the arsenic measured in plants was adsorbed by leaves and probably only a very low proportion of this is accessi- ble to cattle by ingestion (Hwang et al., 1997). Also, extractable data suggest that the inorganic arsenic absorbed by plants may be converted to organic arsenic com- pounds. Thus, methylation of arsenic in vegetables should substantially reduce the estimated risk associated with the food ingested dose (Nissen and Benson, 1982; Pyles and Woolson, 1982). In contrast, the solubility of arsenic in water, mainly as As (V), determine that this could be the most important source of arsenic exposure in the studied area. Acknowledgments We acknowledge to Hugo Padilla G. and Pilar Fernández for the review of the manuscript and his valuable comments. Also to CONACYT for the partial financial support. References Alloway, B. J., Thornton, I., Smart, G. A. Sherlock, J. C. and Quinn, M. J.: 1988, Sci. Tot. Environ, 91, 41. Alloway, B. J.: 1995, in Alloway, B. J. (ed.), Heavy Metals in Soils, Blackie Academic and Professional, London. Armienta, M. A., Rodríguez, R., Aguayo, A., Ceniceros, N., Villaseñor, G. and Cruz, O.: 1997a, Hydrogeology J. 5, 39. Armienta, M. A., Rodríguez, R. and Cruz, O.: 1997b, Environ. Cont. Toxicol. (in press). Aten, C. F., Boourte, J. B., Martini, J. H. and Walton, J. C.: 1980, Environ. Toxicol. 24, 108. Borgoño, J. M., Vincent, P., Venturino, H. and Infante, A.: 1977, Environ. Health Perspect. 19, 103. Bowell, R. J.: 1994, Applied Geochemistry 9, 279. Bhumbla, D. and Keefer, R.: 1994, in Nriogu, J. (ed.), Arsenic in the Environment. Part I, John Wiley and Sons, New York.
- 16. 148 I. ROSAS ET AL. Cebrian, M., Albores, A., Aguilar, M. and Blakely, E.: 1983, Human Toxicol. 2, 121. Cherry, J. A., Shaikh, A. U., Tallman, D. E. and Nicholson, R. V.: 1979, Journal of Hydrology, 43, 373. Custodio, E.: 1983, in: Custodio, E. and Llamas, M. R. (eds.), Hidrología Subterránea, Tomo I, Ediciones Omega S. A., Barcelona. DOF: 1996, Diario Oficial de la Federacíon, Norma Oficial Mexicana NON-1127-SSAI-1994. González, A.: 1972, Inv. Salud Pub. 32, 82. González-Hita, L., Sánchez, L. and Mata, I: 1991, Estudio hidrogeoquímico e isotópico del acuífero granular de la Comarca Lagunera, Instituto Mexicano de Tecnología del Agua Reporte, Morelos, México. Huang, Y. C.: 1994, in: Nriogu, J. (ed.), Arsenic in the Environment, Part I, John Wiley and Sons, New York. Hwang, Y. H., Bornschein, R., Grote, J., Menrath, W. and Roda, S.: 1997, Environ. Res. 72, 72. International Dairy Federation: 1986, Questinnaire 2386/E. Brussels IDF. Jones, J. S. and Hatch, M. B.: 1945, Soil Sci. 60, 277. Kahn, H. L., Fernandez, F. J. and Slavin, S.: 1972, Atomic Absorption Newslettter 11, 42. Lintern, M. J., Butt, C. R. M. and Scott, K. M.: 1997, Journal of Geochemical Exploration 58, 1. Ministry of Environment: 1990, A Report of Environmental Effects of Soil Pollution in Residential Areas, Ministry of Environment, Tokyo. Mok, W. M. and Wai, C. M.: 1994, in Nriagu, J. O. (ed.), Arsenic in the Environment, Part I, John Wiley and Sons, New York. Morton, W. E. and Dunnette, D. A.: 1994, in Nriogu, J. O. (ed.), Arsenic in the Environment, Part II, John Wiley and Sons, New York. Nakadaira, H., Yamamoto, M. and Katoh, K.: 1995, Bull. Environ. Contam. Toxicol. 55, 650. Nissen, P. and Benson, A.: 1982, Physio. Plant. 54, 446. O’Neill, P.: 1995, in Alloway, B. J. (ed.), Heavy Metals in Soils, Blackie Academic and Professional, London. Ortiz, M., Olivera, T. and Verduzco, E.: 1963, Bol. Epidemiológico 27, 220. Palmer, R. G. and Troeh, F. R.: 1980, Introductory Soil Science Laboratory Manual, Iowa State University Press, Ames, Iowa. Perkin-Elmer: 1979, Analytical Methods Using the MHS–10 Mercury/Hydride System, Perkin-Elmer Corp., Norwalk, CT. Perkin-Elmer: 1982, Analytical Methods for Atomic Absorption Spectrophotometry, Perkin-Elmer Corp., Norwalk, CT. Pierce, M. L. and Moore, C. B.: 1982, Water Res. 16, 1247. Pyles, R. and Woolson, E.: 1982, J. Agric. Food Chem. 30, 866. Retana, J., Parker, D., Amrhein, C. and Page, L.: 1993, J. Environ. Qual. 22, 805. Santander, M., Jamet, A., Pena, L., Munoz, L. and Gras, N.: 1994, Interciencia 19, 258. Sharma, R., Street, J., Shupe, J. and Bourcier, D.: 1982, J. Dairy Sci. 65, 972. Sheppard, M., Thibault, D. and Sheppard, S.: 1985, Water, Air, and Soil Pollut. 26, 85. Sheppard, S.: 1992, Water, Air and Soil Pollut. 64, 539. Sims, J. and Kline, J.: 1991, J. Environ. Qual. 20, 387. Stevens, J.: 1991, Environ. Sci. Technol. 25, 1289. Stöhrer, G.: 1991, Arch. Toxicol. 65, 525. Subramanian, K. S. and Meranger, J. C.: 1981, Anal. Chim. Acta 124, 131. Tseng, W. P.: 1977, Environ. Health Perspect. 19, 109. Torres de Navarro, E.: 1976, Salud Publ. Mex. 18, 1037. Thompson, A. J. and Thoresby, P. A.: 1977, Analyst 102, 9. USEPA: 1973, Water Quality Criteria, Ecological Research Series, Washington, D. C. USEPA: 1980, Ambient Water Quality Criteria for Arsenic, United States Environmental Protection Agency, EPA 440/5–80–021.
- 17. ARSENIC CONCENTRATIONS IN WATER, SOIL, MILK AND FORAGE 149 USEPA: 1984, Health Assesment Document for Inorganic Arsenic, Final report 600/8–83–021F. USEPA: 1985, Environmental Profiles and Hazards Indices for Constituents of Municipal Sludge, Arsenic Office of Water Regulations and Standards, Washington. Vahter, M. and Norin, H.: 1980, Environ. Res. 21, 446. Walsh, L. and Keeney, D.: 1975, in Woolson, E. A. (ed.), Arsenical Pesticides, Amer. Chem. Soc. Symp. Ser. 7, Chem. Soc., Washington. Walsh, L. Summer, M. and Keeney, D.: 1977, Environ. Health Perspect. 19, 67. WHO (World Health Organization): 1993, WHO Guidelines for Drinking Water Quality, Vol. 2. Health Criteria and Other Supporting Information. WHO, Geneva, Switzerland. Whanger, P., Weswig, P. and Stoner, J.: 1977, Environ. Health Perspect. 19, 139. Wu, M., Kuo, T., Hwang, Y. and Chen, C.: 1989, Am. J. Epidemiol. 130, 1123.