1. Profiling Cytokine Levels Using A Multiplex Human Cytokine ELISA Array
Min You, Jing-yi Lo, Yanqiu Wang, Qingzhu Zhai and Xiang Yu
SuperArray Bioscience Corporation, Frederick, MD 21704
Abstract
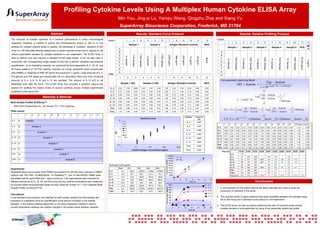
Results: Standard Curve Protocol
The induction of multiple cytokines is a common phenomenon in many immunological
Layout
1
2
responses; therefore, a method to quickly and simultaneously screen in vitro or in vivo
3
4
5
Sample 1
6
7
Sample 2
8
Results: Relative Profiling Protocol
9
10
11
Antigen Standard Controls
Layout
12
1
BKG
samples for multiple cytokine levels is needed. We developed a “multiplex” sandwich ELISA
Plate Layout:
1
12
A
2
3
4
5
6
7
8
9
10
11
0.29
0.080
3.42
1.55
0.28
1.03
0.43
0.16
0.08
0.06
0.06
0.10
0.04
0.04
0.24
0.04
0.04
2.05
1.11
0.44
0.19
0.09
0.04
0.04
0.19
0.05
0.05
1.62
0.73
0.29
0.14
0.08
0.05
0.09
0.04
0.04
0.50
0.06
0.04
1.89
0.87
0.35
0.16
0.08
0.05
0.06
0.06
0.06
0.06
0.05
0.04
1.31
0.56
0.22
0.12
0.08
0.05
0.20
0.04
0.04
0.46
0.06
0.04
1.32
0.78
0.35
0.17
0.08
0.05
3.95
0.86
0.13
3.94
3.22
0.61
1.69
0.73
0.25
0.12
0.07
0.05
1.10
0.09
0.05
2.37
0.14
0.05
1.08
0.48
0.17
0.10
0.07
0.06
B
10
Cytokine
IL-4
0.944
IL-5
0.986
OD
Analyte 3
1
IL13
IL-12
D
E
0.1
Analyte 4
F
IFNγ
G
TNFα
H
10
Analyte 6
100
1.92
2.00
0.11
0.73
0.08
0.35
0.08
0.14
0.07
3.39
0.07
1.14
2.95
3.46
3.36
3.38
0.45
3.09
0.13
2.43
0.07
1.06
0.03
3.42
0.02
1.32
1.94
IL-5
6
7
8
9
12
3.60
3.31
3.32
0.15
2.22
0.06
1.13
0.04
0.34
0.03
3.53
0.03
1.22
2.82
3.46
3.45
0.18
2.47
0.06
1.30
0.05
0.39
0.02
3.64
0.03
1.19
2.56
IL-12
3.85
2.91
2.94
0.09
1.30
0.04
0.59
0.03
0.18
0.03
3.72
0.03
1.22
2.76
0.906
IL-13
3.66
3.49
3.46
0.32
2.93
0.10
1.98
0.05
0.72
0.03
3.60
0.03
1.06
2.36
IFNγ
3.60
3.32
3.31
0.20
2.62
0.07
1.57
0.04
0.49
0.03
3.51
0.02
1.31
2.29
TNFα
3.85
3.16
3.21
0.17
1.95
0.10
0.99
0.09
0.31
0.08
3.66
0.07
1.23
2.76
S1/S3
S1/S4
S1/S5
S2/S3
S2/S4
527
1044
8.6
17.0
IFNg
0.992
0.992
10000
Results
S1/S2
IL-2
450000
6h
18 h
24 h
48 h
12917
126500
173900
373550
IL-4
19.4
50.7
182.1
214.3
170.1
IL-5
13.7
33.6
183.5
183.4
IL-10
10.4
44.9
506.1
533.2
IL-12
32.3
N/A
N/A
N/A
21.2
229.5
630.9
707.9
753.1
IFNγ
0.5
25300
173500
224912
404176
TNFα
38.3
1819
5521
8170
14475
S4/S5
117
IL-4
61
121
417
953
3073
3.4
7.9
25
2.3
7.4
IL-10
109
370
828
2927
3.4
7.6
27
2.2
7.9
IL-12
96
364
768
200000
IL-13
106
404
1077
150000
IFNγ
91
329
699
100000
TNFα
124
432
1009
Expected
100
400
1000
250000
N/A
IL-13
S3/S5
IL-5
300000
550.9
S3/S4
IFNg
350000
190.8
50000
3.8
8.0
3.8
10.2
3.6
3900
7.7
3.5
4000
2.0
10.0
2.7
9.7
2.1
8.1
4.0
2.1
37
2.3
40.0
2.5
10.0
4.0
0
0
10
20
30
40
50
60
Tim e (h)
800
concentration (pg/ml)
0.0
concentration (pg/ml)
Summary (unit pg/ml)
S2/S5
IL-2
400000
Analyte 8
IL-2
5
3.71
Analyte 7
Rest
4
0.994
TNFa
1000
Cytokine Anitgen Concentration (pg/ml)
Calculations:
In the standard curve protocol, the readings for each protein analyte from the samples are
compared to a standard curve for quantification of the amount of protein in the original
samples. In the relative profiling experiment, a non-linear regression method is used to
convert absorbance readings into relative changes in the protein levels between samples.
.
11
3.67
IL-4
IL-10
0.01
Experiments:
Peripheral blood mononuclear cells (PBMC) purchased from AllCells were cultured in DMEM
medium with 10% FBS, 1X MEM NEAA, 1X GlutaMaxTM-1, and 10 mM HEPES. PBMC were
stimulated with 50 ng/ml PMA and 1 µg/ml ionomycin. Cell supernatants were collected at
different time points (0, 6, 18, 24, and 48 hours) and the cytokine productions were measured
)
by enzyme-linked immunosorbent assay (ELISA) using the Human Th1 / Th2 Cytokines MultiAnalyte Profiler ELISArray™ Kit.
3
Hill Slope Log EC50
10
IL-2
IL-12
TNFa
1
IL-13
× (Dilution _ factor _ 2 ) ÷ (Dilution _ factior _ 1)
0.980
IL-13
Analyte 5
2
( X 2 − X 1)
IL-10
IFNg
IL-10
C 2 / C 1 = 10
IL10
IL12
C
Hillslope
0.997
IL5
Analyte 2
⎛ Top − bottom
⎞
Log ⎜
− 1⎟
⎝ OD − bottom
⎠
⎛
⎛ top − bottom
⎞
⎛ top − bottom
⎞⎞
X 2 − X 1 = ⎜ Log ⎜
⎜
− 1 ⎟ − Log ⎜
− 1 ⎟ ⎟ / Hillslope
⎟
⎝ OD 1 − bottom
⎠
⎝ OD 2 − bottom
⎠⎠
⎝
Linear Fit
(R2)
IL-2
IL2
1
IL-5
X = LogEC 50 −
12
Analyte1
Top − bottom
1 + 10 ( LogEC 50 − X )× Hillslope
0.04
0.08
IL4
IL-4
OD = bottom +
BKG
2.34
Standard Curves
IL-2
0 pg/ml
MEH-001A (SuperArray Inc. ) for Human Th1 / Th2 Cytokines
12
BK
G
20,000 pg/ml
Multi-Analyte Profiler ELISArray™:
11
POS
100X Sample
Materials & Methods
10
Sample 5
1X Sample
conditions at the same time.
IL-2
IL-4
IL-5
IL-10
IL-12
IL-13
IFNγ
TNFα
9
100X Sample
11
Antigen Standard Controls
8
Sample 4
1X Sample
detectable even after 48 hours. The ELISA Array thus provides a powerful, easy-to-use
Sample 2 (18h)
7
100X Sample
10
Four-parameter Logistic-log Model
Sample 1 (6h)
6
1X Sample
9
5
Sample 3
100X Sample
8
4
1X Sample
7
amounts of IL-4, IL-5, IL-10 and IL-13 are secreted. The amount of IL-12 p70 is not
solution for profiling the relative levels of several cytokines across multiple experimental
3
Sample 2
100X Sample
6
1X Sample
5
A
B
C
D
E
F
G
H
Blank
4
25 pg/ml
3
74 pg/ml
2
222 pg/ml
1
666 pg/ml
Data
IFN-gamma and TNF-alpha are induced after the 6-h stimulation when only more moderate
2000 pg/ml
cells (PBMC) in response to PMA (50 ng/ml) and ionomycin (1 µg/ml). Large amounts of IL-2,
1:250 sample
48 hours) patterns of Th1/Th2 cytokine induction by human peripheral blood mononuclear
1:25 sample
quantification. As an illustrative example, we monitored the time-dependent (0, 6, 18, 24, and
1x sample
conjunction with corresponding single analyte ELISA kits to perform validation and absolute
1:250 sample
easy to perform and only requires a standard ELISA plate reader. It can be also used in
1:25 sample
culture supernatant samples for multiple cytokines in one experiment. The ELISA Array is
1x sample
A
B
C
D
E
F
G
H
Array on a 96-well plate allowing researchers to screen several human serum, plasma or cell
2
Sample 1
700
IL-5
600
IL-10
Conclusions
IL-4
500
1. A new sandwich ELISA based method has been evaluated and used to study the
production of cytokines in this study.
IL-12
400
IL-13
300
200
2. The induction levels of eight cytokines have been quantified between two samples using
the ELISA Array and a standard curve protocol in one experiment.
100
0
0
10
20
30
Tim e (h)
40
50
60
3. The ELISA Array can also be used to determine the ratio of induction levels among
multiple samples in one experiment by using a four-parameter logistic-log model.