Download to read offline
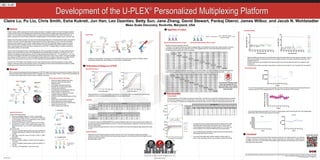

The document describes Meso Scale Discovery's U-PLEX multiplex assay platform. The platform uses 10 unique linkers that bind to specific spots on a plate, allowing users to create customized 10-plex assays. Assays performed on the platform show sensitivity comparable to MSD's standard multiplex kits, with a dynamic range of 3-4 logs. The linkers demonstrate high specificity for their spots and the assays show good reproducibility within and across plates. The platform enables flexible creation of multiplex assays using available biotinylated reagents.


