1. Bifm Economic Review 2nd Quarter 2007
Economic Review
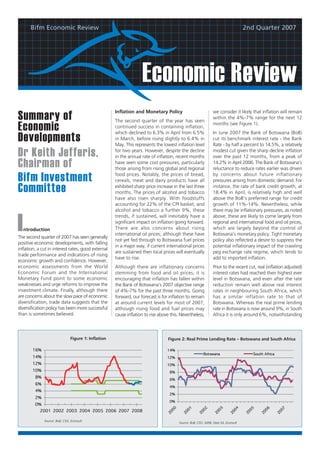
Inflation and Monetary Policy we consider it likely that inflation will remain
Summary of The second quarter of the year has seen
within the 4%-7% range for the next 12
Economic continued success in containing inflation,
which declined to 6.3% in April from 6.5%
months (see Figure 1).
In June 2007 the Bank of Botswana (BoB)
Developments in March, before rising slightly to 6.4% in
May. This represents the lowest inflation level
cut its benchmark interest rate - the Bank
Rate - by half a percent to 14.5%, a relatively
Dr Keith Jefferis, for two years. However, despite the decline
in the annual rate of inflation, recent months
modest cut given the sharp decline inflation
over the past 12 months, from a peak of
Chairman of have seen some cost pressures, particularly
those arising from rising global and regional
14.2% in April 2006. The Bank of Botswana’s
reluctance to reduce rates earlier was driven
Bifm Investment food prices. Notably, the prices of bread,
cereals, meat and dairy products have all
by concerns about future inflationary
pressures arising from domestic demand. For
Committee exhibited sharp price increase in the last three
months. The prices of alcohol and tobacco
instance, the rate of bank credit growth, at
18.4% in April, is relatively high and well
have also risen sharply. With foodstuffs above the BoB’s preferred range for credit
accounting for 22% of the CPI basket, and growth of 11%-14%. Nevertheless, while
alcohol and tobacco a further 9%, these there may be inflationary pressures, as noted
trends, if sustained, will inevitably have a above, these are likely to come largely from
significant impact on inflation going forward. regional and international food and oil prices,
There are also concerns about rising which are largely beyond the control of
international oil prices; although these have Botswana’s monetary policy. Tight monetary
The second quarter of 2007 has seen generally
not yet fed through to Botswana fuel prices policy also reflected a desire to suppress the
positive economic developments, with falling
in a major way, if current international prices potential inflationary impact of the crawling
inflation, a cut in interest rates, good external
are sustained then local prices will eventually peg exchange rate regime, which tends to
trade performance and indications of rising
have to rise. add to imported inflation.
economic growth and confidence. However,
economic assessments from the World Although there are inflationary concerns Prior to the recent cut, real (inflation adjusted)
Economic Forum and the International stemming from food and oil prices, it is interest rates had reached their highest ever
Monetary Fund point to some economic encouraging that inflation has fallen within level in Botswana, and even after the rate
weaknesses and urge reforms to improve the the Bank of Botswana’s 2007 objective range reduction remain well above real interest
investment climate. Finally, although there of 4%-7% for the past three months. Going rates in neighbouring South Africa, which
are concerns about the slow pace of economic forward, our forecast is for inflation to remain has a similar inflation rate to that of
diversification, trade data suggests that the at around current levels for most of 2007, Botswana. Whereas the real prime lending
diversification policy has been more successful although rising food and fuel prices may rate in Botswana is now around 9%, in South
than is sometimes believed. cause inflation to rise above this. Nevertheless, Africa it is only around 6%, notwithstanding
Figure 1: Inflation Figure 2: Real Prime Lending Rate – Botswana and South Africa
Source: BoB, CSO, Econsult
Source: BoB, CSO, SARB, Stats SA, Econsult
2. 2 Economic Review
Figure 3: Business growth indicators Figure 4: Business Confidence Index
(% of firms rating current business conditions satisfactory)
Source: BoB, BPC, Econsult Source: Bank of Botswana
the fact that South Africa probably has higher private business sector was only 2.2%, so of its bi-annual business confidence survey,
economic growth, and hence greater demand the increased growth rate is indicative of an carried out in March 2007 (see Figure 4).
pressures, than Botswana (see Figure 2). With improvement in business conditions. The results of this survey (available in more
such high real interest rates, there has been detail at www.bob.bw) show a marked
Data on electricity consumption also suggests
increasing concern in the private sector improvement in business confidence, with
that recovery is well under way (see Figure
Botswana’s growth is being unduly restricted the proportion of businesses rating current
3). Non-mining electricity consumption grew
as a result, and the rate reduction will come business conditions satisfactory rising from
by 10.6% in the year to April 2007, compared
as a welcome relief to firms and households. 52% in September 2006 to 66% in
only 1.8% a year earlier.
Economic Activity September 2007; even higher levels of
A further indicator of the strength of confidence are recorded for expected
The most recent GDP data, covering the economic conditions is the number of business conditions in the second half of
period to June 2006, indicated that growth applications for business licences under the 2007 and into 2008. It is also noticeable that
in the non-mining private sector was around Trade and Liquor Act. While this does not for the first time, confidence levels amongst
2.5% during 2005/06. However, there are include all new businesses, it does include a firms selling primarily into the domestic
no GDP data available covering the last twelve wide variety of trading businesses, and the market exceed confidence levels among
months, and so interpretations of recent number of applications provides an indication exporters.
economic growth have to rely on other data. of new business activity. In the first half of
2007, the number of new licence applications External Trade
Of this, data on bank lending to the private
was 2 094, compared to 1 979 in the first
sector suggest that growth is healthy, with Botswana continues to benefit from a positive
half of 2006, an increase of 5.8%. This is
credit up 10.6% in real terms over the twelve trade performance. Since 2003, exports have
consistent with a healthy growth rate for the
months to April 2007. Although this is slightly increased at an average annual rate of 27%,
non-mining private sector in the range of
lower than the 15% real growth recorded while imports have increased at only 13% a
4%-6%.
towards the end of 2006, 12 months ago year. Although much of this export growth
the real growth rate of bank credit to the The Bank of Botswana has released the results has been driven by higher diamond exports,
Figure 5: Export Growth, 2006 Q1 – 2007 Q1 Figure 6: The Most Problematic Factors
(US$) for Business in Botswana
As arts
ds
ds
c p uip
he cts
ds
les
i
t
lt
ld
Pla lec e l
-N
ea
& Tota
sa
pro
on
oo
Go
xti
u
q
Cu
M
p
rod
h&
Iro Diam
rg
Te
So es &
el
ste
e
Ot
l
sti
hic
da
n,
h.
Ve
ac
M
Source: CSO Source: WEF
3. 3 Economic Review
non-diamond exports have been growing at decline sharply thereafter (as production
a faster rate. The result has been rapidly moves underground). In view of the fiscal
increasing trade surpluses, which at P10 implications of declining diamond production,
billion for the 12 months to March 2007, the government is urged to cut spending (as
is equivalent to around 16% of GDP. a proportion of GDP) and broaden the tax
base, and not to rule out possible future
The commodities driving exports can be seen
from Figure 5, which shows the growth of increases in tax rates. Secondly, the IMF
exports by major commodity in the first quarter expressed concern regarding potential
of 2007 over the same period in 2006, conflicts between the objectives of monetary
measured in US dollar terms. While total policy (using interest rates to fight inflation)
exports increased by 22% over this period, and exchange rate policy (using the crawling
there was extremely rapid growth – of over peg regime target the real effective exchange
150% - for copper-nickel, meat, and textiles. rate), and urged that the first of these
Diamonds made a minimal contribution to objectives be given priority. The IMF also
export growth over this period. recommended that the exchange rate basket
weights and the rate of crawl should be
World Economic Forum Africa publicly disclosed. More generally, the IMF
Competitiveness Report said that consideration should be given to
The World Economic Forum has published tighter monetary policy to fight inflation. It
the 2007 Africa Competitiveness Report also urged continued efforts to undertake
(ACR), which amongst other things includes labour market reforms, implement
an updated Global Competitiveness Index privatisation and improve the investment
(GCI) and a Competitiveness Profile for each climate, in order to boost competitiveness
African country. and support economic diversification.
In comparison with other countries in sub- There are some oddities in the IMF note,
Saharan Africa, Botswana does well in the however, with sloppy or misleading use of
GCI rankings: as in the previous GCI (2005), economic data. For instance, it noted that
Botswana is rated third in sub-Saharan Africa the real effective exchange rate (REER) had
(after South Africa and Mauritius). However, appreciated during 2006 as a result of higher
performance on a global scale is less good, inflation, whereas its own data published in
with Botswana rated at no. 83 (out of 128 the note showed that the REER had
countries). Furthermore, relative global depreciated substantially – as intended,
performance has slipped, as in the 2005-06 meaning improved competitiveness - as a
GCI rankings, Botswana was rated at number result of the 2004 and 2005 devaluations.
72 (out of 117 economies). Also, it quotes a 35% adult HIV prevalence
The Competitiveness Profile also provides rate for Botswana from UNAIDS, whereas in
information on the most problematic factors fact the actual (and correct) prevalence rate
for doing business, which for Botswana are cited by UNAIDS is 24%.
shown in Figure 6. Interestingly, inefficient
government bureaucracy is rated the most
problematic, with factors related to the
workforce (education and skills, work ethic
and labour regulations) coming next. Along
with access to finance, these factors
accounted for nearly two-thirds of responses.
IMF Article IV Assessment
One June 28th the IMF released a Public
Information Notice relating to its Article IV
assessment of the Botswana economy. As
usual the IMF was generally positive in its Feature:
assessment of the economy. However, it did
raise some concerns and made suggestions
as to how economic management could be
improved. Amongst the key issues noted
Is Economic Diversification See next page
were that diamond production (and hence
export earnings and government revenues)
Taking Place?
would peak in around 15 years time and
4. 4 Economic Review
Feature:
Is Economic Diversification Taking Place?
There has been concern for a number of and of gross domestic expenditure. However, extent been achieved. In the early 1990s,
years that Botswana’s economic diversification this share has been steadily declining; until exports of goods and services other than
strategy has been unsuccessful, and that the the mid-1980s we imported around 60% of diamonds could only pay for around 30% of
economic structure remains overly dependent what we consumed and invested, whereas imports of goods and services, whereas by
upon minerals, and upon diamond mining it is now down to around 40%, indicating 2006 non-diamond exports covered the cost
in particular. This concern is supported by that domestic production now accounts for of 61% of imports. This is another sign that
reference to data on Gross Domestic Product a greater proportion of what we consume there has been some diversification.
(GDP), which points to three distinct periods (see Figure 9 overleaf). This is a sign of
of approximately ten years each over the past The contrasting stories told by GDP data and
success, given that reducing dependence trade data are shown clearly in Figure 10
30 years. Figure 7 shows trends in the non- upon imports has been one of the objectives
mining sector’s share of GDP and an “Index overleaf, which shows indices of
of economic diversification. diversification, one using GDP data and one
of Diversification”. From the mid-1970s until
the mid-1980s diversification declined, as the Further evidence of diversification success using export data (goods and services), over
mineral sector grew rapidly and its share in can be found in the trade data. Export data the period 1992-2006. Although they show
GDP expanded. From the mid-1980s until shows that the structure of exports is similar year-to year changes, the GDP series
the mid-1990s there was rising diversification, changing (and we know that because of the clearly shows a downward trend in
as non-mining sector growth took off. From small domestic economy, diversification has diversification, while the export series shows
the mid-1990s to the present, however, an upward trend.*
to be export-led). Firstly, goods exports have
diversification appears to have declined once become more diversified. After a long period Why there is such a difference? Although in
more. where the share of diamonds in total goods principle they measure similar things, the
Interestingly the period of increased exports rose, to over 80%, over the past few data sources for trade and GDP data are
diversification was driven not by an increased years non-diamond exports have been quite different. The national accounts data
share of manufacturing in GDP (or of growing faster than diamond exports, and (used for GDP calculations) are primarily
secondary industry more generally), but by the share of diamond exports fell to 72% in derived from surveys (such as the survey of
increased output of non-government services; 2006. A second trend has been the increasing firms). The quality of the resulting data
these grew from 12% of GDP in 1983/84 to importance of services exports; the share of depends upon both the quality of the sample
30% of GDP in 1994/95, much of which was services in total exports (of goods and services) frame from which survey respondents are
in turn due to the growth of banking, has been rising, with services exports growing selected, and the responsiveness of those
insurance and business services, as well as faster than both diamond and non-diamond surveyed. In recent years both have been
trade, hotels & restaurants (see Figure 8). goods exports, mostly reflecting the growth questionable, with an increasingly outdated
of the tourism sector. register of economic establishments upon
However, the picture may not be as gloomy
as the GDP data suggests, as other data show One of the objectives of economic diversification which firm surveys are based, and problems
a somewhat different story. Historically, has been to reduce Botswana’s dependence *Index of Diversification = 1 – HHI (Hirschman-
imports accounted for well over 50% of GDP upon diamond exports, and this has to a certain Herfindahl Index of Concentration).
Figure 7: Trends in the Diversification of Economic Activity Figure 8: GDP shares (constant prices)
Source:CSO Source: CSO
5. 5 Economic Review
Figure 9: Imports of Goods and Services Figure 10: Index of diversification, GDP and Export Measures
Exports Diversification Index
Diversification Index
GDP (Current prices)
GDP Exports Exports GDP
Source: CSO
Source: Econsult
with low response rates. the purposes of GDP calculations) should be import data shows no dramatic increase in
very similar to the value of its exports. imports during the period when textile
Trade data are different, however, as they
However, as Figure 11 shows, this is no exports have shot up, so this is unlikely. It is
are derived from customs records; in principle more likely that the GDP data are inaccurate
longer the case. Until 2001, exports and
every shipment of goods entering or leaving gross output were very similar, as would be and are under-recording textile production.
Botswana is recorded through customs expected. Since that time, however, textile If there is an “outdated sample bias” this
declarations, and at most border posts data exports have shown dramatic growth, as would lead to a systematic under-recording
collection is now automated. Trade data are new firms have set up in business, many of of diversification in the GDP data (as the new
not based on sample surveys, and are much them taking advantage of export firms that characterise a successfully
more comprehensive. And at least for exports opportunities to the USA under the Africa diversifying economy are more likely to be
there is no reason to believe that there is Growth and Opportunity Act (AGOA). GDP missed out of production surveys). It may
any systematic bias in the recorded values, data, however, show only a minimal also lead to an under-recording of associated
so the data should be accurate. increase. One possible explanation for this economic trends, such as overall GDP growth
is that these new firms are not being included and employment creation. Fortunately the
A clear example of the contrast between in production surveys for GDP purposes. Central Statistics Office is undertaking a
production (GDP) and export data can be Another possible explanation is that exports comprehensive updating of the Enterprises
seen in the textiles sector. Virtually all of comprise goods which are being imported and Establishments Register, which should
Botswana’s textile production is exported, and “transhipped” rather than being lead to a more accurate recording of GDP
so the sector’s gross output (recorded for produced in Botswana. However, textile and employment developments.
Figure 11: Textiles production and Exports
National accounts years *9 months
Source: CSO
Bifm Botswana Limited
Asset Management. Property Management. Private Equity. Corporate Advisory Services.
Private Bag BR 185, Broadhurst, Botswana Tel: +(267) 395 1564. Fax: +(267) 390 0358. Website: www.bifm.co.bw