Ports-to-Plains Alliance Northern Working Group Strategic Plan October 2012
Td report
1. Quarterly Economic Forecast TD Economics
www.td.com/economics
December 15, 2010
HIGHLIGHTS
CANADIAN ECONOMIC GROWTH PROSPECTS
• Real GDP growth should pick up
from the anemic Q3 pace of 1%
FOR 2011 RECEIVE A MODERATE BOOST
and average 2.6% in 2011 – more
than a half percentage point The Canadian economic growth profile has been unfolding largely as we
higher than the previous fore- had anticipated in our prior Quarterly Economic Forecast (QEF), released in
cast in September. For 2012, our mid-September. We had argued that the engines of growth would rev down as
projection has been dowgraded the recovery matured and as a number of headwinds – a waning in the impact
slightly to 2.5%, from 2.8%. from fiscal stimulus, a sluggish U.S. recovery, an elevated Canadian dollar, and
• The upward revision in 2011 re- a downswing in residential investment chief among them – would increasingly
flects an improved U.S. outlook. enter the picture. The release of the third quarter National Accounts data on
In addition, the policy interest November 30, which revealed a tepid 1% (Q/Q annualized) rate of growth for
rate in Canada is expected to stay real GDP, added credence to this view.
low for longer. This general story remains intact, but recent developments warrant some
• Despite these revisions, the tweaking to our forecast profile. The most significant developments since Sep-
general story remains the same. tember have been an announcement in October that the U.S. Federal Reserve will
After having rebounded strongly,
purchase an additional $600 billion in U.S. Treasuries – so called QE2, and more
the recovery in Canada has tran-
sitioned down to a more moder-
recently the strong
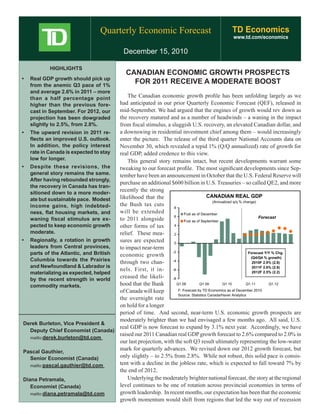
likelihood that the CANADIAN REAL GDP
ate but sustainable pace. Modest (Annualized q/q % change)
income gains, high indebted- the Bush tax cuts 8
ness, flat housing markets, and will be extended Fcst as of December
6 Forecast
waning fiscal stimulus are ex- to 2011 alongside Fcst as of September
pected to keep economic growth other forms of tax 4
moderate. relief. These mea- 2
• Regionally, a rotation in growth sures are expected 0
leaders from Central provinces, to impact near-term
parts of the Atlantic, and British economic growth
-2 Forecast Y/Y % Chg.
(Q4/Q4 % growth)
Columbia towards the Prairies through two chan- -4 2010F 2.9% (2.8)
and Newfoundland & Labrador is 2011F 2.6% (2.9)
nels. First, it in- -6
materializing as expected, helped 2012F 2.5% (2.2)
by the recent strength in world
creased the likeli- -8
commodity markets. hood that the Bank Q1.08 Q1.09 Q1.10 Q1.11 Q1.12
of Canada will keep F: Forecast by TD Economics as at December 2010
Source: Statistics Canada/Haver Analytics
the overnight rate
on hold for a longer
period of time. And second, near-term U.S. economic growth prospects are
moderately brighter than we had envisaged a few months ago. All said, U.S.
Derek Burleton, Vice President &
real GDP is now forecast to expand by 3.1% next year. Accordingly, we have
Deputy Chief Economist (Canada)
raised our 2011 Canadian real GDP growth forecast to 2.6% compared to 2.0% in
mailto:derek.burleton@td.com
our last projection, with the soft Q3 result ultimately representing the low-water
mark for quarterly advances. We revised down our 2012 growth forecast, but
Pascal Gauthier,
Senior Economist (Canada) only slightly – to 2.5% from 2.8%. While not robust, this solid pace is consis-
mailto:pascal.gauthier@td.com
tent with a decline in the jobless rate, which is expected to fall toward 7% by
the end of 2012.
Diana Petramala, Underlying the moderately brighter national forecast, the story at the regional
Economist (Canada) level continues to be one of rotation across provincial economies in terms of
mailto:diana.petramala@td.com growth leadership. In recent months, our expectation has been that the economic
growth momentum would shift from regions that led the way out of recession
2. Quarterly Economic Forecast TD Economics
www.td.com/economics
December 15, 2010 2
accelerate to 2.5-3.0% in the coming quarters.
CONTRIBUTION TO REAL GDP GROWTH
(% annualized)
8 Near-term consumer spending growth to be bolstered
6 by low interest rates
4
In the near-term, the largest boon to Canadian economic
2
growth from QE2 will be a more sustained low policy inter-
0
est rate environment. Canadian borrowing rates are expected
-2
-4
to remain lower for longer than had been anticipated a
-6
few months ago. Not only have some of the benefits from
-8
purchases of U.S. Treasuries by the Fed spilled across the
-10 Net trade Consumer Spending border, but expectations that the Bank of Canada (BOC) will
-12
Business Investment
Real GDP Growth
Government
leave its overnight rate at a stimulative 1.00% until midway
2006 2007 2008 2009 2010 through 2011 have mounted.
TD Economics has revised up its forecast for consumer
Source: Statistics Canada/Haver Analytics
spending growth by 0.5 percentage points in 2011 as inter-
– notably central Canada, British Columbia and parts of est rates are expected to remain stimulative through the
eastern Canada – toward the Prairies and N&L. Develop- first half of the year. Canadian households have responded
ments since mid-year have corroborated this change in tide, quite favourably to record low interest rates. In particular,
and especially a significant rise in the prices of crude oil, interest rate sensitive areas, such as consumer spending on
metals and a number of other commodities. Over the 2011- durables, and the resale housing market, have been sources
12 period, we expect N&L and Alberta to lead the way with of upside surprises for the Canadian economy. There are
average real GDP growth of 3.5% per year, followed by reasons to believe that consumers will continue to be enticed
Saskatchewan and Manitoba with 3.4% and 3.0% turnouts. by low interest rates, at least in the near-term. Still, the
By 2012 those regions are likely to experience declines in pace of consumer spending is expected to moderate from
their jobless rates of a percentage point or more from levels the lustrous pace of 3.5% over the past year of economic
prevailing in 2010. Elsewhere, average annual rates of recovery, to a more moderate sub-3% pace through the first
economic expansion are likely to run in the 2.0-2.5% range half of 2011.
in 2011-12, and recorded declines in jobless rates will likely
be more modest. Consumers can’t afford to go out on another binge
While we are a bit more upbeat about the ability of
Canada’s real GDP growth rate falls to a low in Q3
After the second quarter had marked a significant CONSUMER RESPONSE TO LOW INTEREST
downshift in real GDP growth from 5.6% to 2.3%, the third RATES
quarter recorded a further deceleration to 1.0% (annual- Consumer Spending (annualized % change)
ized). The weaker performance came mostly as a result of 6 3-mth T-bill Yield (%)
a substantial decline in exports and a solid gain in imports, forecast
which combined to subtract 3.5 percentage points off the 4
headline advance. The arithmetic of net trade on growth
2
overstated the weakness, however, as the import gain partly
came from a further rapid increase of close to 4% in real 0
domestic demand. Consumers ramped up their spending at
a healthy 3.5% clip, while business spending on machinery -2
and equipment – which is heavily import-intensive – ex-
ploded by around 30% (annualized) for the second straight -4
2008 2009 2010 2011 2012
quarter. With such a massive drag from net trade unlikely F: Forecast by TD Economics as at December 2010
to be repeated, Q3 is likely to mark the low point in the Source: Statistics Canada/Haver Analytics
economy’s recovery, with real economic growth poised to
3. Quarterly Economic Forecast TD Economics
www.td.com/economics
December 15, 2010 3
forever. And, as uncertainties over the global economic
PERSONAL SAVINGS RATE outlook abate, the Bank of Canada is expected to resume
(%)
with interest rate hikes. We believe the first rate hike will
12
come in July of 2011, after which we expect the Bank of
10 Canada to hike the overnight rate by 25 basis points at each
fcst
U.S. meeting through the second half of the year bringing the
8 Canada
overnight rate to 2.00% by year end. The overnight rate
6 is then expected to climb by another percentage point to
reach 3.00% by the end of 2012. As a consequence of high
4
indebtedness, households have become more sensitive to
2
rising interest rates. And, unless the pace of borrowing cools
significantly over the next few quarters – a scenario we deem
0 unlikely – the cost of servicing monthly debt payments will
1995 1997 1999 2001 2003 2005 2007 2009 2011
rise to levels not seen since the mid-1990’s when interest
F: Forecast by TD Economics as at December 2010 rates were at double digits. Beyond 2011, a more sustain-
Source: Statistics Canada, U.S. Federal Bureau of Statistics, Haver Analytics
able pace of household borrowing is consistent with real
household spending to remain firm in the near-term, our spending growth in a moderate range of 2.0-2.5%. And, as
story that an over-indebted household will be an impediment interest rates rise, the mix of spending will likely shift from
to economic growth has not changed. While debt-loads are interest-rate sensitive goods to non-durables and services.
still manageable for the majority of Canadian households The resale housing market has been one area of the
due to low interest rates, the degree of wiggle room has Canadian economy that has benefited from a sustained low
shrunk and an increasing share of households are facing interest rate environment. After slumping through the first
a position of financial stress. This means that for many six months of 2010, the resale housing market appears to
households, capacity to spend will be constrained by the rate have stabilized since July, with home sales proving to be
of increase in their personal disposable income (PDI). On more resilient than we originally anticipated – arguing for
that front, consumers will likely face an income constraint. a softer landing in the housing market than TD Economics
Unfortunately, PDI gains are expected to run at a lukewarm envisioned in September’s QEF. With the market likely to
annual rate below 4% over the next 3-4 quarters in view of remain relatively well-balanced, price changes are likely to
continued sluggish job gains of 5,000-15,000 per month and be modest over the next two years, posing less of a downside
muted wage increases of 2% or less across most sectors. risk to our Canadian economic outlook. Despite the upward
In view of our forecast for consumer spending and per- revision to existing home sales and home price growth, we
sonal disposable income growth, the personal savings rate are still of the view that residential construction will be a
is expected to edge down from an already ultra-low rate soft spot for the Canadian economy. The combination of
of 3.3% in Q3 to 2.9% by the first quarter of 2011. This
compares to a 6% personal savings rate in the U.S., and HOUSING ACTIVITY TO SOFTEN
is at the low end of the G-7 nations. It is our view that a y/y% change Contribution to real GDP growth (%)
more sustainable personal savings rate is something north 20 2.0
of 4%, but in the current low interest rate environment, the 15 forecast 1.5
savings rate is likely to experience little upward pressure 10 1.0
from its current level. There is a risk that households opt 5 0.5
to lift their pace of saving earlier, particularly in the wake 0 0.0
of high household indebtedness. Under this scenario, the -5 -0.5
rate of consumer spending in the 2011-12 period would be -10 -1.0
diminished vis-à-vis our base case forecast. -15 Durable Spending (rhs) -1.5
Beyond the first half of 2011, forecast PDI growth should -20 Residential Investment (rhs) -2.0
Existing Home Prices (lhs)
improve, but the corresponding benefit to household finances -25 -2.5
– and hence consumer spending – will be negated by the 2007 2009 2011 2013
hit to budgets from higher interest rates. As the Bank of F: Forecast by TD Economics as at December 2010
Canada has warned, interest rates cannot remain this low Source: Statistics Canada/ Haver Analytics
4. Quarterly Economic Forecast TD Economics
www.td.com/economics
December 15, 2010 4
to rapidly expanding developing markets and higher prices
HIGH LOONIE ERODES CANADA'S TRADE
COMPETITIVENESS
for their goods. As measured by the 18-item TD Commodity
Price Index (in Canadian-dollar terms), prices are projected
U.S. $/Cad $ Exchange Rate Canadian Share of U.S. Imports
to remain on an upward track in 2011-12, with healthy gains
1.8 22
of 9-12% per year. That being said, this upward path could
1.6 C$ appreciation 20 prove to be anything but smooth in light of ongoing finan-
cial worries in Europe that could persist and trigger bouts
1.4 18
of flight away from commodities and other perceived risky
1.2 16 assets in the coming months.
As an added plus to Canadian export growth in the first
1.0 14
half of 2011, the Canadian dollar is expected to trend down
0.8 12 to 92 U.S. cents by mid-2011 from its current 97-99 U.S.
trading range, as fears over European Sovereign debt lead
0.6 10
1995 1997 1999 2001 2003 2005 2007 2009
to a general rise in the U.S. trade weighted dollar. This
Source: Statistics Canada/Haver Analytics
should help Canadian exporters regain some lost ground
due to a loss in competitiveness experienced over the last
soft housing demand and an over-supply in the new hous- year as the loonie traded uncomfortably near parity. But, as
ing market is expected to dampen residential construction the Bank of Canada resumes along a hiking path at a time
over 2011, as the industry winds down from a period of when the U.S. is expected to maintain interest rates at their
very strong growth. exceptionally low levels, the loonie is expected to settle into
a higher range of 95-96 U.S. cents in late 2011 and 2012.
Benefits of stronger U.S. demand mitigated by high
loonie
Businesses to help fill the void of reduced govern-
Another factor that will lend greater support to real GDP ment stimulus
growth than we envisaged a few months ago is on the export Elsewhere, our expectations have remained virtually
front. More specifically, we have lifted our 2011 growth unaltered from the September QEF. We continue to build
target for the U.S. from 1.9% to 3.1% in 2011, while 2012 in a gradual shift by governments to fiscal restraint. At the
was left unaltered at 2.9%. The additional monetary stimu- margin, the recent announcement by the Government of
lus, the extension of the Bush tax cut and other tax relief Canada to extend stimulus funding for projects to the third
are expected to bolster growth in both business investment quarter of next year should smooth out an otherwise sharper
in machinery and equipment and consumer spending on drag that had been foreseen from the unwinding the fiscal
durables in the U.S. by eight and three percentage points, stimulus. In contrast to the government sector, business
respectively, in 2011. Since these items make up a sig- investment remains a bright spot in the Canadian outlook.
nificant share of Canadian exports to the U.S., the brighter
prospects south of the border certainly bode well for the CONTRIBUTION TO REAL GDP GROWTH
Canadian export sector. Exports are now anticipated to (% annualized)
grow at a clip twice the pace anticipated in September’s 5
forecast. Part of the increase in exports is expected to be 4 forecast
offset by higher imports, which reflects considerable two- 3
way trade between Canada and the United States, and the 2
fact that Canadian manufacturers import a significant share 1
of inputs to production. Nonetheless, net trade is expected 0
to positively contribute to economic growth for the first time -1
in over eight years. As a result, Canada’s international cur- -2 Business Investment in M&E
rent account deficit is projected to narrow to a manageable -3
Government Spending
1.4% of GDP by the end of the forecast period. -4
Within the export sector, prospects for resource indus- 2005 2006 2007 2008 2009 2010 2011 2012
tries are among the brightest, as producers enjoy the triple F: Forecast by TD Economics as at December 2010
benefit of a strengthening in U.S. demand, strong leverage Source: Statistics Canada/ Haver Analytics
5. Quarterly Economic Forecast TD Economics
www.td.com/economics
December 15, 2010 5
Respectable gains in corporate profits, the improvement
in the investment tax climate in Canada over the past few 2010-2011 ESTIMATE OF GOVERNMENT BUDGET
AS A % OF GDP
years and growing pressure on companies to increase labour
productivity are expected to drive continued double-digit 4
Governments in
Governments in
digit growth rate in machinery and equipment outlays in deficit position surplus/balanced
2011 and a high-single digit advance in 2012. 3
position
Prairies and N&L rise to the top
2
As is typically the case, the national showing is likely
to hide significant variations in performances from coast 1
to coast. Indeed, since mid-2010, the growth pendulum
has swung away from Central Canada, British Columbia
0
and parts of the Atlantic towards the Prairies and N&L. PEI NS NB QC ON MB BC Nfld SK AB
Looking ahead to the 2011-12 period, there appears to be
little stopping these growth leaders from maintaining an Source: Government's estimates and forecasts
above-average turnout of at least 3%, compared to 2.0-2.5%
elsewhere. at the top of the growth charts and unemployment rates on
a downward track.
In these resource-based economies, a good part of the
recent upswing reflects two major factors. First, these In other parts of the country, economies have been show-
economies were generally late to participate in the recovery, ing tell-tale signs of fatigue since the third quarter of 2010,
partly reflecting the relatively long time lag for improved as the “easy” returns to growth in areas hit hard during the
commodity price conditions to feed through to improved recession – such as manufacturing and housing – diminish,
resource investment and output. Add to this fact the signifi- while the economic impact of government stimulus pro-
cant rally in prices for crude oil, base and precious metals grams wanes. Case in point is Central Canada’s key factory
and agricultural products over the in the second half of 2010 sector. Although we expect output to ramp up by a healthy
and it is not surprising that momentum in these provinces 4% per year in 2011-12, this projected pace is still about half
has picked up smartly as the year draws to a close. Looking of the estimated advance of 7% in 2010. For automotive as-
ahead, further gains in commodity prices and the likelihood sembly and parts, the deceleration is more dramatic – at 29%
of a snap back in Prairie farm yields next year from this and 4%, respectively. In British Columbia, the economic
year’s flood-ravaged crop are likely to keep these economies hangover from the hosting of the 2010 Winter Olympics is
poised to weigh on its advance in 2011.
COMMODITY REGIONS TO BENEFIT FROM
The challenge for most of the provinces at the lower-end
STRONG COMMODITY PRICES of the growth totem pole is that there are other headwinds
Real GDP, (y/y% change) TDCI, (y/y% change) on the horizon. In particular, government deficits and debt
25 50
are poised to become an increasing impediment to expansion
fcst
20 40 over the medium term. Ontario, New Brunswick and Nova
15 30 Scotia are facing particularly difficult challenges reining
10 20 in their deficits. Some provinces have already announced
5 10 plans to address their shortfalls through tax increases (i.e.,
0 0 Québec and Nova Scotia), which will put a damper on
-5 -10 consumer spending growth in the near term.
-10 Praries and Newfoundland -20 Notwithstanding the divide between the regions, recov-
-15
Rest of Canada -30 eries across the country appear to be self-sustaining. As
TD Commodity Price Index
-20 -40 governments take their hands off the fiscal accelerator, the
1998 2000 2002 2004 2006 2008 2010 2012 private sector will continue to expand on the back of mod-
F: Forecast by TD Economics as at December 2010
Source: Statistics Canada/ Haver Analytics
erately growing demand for provincial manufacturing and
resource exports and the continued low interest rate environ-
6. Quarterly Economic Forecast TD Economics
www.td.com/economics
December 15, 2010 6
ment. Admittedly, the scope for declines in jobless rates
in more than half of Canada’s provinces appears limited in
2011-12, but nor are jobless rates likely to rise.
Bottom line
All told, the outlook for 2011 nationally has brightened,
with momentum in exports and investment expected to con-
tinue into 2012. Nonetheless, key longer-term challenges
such as a renormalization in the level of interest rates, high
consumer debt loads and weak overall productivity are likely
to exert an increasing drag on the rate of economic growth
in the latter part of the two-year forecast period.
10. Quarterly Economic Forecast TD Economics
www.td.com/economics
December 15, 2010 10
HOUSING STARTS HOUSING STARTS
Thousands of units Per cent change
2008 2009 2010F 2011F 2012F 2008 2009 2010F 2011F 2012F
CANADA 211.6 148.9 190.8 160.0 169.5 CANADA -7.5 -29.6 28.2 -16.1 5.9
N. & L. 3.2 3.2 4.5 3.8 3.5 N. & L. 20.2 0.8 40.6 -15.6 -7.9
P.E.I. 0.7 0.9 0.7 0.6 0.7 P.E.I. -5.7 24.1 -13.8 -13.5 6.3
N.S. 4.1 3.4 4.5 3.9 4.1 N.S. -13.6 -16.0 32.0 -13.5 5.1
N.B. 4.4 3.5 4.7 3.7 3.9 N.B. -0.4 -21.0 33.5 -20.4 5.4
Québec 48.0 44.0 51.0 42.0 39.0 Québec -2.0 -8.3 16.0 -17.6 -7.1
Ontario 75.5 50.1 59.4 47.0 54.5 Ontario 11.4 -33.6 18.6 -20.9 16.0
Manitoba 5.5 4.1 6.0 6.2 5.9 Manitoba -3.9 -26.3 48.1 3.3 -4.8
Sask. 6.9 3.8 5.5 5.1 4.9 Sask. 16.6 -44.9 45.7 -7.3 -3.9
Alberta 29.2 20.0 27.5 23.2 25.0 Alberta -39.6 -31.6 37.5 -15.6 7.8
B.C. 34.2 16.0 27.0 24.5 28.0 B.C. -13.4 -53.2 68.7 -9.3 14.3
F: Forecast by TD Economics as at December 2010 F: Forecast by TD Economics as at December 2010
Source: CMHC / Haver Analytics Source: CMHC / Haver Analytics
EXISTING HOME SALES EXISTING HOME SALES
Thousands of units Per cent change
2008 2009 2010F 2011F 2012F 2008 2009 2010F 2011F 2012F
CANADA 431.8 465.1 454.6 420.0 400.0 CANADA -17.1 7.7 -2.3 -7.6 -4.8
N. & L. 4.7 4.4 4.5 3.9 3.7 N. & L. 5.0 -5.9 0.8 -12.4 -5.1
P.E.I. 1.4 1.4 1.5 1.3 1.3 P.E.I. -20.1 -0.6 5.4 -14.2 2.4
N.S. 10.9 10.0 9.9 9.5 9.3 N.S. -8.3 -7.8 -1.0 -4.2 -2.1
N.B. 7.6 7.0 6.8 6.2 6.0 N.B. -7.4 -7.3 -3.6 -8.1 -3.2
Québec 76.8 79.1 81.0 72.4 66.6 Québec -4.8 3.1 2.4 -10.7 -8.0
Ontario 181.0 195.8 199.0 185.0 175.5 Ontario -15.2 8.2 1.6 -7.0 -5.1
Manitoba 13.5 13.1 13.2 12.5 12.1 Manitoba -2.9 -3.2 0.9 -5.3 -3.2
Sask. 10.5 11.1 10.8 10.3 10.0 Sask. -16.0 5.3 -2.7 -4.6 -2.9
Alberta 56.0 57.5 50.0 48.0 45.1 Alberta -21.0 2.7 -13.1 -4.0 -6.0
B.C. 68.9 85.0 78.0 71.0 70.0 B.C. -33.0 23.4 -8.3 -9.0 -1.4
F: Forecast by TD Economics as at December 2010 F: Forecast by TD Economics as at December 2010
Source: CREA Source: CREA
AVERAGE EXISTING HOME PRICE AVERAGE EXISTING HOME PRICE
Thousands of C$ Per cent change
2008 2009 2010F 2011F 2012F 2008 2009 2010F 2011F 2012F
CANADA 301.8 316.8 338.4 335.9 331.3 CANADA -1.6 5.0 6.8 -0.8 -1.4
N. & L. 176.1 204.6 234.0 230.0 229.0 N. & L. 19.4 16.2 14.3 -1.7 -0.4
P.E.I. 138.9 145.7 145.0 143.0 142.0 P.E.I. 5.1 4.9 -0.5 -1.4 -0.7
N.S. 188.3 195.1 205.0 202.0 200.0 N.S. 4.9 3.6 5.0 -1.5 -1.0
N.B. 144.8 153.4 157.0 155.0 153.0 N.B. 6.3 5.9 2.3 -1.3 -1.3
Québec 220.4 230.1 247.0 244.0 240.0 Québec 5.0 4.4 7.3 -1.2 -1.6
Ontario 299.6 314.8 342.0 337.0 333.0 Ontario -0.1 5.1 8.7 -1.5 -1.2
Manitoba 187.1 199.7 220.0 222.0 225.0 Manitoba 11.8 6.8 10.1 0.9 1.4
Sask. 222.7 232.4 243.0 245.0 247.0 Sask. 28.1 4.3 4.6 0.8 0.8
Alberta 351.4 340.5 355.0 357.0 360.0 Alberta -1.5 -3.1 4.3 0.6 0.8
B.C. 446.4 460.1 497.0 490.0 485.0 B.C. 1.9 3.1 8.0 -1.4 -1.0
F: Forecast by TD Economics as at December 2010 F: Forecast by TD Economics as at December 2010
Source: CREA Source: CREA
11. Quarterly Economic Forecast TD Economics
www.td.com/economics
December 15, 2010 11
Craig Alexander
Senior Vice President and
Chief Economist
mailto:craig.alexander@td.com
CANADIAN ECONOMIC ANALYSIS U.S. & INTERNATIONAL ECONOMIC ANALYSIS
Derek Burleton, Vice President and Beata Caranci, Associate Vice President and
Deputy Chief Economist Deputy Chief Economist
mailto:derek.burleton@td.com mailto:beata.caranci@td.com
Pascal Gauthier James Marple
Senior Economist Senior Economist
mailto:pascal.gauthier@td.com mailto:james.marple@td.com
Diana Petramala Martin Schwerdtfeger
Economist, Macro Economist, International
mailto:diana.petramala@td.com mailto: martin.schwerdtfeger@td.com
Francis Fong Christos Shiamptanis
Economist, Special Studies Economist
mailto:francis.fong@td.com mailto: christos.shiamptanis@td.com
Dina Cover Alistair Bentley
Economist, Industry Economist
mailto:dina.cover@td.com mailto: alistair.bentley@td.com
Shahrzad Mobasher Fard
Economist
mailto:shahrzad.fard@td.com TO REACH US
Sonya Gulati Mailing Address
Economist 55 King Street West
mailto:sonya.gulati@td.com 21st Floor, TD Tower
Toronto, Ontario
M5K 1A2
Fax: (416) 944-5536
mailto:td.economics@td.com
This report is provided by TD Economics for customers of TD Bank Group. It is for information purposes only and may not be appropriate
for other purposes. The report does not provide material information about the business and affairs of TD Bank Group and the members of
TD Economics are not spokespersons for TD Bank Group with respect to its business and affairs. The information contained in this report
has been drawn from sources believed to be reliable, but is not guaranteed to be accurate or complete. The report contains economic
analysis and views, including about future economic and financial markets performance. These are based on certain assumptions and other
factors, and are subject to inherent risks and uncertainties. The actual outcome may be materially different. The Toronto-Dominion Bank
and its affiliates and related entities that comprise TD Bank Group are not liable for any errors or omissions in the information, analysis or
views contained in this report, or for any loss or damage suffered.