
Recommended
Recommended
More Related Content
What's hot
What's hot (16)
Viewers also liked
Viewers also liked (18)
Similar to Indonesia Trade Outlook Weak Start to 2012
Similar to Indonesia Trade Outlook Weak Start to 2012 (20)
Recently uploaded
Recently uploaded (20)
Indonesia Trade Outlook Weak Start to 2012
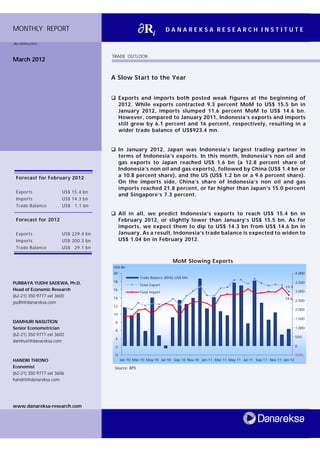
- 1. TRADE OUTLOOK MONTHLY REPORT ∂Ri/1059/to/2012 March 2012 ∂Ri D A N A R E K S A R E S E A R C H I N S T I T U T E q Exports and imports both posted weak figures at the beginning of 2012. While exports contracted 9.3 percent MoM to US$ 15.5 bn in January 2012, imports slumped 11.6 percent MoM to US$ 14.6 bn. However, compared to January 2011, Indonesia’s exports and imports still grew by 6.1 percent and 16 percent, respectively, resulting in a wider trade balance of US$923.4 mn. q In January 2012, Japan was Indonesia’s largest trading partner in terms of Indonesia’s exports. In this month, Indonesia’s non oil and gas exports to Japan reached US$ 1.6 bn (a 12.8 percent share of Indonesia’s non oil and gas exports), followed by China (US$ 1.4 bn or a 10.8 percent share), and the US (US$ 1.2 bn or a 9.6 percent share). On the imports side, China’s share of Indonesia’s non oil and gas imports reached 21.8 percent, or far higher than Japan’s 15.0 percent and Singapore’s 7.3 percent. q All in all, we predict Indonesia’s exports to reach US$ 15.4 bn in February 2012, or slightly lower than January’s US$ 15.5 bn. As for imports, we expect them to dip to US$ 14.3 bn from US$ 14.6 bn in January. As a result, Indonesia’s trade balance is expected to widen to US$ 1.04 bn in February 2012. A Slow Start to the Year MoM Slowing Exports Forecast for February 2012 Exports US$ 15.4 bn Imports US$ 14.3 bn Trade Balance US$ 1.1 bn Forecast for 2012 Exports US$ 229.4 bn Imports US$ 200.3 bn Trade Balance US$ 29.1 bn Source: BPS PURBAYA YUDHI SADEWA, Ph.D. Head of Economic Research (62-21) 350 9777 ext 3600 yudhi@danareksa.com DAMHURI NASUTION Senior Econometrician (62-21) 350 9777 ext 3602 damhuri@danareksa.com HANDRI THIONO Economist (62-21) 350 9777 ext 3606 handrit@danareksa.com www.danareksa-research.com 15.5 14.6 0 2 4 6 8 10 12 14 16 18 20 Jan-10 Mar-10 May-10 Jul-10 Sep-10 Nov-10 Jan-11 Mar-11 May-11 Jul-11 Sep-11 Nov-11 Jan-12 US$ Bn (500) 0 500 1,000 1,500 2,000 2,500 3,000 3,500 4,000 Trade Balance (RHS)-US$ Mn Total Export Total Import
- 2. TRADE OUTLOOK 2∂Ri DANAREKSA RESEARCH INSTITUTE January Exports: Down 9.3 percent MoM After slipping 0.9 percent in December 2011, Indonesia’s exports dropped 9.3 percent MoM in January 2012. Lower exports of oil and gas products (down by 14.7 percent) and lower exports of non oil and gas products (down by 7.9 percent) both contributed to the lower exports in January. Exports of mineral fuels (HS 27) and rubber products and articles thereof (HS 40) saw the biggest declines among the non oil and gas exports. On a YoY basis, however, exports were still up 6.1 percent. In January 2012, Japan was the main destination for Indonesia’s non oil and gas exports. Indonesia’s exports to Japan reached US$ 1.6 bn, or a 12.8 percent share of the total non oil and gas exports, followed by China and the US with 10.9 percent and 9.6 percent shares, respectively. 2011 Full-year Exports Source: BPS, Danareksa Research Institute January Imports: Down 11.6 Percent MoM Like exports, Indonesia’s imports also fell in January 2012. In this period, they dropped 11.6 percent MoM to US$ 14.6 bn. This decline owed to an 18 percent drop in oil and gas imports and a 9.7 percent fall in non oil and gas imports. Among the non oil and gas products, the imports of mechanical machinery and equipment (HS 84) and electrical machinery and equipment (HS 84) booked the largest declines in January 2012. Indonesia’s non oil and gas imports from China reached US$ 2.5 bn, or a 21.9 percent share, followed by Japan’s 15.1 percent share and Singapore’s 7.3 percent share. 4.9 4.1 5.0 5.0 6.1 7.6 8.3 11.2 7.3 11.6 14.6 15.5 229.4 0.0 50.0 100.0 150.0 200.0 250.0 Jan-01 Jan-02 Jan-03 Jan-04 Jan-05 Jan-06 Jan-07 Jan-08 Jan-09 Jan-10 Jan-11 Jan-12 US$ Bn Jan-Jan Jan-Dec
- 3. TRADE OUTLOOK 3∂Ri DANAREKSA RESEARCH INSTITUTE 2011 Full-year Imports Source: BPS, Danareksa Research Institute Imports of raw materials and capital goods contracted by 9.6 percent MoM and 21.3 percent MoM, respectively, in January 2012 although imports of consumer goods actually rose by 1.1 percent MoM. On a YoY basis, imports of raw materials and consumer goods still grew but at slower growth rates of 11.2 percent and 8.7 percent, respectively. Imports of capital goods still grew strongly by 41.3 percent YoY. Both exports and imports growth slowed in January 2012. Exports growth slowed from 26 percent YoY to 6.1 percent YoY, while imports growth slowed from 32.3 percent to 16 percent. Hence, compared to January 2011, Indonesia’s trade balance slumped 54.9 percent to US$ 923.4 mn. Slowing YoY Growth of Imports Source: BPS 2.9 2.1 2.7 3.3 4.1 4.4 5.3 9.6 6.6 9.5 12.6 14.6 200.3 0.0 50.0 100.0 150.0 200.0 250.0 Jan-01 Jan-02 Jan-03 Jan-04 Jan-05 Jan-06 Jan-07 Jan-08 Jan-09 Jan-10 Jan-11 Jan-12 US$ Bn Jan-Jan Jan-Dec (60) (40) (20) 0 20 40 60 80 100 Jan-09 Apr-09 Jul-09 Oct-09 Jan-10 Apr-10 Jul-10 Oct-10 Jan-11 Apr-11 Jul-11 Oct-11 Jan-12 (%YoY) Consumer Goods Raw Materials Capital Goods
- 4. TRADE OUTLOOK 4∂Ri DANAREKSA RESEARCH INSTITUTE Trade Outlook: Slowing Growth We project slowing exports growth in 2012 since the weaker global economy may mean softer demand for Indonesian goods. In particular, the outlook for China, one of Indonesia’s main trading partners, looks less bright given the downturn in the eurozone economy. In March, the Chinese government lowered its 2012 GDP growth forecast to 7.5 percent to take into account the impact of the eurozone recession. At the same time, China set an inflation target of around 4 percent. Yet despite the lower growth forecast, China still hopes to further expand its domestic demand as it continues to develop its real economy. It should be appreciated that the anticipated slowdown in the Chinese economy is also a consequence of China’s contractionary policy to curb its rising inflation. Hence, there exists the possibility that the PBOC reverses its monetary policy in the near term and injects liquidity into its banking system. China has, for example, reduced the amount of funds that major commercial banks must keep in the central bank reserves to 20.5 percent from 21 percent previously. Such a policy will give a boost to the economy. China’s manufacturing activity is weakening. This can be seen in the decline in the purchasing managers index to 48.1 in March 2012 from 49.6 the previous month. As such, Chinese demand for Indonesia’s raw materials could weaken - at least in the near term. All in all, China is likely to remain as Indonesia’s major trading partner even if demand for Indonesian goods slows in the coming months. Meanwhile, Japan’s CEI and LEI continue to signal improvements in the Japanese economy. In January 2012, the CEI declined by 0.3 percent MoM to 92.7 but the LEI, by contrast, rose 1.2 percent MoM to 94.4, its third straight monthly increase. As such, the Japanese economy appears stable with a brighter outlook. Against such a backdrop, we expect that Japanese demand for Indonesian products will remain relatively strong going forward. The US economy has encouragingly showed significant improvements lately. Besides better employment data, the CEI and LEI are both increasing. The CEI, which measures the current economic conditions, continues to improve, up 0.2 percent in February to 104, following a 0.2 percent increase in January and a 0.6 percent increase in December. Data on US manufacturing output is also positive. This index climbed 0.3 percent in February on the back of 78.7 percent capacity utilization. Looking ahead, the US LEI suggests a rosier economic outlook over the next 6-12 months. In February, the LEI strengthened 0.7 percent to 95.5, after climbing 0.2 percent in January and 0.5 percent in December. As such, we are confident that Indonesia’s exports to the US will remain firm in the near term. In Indonesia, the latest CEI and LEI readings suggest that the Indonesian economy is still growing briskly. The CEI edged up 0.05 percent to 119.54 and the LEI rose 0.62 percent to 126.67, suggesting the Indonesian economy will continue to expand. All in all, we expect Indonesian exports to grow by 6.6 percent YoY to US$ 15.4 bn in February 2012. Imports, meanwhile, are predicted to rise by 21.9 percent YoY to US$ 14.3 bn. Consequently, Indonesia’s trade balance is expected to widen to US$ 1.04 bn in February 2012 from US$ 0.92 bn in January 2011.
- 5. All rights reserved. No part of this publication may be reproduced, stored in retrieval systems, or transmitted, in any form or by any means, electronic, mechanical, photocopying, recording, or otherwise, without the prior written permission of Danareksa Research Institute. DISCLAIMER The information contained in this report has been taken from sources which we deem reliable. However, none of Danareksa Research Institute and/or its affiliated companies and/or their respective employees and/or agents makes any representation or warranty (express or implied) or accepts any responsibility or liability as to, or in relation to, the accuracy or completeness of the information and opinions contained in this report or as to any information contained in this report or any other such information or opinions remaining unchanged after the issue hereof. We have no responsibility to update this report in respect of events and circumstances occurring after the date of this report. We expressly disclaim any responsibility or liability (express or implied) of Danareksa Research Institute and/or its affiliated companies and/or their respective employees and/or agents whatsoever and howsoever arising (including, without limitation for any claims, proceedings, actions, suits, losses, expenses, damages or costs) which may be brought against or suffered by any person as a result of acting in reliance upon the whole or any part of the contents of this report and neither Danareksa Research Institute and/or its affiliated companies and/or their respective employees and/or agents accepts liability for any errors, omissions or mis-statements, negligent or otherwise, in this report and any liability in respect of this report or any inaccuracy herein or omission herefrom which might otherwise arise is hereby expressly disclaimed. Accordingly, none of Danareksa Research Institute and/or its affiliated companies and/or their respective employees and/or agents shall be liable for any direct, indirect or consequential loss or damage suffered by any person as a result of relying on any statement or omission in any information contained in this report. This report is prepared for general circulation. It does not have regard to the specific person who may receive this report. Danareksa Research Institute Danareksa Building Jl. Medan Merdeka Selatan 14 Jakarta, 10110 INDONESIA Tel : (62-21) 350 9777 / 888 (hunting) Fax : (62 21) 3501709 RESEARCH TEAM Purbaya Yudhi Sadewa, Ph.D. Damhuri Nasution Head of Economic Research Senior Econometrician yudhi@danareksa.com damhuri@danareksa.com Asti Suwarni Handri Thiono Analyst Junior Economist asti@danareksa.com handrit@danareksa.com Darwin Sitorus Yun Hariadi Economist / Database Officer Analyst darwin@danareksa.com yunh@danareksa.com Natalia Daisyana Martin Jenkins Research Assistant Editor natalia@danareksa.com martin@danareksa.com Rika P. Ismalestari Secretary rikap@danareksa.com