SlideShare a Scribd company logo
1 of 38
1
ECONOMIC ANALYSIS
GDP
According to the latest numbers made available by Central Statistical Organization (CSO) for
2010-11, India’s GDP at factor cost at constant prices registered an increase of 8.2 percent in the
year 2010-11. This revised estimate of 8.2 percent growth for GDP in 2010-11 is only a shade
below the advance estimates that had pegged GDP growth for 2010-11 at 8.6 percent.
This slight dip in overall GDP growth can be attributed to weaker performance in sectors such as
mining and quarrying, manufacturing, trade, hotels, transport and communication and financing,
insurance, real estate and business services than anticipated earlier.
Inflation
The inflation situation in the economy continues to be a cause for concern. Despite large scale
tightening of the monetary policy by the RBI and other steps taken by the government, inflation
continues to remain close to the double digit mark. Data shows that WPI based headline inflation
stood at 10 percent in the year 2010-11. This is not only much higher compared to the average
2
inflation rate of 3.6 percent seen in 2009-10 but also way above the 5 percent mark considered as
the ‘growth promoting inflation level’ or the ‘normal inflation level’ by the RBI.
Latest numbers on inflation available for the month of May 2011 shows that headline inflation
stood at 9.1 percent in May 2011. Although it is slightly lower than 10.5 percent inflation
registered in August 2010, it is still too high as per RBI’s standards. Data on the month on month
growth in WPI based inflation also shows that the underlying inflationary pressures in the
economy are maintained. The month on month growth in inflation in May 2011 stood at 0.7
percent. In the previous two months March and April, the corresponding figures stood at 0.9
percent and 0.7 percent respectively.
However inflation does not have a great impact on the share price of the FMCG companies
because of the necessary goods or goods used by consumer on daily basis even though inflation
increase their purchasing power of FMCG goods continue to be same . So inflation does not have
much impact on the goods. As India is a price sensitive country, FMCG companies cannot
increase the price of products even though cost of production increase, so inflation will not have
that impact on the price of stock of such companies. Due to inflation, the major companies’
operating expenses have increased as a result the profits of the current year have been decreased,
because they can’t increase the price of finished goods. That company which depends on the
agriculture for production will have certain impact when inflation goes up.
3
Foreign Trade
Financial year 2010-11 was exceptionally good for Indian exporters. With overall exports
amounting to US$ 245.5 billion, the sector registered a growth of 37.7 percent in 2010-11 over
the previous year. And this was a record growth witnessed in exports since independence.
Further, the monthly data for exports for the year 2010-11shows that growth in exports has been
particularly strong since November 2010. While during the Period of April to October 2010,
exports grew at an average rate of 26.8 %, overall growth was much higher in the remaining part
of the year. In fact, during November 2010 and March 2011, India’s exports grew at a whopping
44.3 percent on average.
The onset of recovery in the global economy, which was led by the emerging economies,
coupled with continuation of export sops announced by the government as part of the fiscal
packages offered during the crisis period gave the sector the much needed impetus. The support
provided by the government in the form of measures such as interest subvention of 2 percent on
pre and post shipment export credit was instrumental in reviving the badly hit labor intensive
export oriented industries.
The strong momentum in exports, seen particularly during the second half of 2010-11, has
continued in the year 2011-12 as well.
4
Coming to imports, it seems that in the year 2010-11 the imports totaled US$ 350.4 billion. This
represents an increase of about 21.8 percent over the previous year’s imports of about US$ 287.6
billion. During the year 2010-11, imports of both petroleum crude and products (POL) and non-
petroleum crude and products (Non POL) went up. While POL imports amounted to US$ 101.7
billion in 2010-11 and posted a growth of 16.7 percent over the previous year, non-POL imports
amounted to US$ 248.7 billion and registered a growth of 24.0 percent over the previous year.
With exports likely to come under pressure and imports showing little signs of easing in the
coming months, the trade balance in 2011-12 could widen.
Foreign Investments
Data on total foreign investment flows into the country shows that in 2010-11, foreign
investment flows into India saw a dip of about 17% over the previous year. Further, when we
look at the two main components of foreign investment, namely foreign direct investment and
portfolio investment, we see that the dip is largely on account of a slowdown seen in case of FDI.
As the table below shows, FDI flows into India in 2009-10 were to the tune of US$ 37.7 billion
and in 2010-11 this figure came down to US$ 27 billion. Portfolio flows, which were to the tune
of US$ 32.4 billion in 2009-10, saw a marginal dip to about US$ 31.5 billion in 2010-11.
The figures for FDI over the last few years show that the quantum received in 2010-11 was the
lowest in the last four years. This clear slowing down in the flow of FDI funds towards India
5
should be a matter of concern for the authorities. Further, data on sector wise FDI flows into
India for the period April to February 2010-11 shows that out of a total of top 25 sectors, 15
sectors saw a dip in FDI flows in 2010-11 compared to flows in the previous year. And out of
these 15 sectors, it is sectors like services, construction activities, housing and real estate,
telecommunication and agricultural services that have taken the biggest hit in terms of inflows
compared to corresponding period of the previous year i.e. 2009-10.
As this slowdown in FDI is happening at a time when the country is preparing plans to achieve a
target growth of 9 to 9.5 percent over the 12th Plan Period, it becomes important to get to the
core of this issue and take corrective action. In this context, it may be reiterated that completion
6
of the much awaited FDI policy reforms in sectors such as insurance, defense and multi-brand
retail would also give a boost to overall FDI flows into the country.
Forex Reserves
India’s foreign exchange reserves increased as it moved ahead in fiscal 2010-11. As data given in
the table below shows, while in April 2010, India’s foreign exchange reserves totaled US$ 279.6
billion, in September 2010 this figure had increased to US$ 292.9 billion. Most recent numbers
show that the country’s foreign exchange reserves have shot up further crossing the US$ 300
billion mark. With this level of reserves, India is amongst the ten largest holders of foreign
exchange reserves in the world.
Regarding the outlook for the Indian Rupee against the US$ in the months ahead, the majority
view amongst analysts and currency strategists is one of depreciation. This bearish view with
regard to the Indian Rupee is based on two factors. First is the likely deterioration in the current
account due to moderation in exports, continuous rise in imports and a possible slowdown in
invisible receipts. Second is the expected slowdown in funds flows into India. While FDI flows
into the Indian market are already on a slowdown mode, FII flows too are showing signs of
anxiety over the evolving macro-economic situation with inflation remaining high and growth
slowing down.
7
Performance of the Corporate Sector
The data above on corporate sector performance shows that in the fourth quarter of fiscal 2010-
11, corporate India turned out a good performance both in terms of sales and profits. Such a
performance is particularly noteworthy as it came at a time when overall expenses are going up
at a fast clip. Further the net sales of ‘All Industries’ in the fourth quarter of 2010-11 registered a
growth of 23.5 percent. This is the highest growth in net sales that we have seen in the last eight
quarters. Further, while firms from the manufacturing sector saw an increase of 22.26 percent in
8
net sales in the last quarter of 2010-11, companies from the services (other than financial) sector
saw sales going up by 27.46 percent.
Further, within the manufacturing sector, growth in sales has been particularly strong in sectors
such as textiles, cement, steel and transport equipment. Performance of the food and beverages
sector and the chemicals sector lagged the average for the manufacturing sector as a whole with
food and beverages sector seeing net sales going up by about 8.5 percent in Q4, 2010-11.
9
INDUSTRY ANALYSIS
Introduction to FMCG Sector
Products which have a quick turnover, and relatively low cost are known as Fast Moving
Consumer Goods (FMCG). FMCG products are those that get replaced within a year. Examples
of FMCG generally include a wide range of frequently purchased consumer products such as
toiletries, soap, cosmetics, tooth cleaning products, shaving products and detergents, as well as
other non-durables such as glassware, bulbs, batteries, paper products, and plastic goods. FMCG
may also include pharmaceuticals, consumer electronics, packaged food products, soft drinks,
tissue paper, and chocolate bars.
India’s FMCG sector is the fourth largest sector in the economy and creates employment for
more than three million people in downstream activities. Its principal constituents are Household
Care, Personal Care and Food & Beverages. The total FMCG market is in excess of Rs. 90,000
crores. It is currently growing at double digit growth rate and is expected to maintain a high
growth rate. FMCG Industry is characterized by a well established distribution network, low
penetration levels, low operating cost, lower per capita consumption and intense competition
between the organized and unorganized segments.
Industry Category and Products
1) Household Care
a) Personal Wash:-
The market size of personal wash is estimated to be around Rs. 8,300 Cr. The personal wash can
be segregated into three segments: Premium, Economy and Popular. The penetration level of
soaps is 92 per cent. It is available in 5 million retail stores, out of which, 75 per cent are in the
rural areas. HUL is the leader with market share of 53 per cent; Godrej occupies second position
with market share of 10 per cent. With increase in disposable incomes, growth in rural demand is
expected to increase because consumers are moving up towards premium products. However, in
the recent past there has not been much change in the volume of premium soaps in proportion to
economy soaps, because increase in prices has led some consumers to look for cheaper
10
substitutes. Hindustan Unilever Limited is the biggest producer of Personal wash and detergents.
The segment is expected to grow by double digit.
b) Detergents:-
The size of the detergent market is estimated to be Rs. 12,000 Cr. Household care segment is
characterized by high degree of competition and high level of penetration. With rapid
urbanization, emergence of small pack size and sachets, the demand for the household care
products is flourishing. The demand for detergents has been growing but the regional and small
unorganized players account for a major share of the total volume of the detergent market. In
washing powder HUL is the leader with 38 per cent of market share. Other major players are
Nirma, Henkel and Proctor & Gamble.
2) Personal Care
a) Skin Care:-
The total skin care market is estimated to be around Rs. 4,000 Cr. The skin care market is at a
primary stage in India. The penetration level of this segment in India is around 20 per cent. With
changing life styles, increase in disposable incomes, greater product choice and availability,
people are becoming aware about personal grooming. The major players in this segment are
Hindustan Unilever with a market share of 54 per cent, followed by CavinKare with a market
share of 12 per cent and Godrej with a market share of 3 per cent.
b) Hair Care:-
The hair care market in India is estimated at around Rs. 3,800 Cr. The hair care market can be
segmented into hair oils, shampoos, hair colorants and conditioners, and hair gels. Marico is the
leader in Hair Oil segment with market share of 33 per cent; Dabur occupies second position
with 17 per cent. The Indian shampoo market is estimated to be around Rs. 2,700 Cr. It has the
penetration level of only 13 per cent in India. Sachet makes up to 40 per cent of the total
shampoo sale. It has low penetration level even in metros. Again the market is dominated by
HUL with around 47 per cent market share; P&G occupies second position with market share of
around 23 per cent. Anti-dandruff segment constitutes around 15 per cent of the total shampoo
11
market. The market is further expected to increase due to increased marketing by players and
availability of shampoos in affordable sachets.
c) Oral Care:-
The oral care market can be segmented into toothpaste of 60 per cent; toothpowder with 23%;
toothbrushes with 17 per cent. The total toothpaste market is estimated to be around Rs. 3,500
Cr. The penetration level of toothpowder/toothpaste in urban areas is three times that of rural
areas. This segment is dominated by Colgate-Palmolive with market share of 49 per cent, while
HUL occupies second position with market share of 30 per cent. In toothpowders market,
Colgate and Dabur are the major players. The oral care market, especially toothpastes, remains
under penetrated in India with penetration level 50 percent
3) Food & Beverages
a) Food Segment :-
The foods category in FMCG is gaining popularity with a swing of launches by HUL, ITC,
Godrej, Tata Global Beverages and others. This category has 18 major brands aggregating Rs.
4,600 Cr. Nestle and Amul slug it out in the powders segment. The food category has also seen
innovations like softies in ice creams, ready to eat rice by HUL and pizzas by both GCMMF and
Godrej Pillsbury.
b) Beverages
Tea :-
According to Tea Board of India, the export of tea is expected to be more than 240 million kg for
the year 2011 against about 225 million kg last year. The major share of tea market is dominated
by unorganized players. More than 50 per cent of the market share is capture by unorganized
players. Leading branded tea players are HUL and Tata Global Beverages.
Coffee:-
The Indian beverage industry faces over supply in segments like coffee and tea. However, more
than 50 per cent of the market share is in unpacked or loose form. The major players in this
segment are Nestlé, HUL and Tata Global Beverages.
12
SECTORAL CONTRIBUTION TO GDP OF INDIA
The 90,000 Crores Indian FMCG market is one of the important sectors of Indian economy, has
registered a robust growth rate. Indian FMCG industry is expected to register a healthy growth in
the year of 2011-12 despite the economic downturn in 2008 and subsequent years. The industry
is expected to register a 14% growth in the 2011-12 financial Year as compared to the last year.
Unlike other sectors, the FMCG industry did not slow down, since 2009 the industry is doing
pretty well, bucking the trend. As it is meeting the every-day demands of consumers, it will
continue to grow. In the last two years, input costs have come down and this will reflect in the
results of coming years.
Particulars 2008-2009 2009-2010
Agriculture and allied activities 650461 651901
Agriculture 547980 767119
Industry 830246 916356
Mining and Quarrying 98745 109182
Manufacturing 649635 719975
Electricity, Water and Gas Supply 81866 87199
Services 2674266 2895824
Construction 332782 354541
Trades, hotels, Transport and
communication 1084764 1185190
Financing, Insurance, Real Estate &
Business Services 701338 769390
Community, Social & Personal Services
555382 586703
13
Market share movements indicate that companies such as HUL, Marico Ltd and Nestle India Ltd,
with domination in their key categories, have improved their market shares and outperformed
peers in the FMCG sector. This has been also aided by the lack of competition in the respective
categories. Single product leaders such as Colgate Palmolive India Ltd and Britannia Industries
Ltd have also witnessed strength in their respective categories, aided by innovations and strong
distribution. Strong players in the economy segment like Godrej Consumer Products Ltd in soaps
and Dabur in toothpastes have also posted market share improvement, with revived growth in
semi-urban and rural markets.
Porter’s five forces model for FMCG sector
Threat of new entrants
Economies of scale
difficult, product
differentiation, capital
requirements, cost
disadvantage.
Bargaining power of
Suppliers
Large number of suppliers,
fragmented environment,
switching cost, threat of
forward integration
Bargainingpowerof Buyers
Large number of buyers ,
switching cost, no
individual buyer can
impact, less threat of
backward integration
Rivalry among
existing firms
Threat of Substitutes
Increasing health
concerns, changing
consumption patterns,
customer expectations
External forces:
political &legal,
technological,
demographical
14
1) Rivalry among existing Firms
In the FMCG sector, the rivalry among competitors is very fierce. There is large number of
geographically separated customers because the industry is highly saturated and the competitors
try to snatch their share in the market. Market Players use all sorts of tactics and activities from
intensive advertisement campaigns to promotional stuff and price wars etc. Hence the intensity
of rivalry is very high in FMCG sector.
2) Threat of new entrants
FMCG Industry does not have any measures which can control the entry of new firms. The
resistance is very low and the structure of the industry is so complex that new firms can easily
enter and also offer tough competition due to cost effectiveness. Hence potential entry of new
firms is high.
3) Threat of Substitutes
There are complex and never ending consumer needs and no firm can satisfy all sorts of needs
alone. There are plenty of substitute goods available in the market that can be re-placed if
consumers are not satisfied with one. The wide range of choices and needs give a sufficient room
for new product development that can replace existing goods. This leads to higher consumer’s
expectation. However the changing consumption pattern is a major concern in the sector.
4) Bargaining power of Suppliers
The bargaining power of suppliers of raw materials and intermediate goods is not very high.
There is ample number of substitute suppliers available and the raw materials are also readily
available and most of the raw materials are homogeneous. There is no monopoly situation in the
supplier side because the suppliers are also competing among themselves but there are chances
of forward integration.
15
5) Bargaining power of Buyers
Bargaining power of consumers is also very high. This is because in FMCG industry, the
switching cost of most of the goods is very low and there is no threat of buying one
product over other. Customers are never reluctant to buy or try new things off the shelf.
SWOT Analysis of FMCG sector
Strengths:
• Low operational costs.
• Presence of established distribution networks in both urban and rural areas.
• Presence of well-known brands.
Weaknesses:
• Lower scope of investing in technology and achieving economies of scale.
• Low exports levels
• "Me-tooʺ products, which illegally mimic the labels of the established brands narrow the scope
of FMCG products in rural and semi-urban market.
Opportunities:
• Untapped rural market
• Rising income levels, i.e. increase in purchasing power of consumers
• Large domestic market- a population of over one billion.
• Export potential
• High consumer goods spending
Threats:
• Removal of import restrictions resulting in replacing of domestic brands
• Slowdown in rural demand
• Tax and regulatory structure
16
Business life cycle of FMCG sector
Growing
FMCG Sector
The FMCG sector of India expected to grow at 15% of compounded annual growth rate
(CAGR). In the year 2015 it is expected to grow at 23%. FMCG depends on the population of
India and many people (rural and urban) of India are aware of the FMCG goods due to the
advertisements and campaigns done by the companies to increase the market share.
In 2015, Indians under age 30 are expected to be around 55% of the total population, which will
proportionately impact by higher purchasing power. Well established distribution network, high
penetration levels, low operating cost, lower per capita consumption and intense competition
between the organized and unorganized segments will provide FMCG sector over the other
sectors. Being fourth largest sector in India, FMCG sector is in the growth stage with a growth
rate of 15%.
17
SWOT Analysis Matrix
Threat
External environment
Opportunity
Strength
Weakness
Internal environment
Considering all the factors, FMCG is considered as a less risky sector to invest. FMCG
sector stocks are best for those investors who are less risk averse. The betas for major stocks are
less than one, which is considered to be less volatile and less return. Being the fourth largest
sector in India, FMCG it is expected to grow in the future. In future there will be more
penetration in rural and urban areas. Population of India is growing at a fast rate and touched
1.17 billion. This will impact on the demand for FMCG. This sector may be appropriate for those
investors who are less risk averse. FMCG sector is in a growth stage so it better to buy the
stocks for longer duration. It does not give much return in case of intraday trading.
Confront Avoid
Exploit Search
18
PEST Analysis
Political Factors:
1. GST Regime
2. Transportation and infrastructure development in rural areas helps in distribution
network.
3. Restrictions in import policies.
4. Help and assistance for agricultural sector in the form subsidies and tax relaxation.
Economic Factors:
1. GDP rate increase along with the population.
2. Increase in disposable income at 10 % annually for next 8 yrs.
3. Indian FMCG sector recorded 16% Sales Growth in Last Fiscal.
4. The FMCG sector is a 4th largest sector of Indian economy.
Social Factors:
1. Rural employment
2. Volume-driven growth in rural market.
3. Major and youth population can increase revenue.
4. The Indian culture, social & life styles are changing drastically.
Technological Factors:
1. Technology has been simplified and available in the industry due to economic reforms.
2. Foreign players help in high technological development.
19
COMPETITORS
Major large-cap companies are
1) HUL
2) DABUR
3) COLGATE PALMOLIVE
4) GODREJ
20
Major MID-cap companies are
1) MARICO
2) EMAMI
3) UNITED SPIRITS
4) UNITED BREWERIES
5) TATA GLOBAL BEVERAGES
21
Major Small-cap companies are
1) TTK HEALTH CARE
2) DPTL
3) BBTC
Net sales of every company project an increasing tendency from 2007 to 2011. This indicates
that FMCG sector is growing and there is consistent growth in net profits despite of the global
economic slowdown. Except those companies which depend on agriculture FMCG sector’s peer
companies made significant growth in both sales and net profits. FMCG companies’ assets
constitute only a smaller part when compared with the sales. It is because these companies are
engaged in price war with their differentiated products rather than maintaining large volume of
assets. Companies are maintaining a good EPS with an average of 10. This projects the strength
22
of the companies in terms of its earning capacity. A low P/E ratio indicates that the price of share
is undervalued and when high, it indicates that P/E ratio is overvalued. It is always best to buy
the share when P/E ratio is low and best to sell when the P/E ratio is high. P/E ratio when low
indicates that share holders have good earnings per share. Furthermore, the return on networth
and return on capital employed are showing a healthy growth. However there are some
fluctuations resulted from the global economic crisis and constantly shooting inflation.
Since the beta for most of the FMCG companies are less than 1, the FMCG sector is a suitable
destination for those investors who are risk averse. However there are few companies whose beta
is greater than or near to 1, reveals that the sector is also a destination for those who are
expecting high returns with high risk.
23
Tata globalbeverages
INTRODUCTION
Tata Global Beverages today is an integrated beverage business that has set out on a journey to
become a global leader in branded ‘good for you’ beverages through innovation, strategic
acquisition and organic growth. With over 200 years of history in the beverage market and a
heritage of innovation and development, Tata Global Beverages has successfully evolved from a
predominantly domestic Indian tea farming company to become marketing and brand focused
global organization with a portfolio of strong brands. It all started when Tata Finlay was set up as
a joint venture between Tata Sons and the UK-based tea plantation company, James Finlay and
Company in 1962. In 1983 Tata Tea was born after James Finlay sold his shareholding to Tata,
heralding the beginning of a new journey. The company set out on a path with global ambitions,
evidenced by the acquisition of Tetley in 2000. This was followed by a string of strategic
acquisitions including Good Earth, Jemca, Vitax, Eight O’ Clock Coffee and Himalayan Water.
Tata Global Beverages, the new name, adopted in April 2010, unites the beverage interests of
Tata under one umbrella. It signals their global ambition, as well as marking the next logical step
in their evolution from a history in plantations to becoming a marketing and brand focused
organization with a portfolio of engaging and exciting strong consumer brands. Tata global
operate in more than 70 countries through a number of subsidiaries and associate entities. Tata
Global Beverages currently employs 3,000 people around the world but through partnerships,
joint ventures and supply chains, many thousands more contribute to its business.
The company’s annual turnover is US$1.7 billion (FY 2009/10) and it is the second largest
player in tea in the world. Its global expansion is highlighted by the fact that over 65 per cent of
the consolidated revenue originates from markets outside of India. The group maintains a strong
focus on consumer brands; more than 90 per cent of turnover is delivered by its branded
products. Over five years ago, nearly all the group’s turnover came from tea interests, but now
the figure is nearer 71 per cent, underpinning its successful diversification strategy and giving it
a leadership position in the ‘good for you’ beverage space.
24
Formerly known as Tata Tea, the business diversified and expanded significantly over the last
decade. It recently opened its new corporate headquarters, located in the UK (Uxbridge, West
London). The group is now making strong strides towards its mission of life enhancing
sustainable hydration with the recent JV agreement with PepsiCo in the area of non carbonated
ready-to-drink beverages, focused on health and enhanced wellness and the acquisition of a stake
in Activate, a performance beverage and bottled water company in the United States. With
innovation and excellence at the heart of everything it does, Tata Global Beverages has a stable
of leading global and regional brands.
 Tata Tea: Tata Tea is officially a ‘super brand’ in India, where it is the second most
trusted hot beverage brand, thanks to national and regional brands – Tata Tea Premium,
Kanan Devan, Chakra Gold, Agni, Gemini, Life and Tata Tea Gold.
 Tetley: Acquired by Tata in 2000, Tetley is currently enjoyed in 70 countries worldwide
and in close to 11 million UK homes. Tetley is a true leader in black tea, decaffeinated
and red bush, with fast growing green tea and innovative tea infusions too. Currently
market leader in the UK and Canada, the brand's strong innovation agenda includes the
first launch of Extra Strong tea for a fuller flavor and Infusions, a liquid ‘Real Brew’ tea
mix for water.
 Good Earth: One of the first American herbal tea companies and a leader in specialty
teas, Good Earth produces and markets fruit, medicinal, red, green, black, white and
organic teas. Today, its premium teas and coffees, all with ‘green’ packaging are enjoyed
across the US, Canada and the UK.
 Vitax: A part of the Tata Global Beverages’ portfolio since 2007, this is a well-
established fruit and herbal tea brand in Poland
 Jemca: This is a market leading tea brand in the Czech Republic with a growing range of
fruit and herbal, black and green teas
 Tata Coffee: The well-known brands here include Mr Bean, Mysore Gold, Coorg Pure,
Tata Cafe and Tata Kaapi. The coffees are grown on 19 estates in the southern states of
India and produce about 10,000 tonnes of natural shade grown Arabica and Robusta
coffees.
25
 Eight O’Clock Coffee: This is the best-selling whole-bean coffee in the United States
and the third-largest coffee brand by volume in the country.
 Grand: Joining the Tata family in 2009, Grand is one of Russia’s leading umbrella
beverage brands – known for its consistent quality, good value coffee, tea, cocoa,
chocolate, green tea and iced tea products – all made using natural, environmentally
friendly ingredients.
 Himalayan Water: A brand that has been a part of Tata since 2007. The water is sourced
directly from an underground aquifer located about 120 metres below the earth's surface
in the Shivalik range of the Himalayas, and is bottled at the source.
 T!on: A new ‘good for you’ cold beverage launched in India in 2008
 SUKK: This is a brand new ‘jelly drink’ concept launched in the UK in 2010.
 T4KIDZ: This caffeine-free hot beverage, specially blended for kids by Tetley in the
UK, was launched in March 2010.
COMPANY ANALYSIS
RATIO ANALYSIS
GROSS PROFIT RATIO:
GP ratio evaluates the effectiveness of business in terms of its sales. Furthermore it indicates the
efficiency of firm in terms of its production and how much profit it has gained from its exact
business. However profitability can also be influenced by the liquidity needs of the organization.
26
GP ratio of TGB is showing a declining tendency. It reduced to 7.08% in 2011 from 17.54% in
2007. The global economic crisis contributed to the decline of gross profit as TGB’s 65% of
revenue originates from markets outside India.
OPERATING PROFIT RATIO:
Operating profit ratio shows the operational efficiency of the business. Higher operating profit
ratio shows higher operational efficiency and vice versa. There may be different ideal positions
constituted by companies according to their internal requirements.
The operating profit ratio is on positive move as the ratio touched 100% in 2009 despite the
global crisis and was near to the same in the subsequent years. The ratio projects that the
company is in good terms of operational efficiency to face the global competition.
NET PROFIT RATIO:
NP ratio is used to measure the overall profitability and hence it is very useful to proprietors..
This ratio also indicates the firm's capacity to face adverse economic conditions such as price
competition, low demand, etc.
The NP ratio shows that the company had been badly affected by the global financial crisis as its
ratio declined from 29% in 2007 to 10% in 2011. However TGB made significant improvement
in 2010 as the ratio touched 23%. The acquisition of Tetley in 2010 contributed for the revival of
the ratio from 11.5% in 2009 to 23% in 2010.
RETURN ON ASSETS
Return on assets reveals the capacity of the company to earn profit with the assets employed.
Despite the global crisis in 2008, TGB’s returns on assets were showing an increasing tendency.
RETURN ON NETWORTH
Return on networth shows the returns available to the equity shareholders of the company.
Return on networth of TGB showed a better position impacted through the increase in its profits
in 2010. However the ratio further showed a declining tendency in the subsequent years.
27
RETURN ON CAPITAL EMPLOYED
ROCE of TBG is decreased from 20% in 2008 to 10% in 2011. However the company
maintained momentum in 2010 with a ratio of 21% because of the acquisition of Tetley.
CURRENT RATIO:
This ratio is a general and quick measure of liquidity of a firm.. A relatively high current ratio is
an indication that the firm is liquid and has the ability to pay its current obligations in time on the
other hand, a relatively low current ratio represents that the liquidity position of the firm is not
good. Hence the profitability and liquidity position of a company are inversely proportional.
Current ratio of TGB is increasing by which it showed a reviving tendency to touch 1.5 in 2011.
Here the company has good current ratio as it maintained it above 1 which indicates that
company has enough cash to pay its current liabilities.
QUICK RATIO:
The quick ratio/acid test ratio is very useful in measuring the ease of liquidating the current
assets of a firm to meet its financial obligations. It measures the firm's capacity to pay off current
obligations immediately and is more rigorous test of liquidity than the current ratio.
The ratios are showing the weaknesses of the company in terms of its capacity to liquidate its
quick assets. The company in terms of liquidity showed a better position in 2009 and 2010 but
declined in 2011.
28
STOCK TO CAPITAL RATIO
Stock to capital ratio of TGB shows that the company started lessen of stocking of the goods as it
declined to 2 in 2011 from 10 in 2007. This indicates that the company is having a good turnover
position with regard to stock.
FIXED ASSET TO CURRENT ASSETS RATIO:
As both the companies are using capital-intensive techniques, they are in need of huge fixed
assets. Fixed assets to current assets ratio measure the efficiency of the companies in maintaining
its fixed assets in relation to its current assets.
In terms of this ratio, TGB is maintaining less fixed assets in relation to its current assets.
DEBT-EQUITY RATIO
Debt to equity ratio indicates the proportionate claims of owners and the outsiders against the
firm’s assets. The purpose is to get an idea of the cushion available to outsiders on the liquidation
of the firm. However, the interpretation of the ratio depends upon the financial and business
policy of the company.
Debt to equity ratio of TGB shows that the company is making significant actions to increase the
shareholder’s returns as the ratio declined from .5 in 2007 to .25 in 2011.
FIXED ASSET RATIO:
Measure of the solvency of a firm, this ratio indicates the extent to which the owners' cash is
frozen in the form of brick and mortar and machinery, and the extent to which funds are
available for the firm's operations.
29
As TGB’s is engaged in price war with the large-cap companies and the peers in mid-cap group,
it aims to make significant progress in the returns. For that it maintained less fixed assets in
relation to current assets. This is projected in the fixed asset ratio also and the company is
maintaining less fixed assets in relation to the networth.
PROPRIETORY RATIO:
This ratio throws light on the general financial strength of the company. It is also regarded as a
test of the soundness of the capital structure. Higher the ratio the better is the long-term solvency
position of the company. A low proprietary ratio will include greater risk to the creditors.
Proprietary ratio of TGB shows that the company is in a better position to meet the financial
obligations to the outsiders.
LONG TERM DEBT-EQUITY RATIO
The company has not maintained large number of long term debt before its acquisition of Tetley.
Acquisition of Tetley in 2010 effect the ratio as it comes to .25 in relation to the equity. But the
company is in a position to safeguard the interest of the owners of the company.
TOTAL CAPITAL TURNOVER RATIO
TGB’s total capital turnover ratio is showing a growth in the company’s turnover in relation to
it’s the total capital employed. This shows that the company is getting ready for a vast expansion.
30
DEBTORS TURNOVER RATIO:
This ratio indicates the number of times the debtors are turned over a year. The higher the value of
debtors turnover ratio the more efficient is the management of debtors or more liquid the debtors are.
Similarly, low debtors turnover ratio implies inefficient management of debtors or less liquid debtors.
It is the reliable measure of the time of cash flow from credit sales. There is no rule of thumb which
may be used as a norm to interpret the ratio as it may be different from firm to firm.
This ratio indicates that the company has continued to maintain the state even after acquiring Tetley
which was valued higher than the acquiring company.
FIXED ASSET TURNOVER RATIO:
This ratio measures the efficiency and profit earning capacity of the concern. Higher the ratio, greater
is the intensive utilization of fixed assets. Lower ratio means under-utilization of fixed assets. The
ratios projects that the company has been continuously improving its capacity and the inference is
that the shareholder’s funds are properly utilized.
WORKING CAPITAL TURNOVER RATIO
Since the company is a major player in the food beverages sector, the company needs to maintain
large stock to outstand the peer companies. For that the company needs to maintain large number of
working capital. But the large scale operations of TGB enabled the company to maintain less working
capital because of the company’s capacity improvement in debtor turnover.
STOCK TURN OVER RATIO:
It measures the velocity of conversion of stock into sales. A low stock turnover ratio indicates an
inefficient management of inventory and vice versa.
The stock turnover ratio has not improved to impact the same in sales. TGB’s stock turnover ratio
shows the inefficiency of the company in inventory management.
31
EPS:
The earnings per share is a good measure of profitability and when compared with EPS of
similar companies, it gives a view of the comparative earnings or earnings power of the firm.
EPS ratio calculated for a number of years indicates whether or not the earning power of the
company has increased.
EPS of TGB shows that the company safeguarding the interest of the shareholders as it is
showing an increasing tendency in the subsequent years of the economic crisis. EPS of 2011
shows a single digit figure because of the share split happened in 27 May 2010.
P/E RATIO:
Price earnings ratio helps the investor in deciding whether to buy or not to buy the shares of a
particular company at a particular market price. Generally, higher the price earnings ratio the
better it is for the company. If the P/E ratio falls, the management should look into the causes
that have resulted into the fall of this ratio.
P/E ratio of TGB is continuously growing a steady growth as it increased from 11.7 in 2007 to
33 in 2011. This indicates that the company can provide returns to those investors who are
expecting high returns with intermediate risk.
DIVIDEND PER SHARE:
The company is distributing good dividends to the shareholders and nearly 30% of the profits are
retained in the company. Despite the global economic crisis, the company has distributed good
dividend to the equity shareholders of the company.
32
DIVIDEND PAYOUT RATIO:
Dividend payout ratio is calculated to find the extent to which earnings per share have been used
for paying dividend and to know what portion of earnings has been retained in the business.
Around 70% of the profit is distributed to the equity shareholders of the company which shows
that the company is a best destination for those investors who expect regular income along with
capital appreciation.
EARNINGS YIELD RATIO
The company has showed a better state in the earnings yield when compared with the peers in
the sector.
PRICE TO SALES RATIO
Price to Sales ratio looks at the current stock price in relation to the total sales per share. The
Price to sales ratio of TGB reflects that the company’s market price is reviving in correlation
with the sales
PRICE TO BOOK VALUE RATIO
Price to book value ratio is the measure that looks at the value of the market price of the
company in relation to the book value of the company. Like the P/E, the lower the Price to book
value ratio, the better the value for shareholders. In that sense TGB is doing a better job.
PRICE TO CASHFLOW RATIO
Price to cash flow ratio is a measure of the market's expectations of a firm's future financial
health. This ratio deals with net cashflows from operations in relation to the market price of the
stock where the effects of depreciation and other non-cash factors are removed. This ratio of
TGB shows that there is a high positive correlation between the two factors namely market price
and net cashflows from operations.
33
SWOT Analysis of TATA Global Beverages
Strength
 Brand name TATA
 Product innovation
 Portfolio of strong brands
 Distribution network and promotional activities
 2nd largest producer in the world in Tea segment
Weakness
 TGB’s brand perception as a tea company makes a stumbling block in venturing into new areas
 Competition couldn’t adopt any strategy to defend its position
 May not centre on a single product
 Not able to increase its sales in expected manner
Opportunities
 Increasing disposable income
 Major portion of the consolidated revenue originates from markets outside India
 Subsidies and support from the government
 Global presence within 70 countries
 Opportunities to increase exports turnover
 Diversification in the segment
Threat
 Competition
 Seasonal fluctuations
 Currency fluctuations
34
SHARE SPLIT
Tata Global Beverage had last split the face value of its shares from Rs 10 to Rs 1 in 2010.The
share has been quoting on an ex-split basis from June 30, 2010. The company had fixed July 02,
2010, as the record date for the purpose of sub-division of the existing equity shares of the
company having the face value of Rs 10 per share into 10 equity shares having a face value of Re
1 each.
Companies that went for stock splits have been getting a positive response on the bourses. It is
believed that a sub-division of shares increase the demand for a scrip. Also, a split increases the
outstanding shares and improves a stock’s liquidity. Considering its current valuation, the stock
split in Tata Tea will certainly be good for retail investors.
Trading volumes has increased more than six folds, with 3, 05,000 equity shares changing hands
as against average 49,000 shares traded daily in two weeks before the split.
BETA OF THE STOCK
The beta for the company in relation with the Nifty index is calculated as .585. Since the beta is
less than 1, it is considered as a less volatile and having a below average risk.
-10.00
-8.00
-6.00
-4.00
-2.00
0.00
2.00
4.00
6.00
8.00
10.00
FMCG Nifty index
TGB
35
INTRINSIC VALUE OF THE STOCK
Intrinsic value is a measure of value based on the future earnings a company is expected to
generate for its investors. It attempts to measure the total net assets a company is expected to
build in the future.
The intrinsic value of TGB is calculated by the financials of the year ended 31 March 2011.
Estimated projections for the year ending 31 March 2012 to calculate the estimated EPS are as
follows
The above projections are made on the basis of certain assumptions. These assumptions are
based on the average rate of the company for the past 5 years.
36
 Net Sales increases by 18%
 COGS remains as 70% of sales
 Operating Expenses decreases by 5%
 Interest increases by 8%
 Depreciation decreases by 10%
 Tax remains at 21%
1. Computation of Value Anchor:
Value Anchor = Estimated EPS * Average P/E Ratio
= 6.26 * 19.94
= 125 (approx)
2. Computation of Value Edge:
Value Edge is the range of the share price which varies up or down 10% of Value anchor
Up Value - 137.5
Down Value - 112.5
Market price of the stock on 31 March 2011 - 97.75
The value edge range lies between Rs 112.5 and 137.5 w tells us that in what price what
can we do with the share.
 The best buy price of the share will be less than 112.5
 The best sell price of the share will be when it is more than 137.5
 When the price is above 112.5 and below 137.5, it is better to hold the share.
37
CONCLUSION
Since the intrinsic value 25% higher than the market price on 31 March 2011, investors can go
for this as a safe investment. Investors who are risk averse but ready to take intermediate risk can
invest in TGB stock because the stock is less volatile and showed a better stand when compared
with the FMCG Nifty index. However there may be fluctuations in the price of stock with regard
to market movement. Also TGB is a safe destination for those investors who want a regular
return along with capital appreciation for their investment because the company has been
continuously distributing an average of 65% of profits as dividends. Income fund managers can
look at TGB to provide value for the unit holders.
REFERENCES
www.nseindia.com
www.rbi.org
finmin.nic.in
www.mca.gov.in
mospi.nic.in
planningcommission.nic.in
www.tataglobalbeverages.com
38

More Related Content

What's hot

June 2020 PMI Slidepack
June 2020 PMI SlidepackJune 2020 PMI Slidepack
June 2020 PMI SlidepackRichard Ramsey
 
Market report q3 2021 fin
Market report q3 2021 finMarket report q3 2021 fin
Market report q3 2021 finTMS_Consultancy
 
Latvijas Banka Monthly Newsletter 02/2018
Latvijas Banka Monthly Newsletter 02/2018Latvijas Banka Monthly Newsletter 02/2018
Latvijas Banka Monthly Newsletter 02/2018Latvijas Banka
 
Summa serrano (1 oct 2015) distribution and cost push inflation in brazil...
Summa serrano (1 oct 2015) distribution and cost push     inflation in brazil...Summa serrano (1 oct 2015) distribution and cost push     inflation in brazil...
Summa serrano (1 oct 2015) distribution and cost push inflation in brazil...Grupo de Economia Política IE-UFRJ
 
Lithuanian Economy - No 1, January 4, 2012
Lithuanian Economy - No 1, January 4,  2012Lithuanian Economy - No 1, January 4,  2012
Lithuanian Economy - No 1, January 4, 2012Swedbank
 
Monthly Newsletter 02/2016
Monthly Newsletter 02/2016Monthly Newsletter 02/2016
Monthly Newsletter 02/2016Latvijas Banka
 
IJSRED-V2I3P101
IJSRED-V2I3P101IJSRED-V2I3P101
IJSRED-V2I3P101IJSRED
 
Monthly Newsletter 6/2015
Monthly Newsletter 6/2015Monthly Newsletter 6/2015
Monthly Newsletter 6/2015Latvijas Banka
 
The Lithuanian Economy - 2010, May
The Lithuanian Economy - 2010, MayThe Lithuanian Economy - 2010, May
The Lithuanian Economy - 2010, MaySwedbank
 
Ulster Bank NI July 2019 PMI Slide pack
Ulster Bank NI July 2019 PMI Slide packUlster Bank NI July 2019 PMI Slide pack
Ulster Bank NI July 2019 PMI Slide packRichard Ramsey
 
H245258
H245258H245258
H245258aijbm
 
Monthly Newsletter 4/2013
Monthly Newsletter 4/2013Monthly Newsletter 4/2013
Monthly Newsletter 4/2013Latvijas Banka
 
Indian Economy
Indian EconomyIndian Economy
Indian Economykisnaneo
 
Impact of-covid-19-on-indian-economy-ficci-2003
Impact of-covid-19-on-indian-economy-ficci-2003Impact of-covid-19-on-indian-economy-ficci-2003
Impact of-covid-19-on-indian-economy-ficci-2003HarshVerma196
 
Ulster Bank Northern Ireland PMI February 2021 Slide Pack
Ulster Bank Northern Ireland PMI February 2021 Slide PackUlster Bank Northern Ireland PMI February 2021 Slide Pack
Ulster Bank Northern Ireland PMI February 2021 Slide PackRichard Ramsey
 
Monthly Newsletter 1/2015
Monthly Newsletter 1/2015Monthly Newsletter 1/2015
Monthly Newsletter 1/2015Latvijas Banka
 
Market Outlook- 2019
Market Outlook- 2019Market Outlook- 2019
Market Outlook- 2019Shreya Gulati
 

What's hot (20)

June 2020 PMI Slidepack
June 2020 PMI SlidepackJune 2020 PMI Slidepack
June 2020 PMI Slidepack
 
Market report q2 2021
Market report q2 2021Market report q2 2021
Market report q2 2021
 
Market report q3 2021 fin
Market report q3 2021 finMarket report q3 2021 fin
Market report q3 2021 fin
 
Latvijas Banka Monthly Newsletter 02/2018
Latvijas Banka Monthly Newsletter 02/2018Latvijas Banka Monthly Newsletter 02/2018
Latvijas Banka Monthly Newsletter 02/2018
 
Market report q4 2021
Market report q4 2021Market report q4 2021
Market report q4 2021
 
Summa serrano (1 oct 2015) distribution and cost push inflation in brazil...
Summa serrano (1 oct 2015) distribution and cost push     inflation in brazil...Summa serrano (1 oct 2015) distribution and cost push     inflation in brazil...
Summa serrano (1 oct 2015) distribution and cost push inflation in brazil...
 
Lithuanian Economy - No 1, January 4, 2012
Lithuanian Economy - No 1, January 4,  2012Lithuanian Economy - No 1, January 4,  2012
Lithuanian Economy - No 1, January 4, 2012
 
Monthly Newsletter 02/2016
Monthly Newsletter 02/2016Monthly Newsletter 02/2016
Monthly Newsletter 02/2016
 
IJSRED-V2I3P101
IJSRED-V2I3P101IJSRED-V2I3P101
IJSRED-V2I3P101
 
Monthly Newsletter 6/2015
Monthly Newsletter 6/2015Monthly Newsletter 6/2015
Monthly Newsletter 6/2015
 
Gdp march 2012
Gdp march 2012Gdp march 2012
Gdp march 2012
 
The Lithuanian Economy - 2010, May
The Lithuanian Economy - 2010, MayThe Lithuanian Economy - 2010, May
The Lithuanian Economy - 2010, May
 
Ulster Bank NI July 2019 PMI Slide pack
Ulster Bank NI July 2019 PMI Slide packUlster Bank NI July 2019 PMI Slide pack
Ulster Bank NI July 2019 PMI Slide pack
 
H245258
H245258H245258
H245258
 
Monthly Newsletter 4/2013
Monthly Newsletter 4/2013Monthly Newsletter 4/2013
Monthly Newsletter 4/2013
 
Indian Economy
Indian EconomyIndian Economy
Indian Economy
 
Impact of-covid-19-on-indian-economy-ficci-2003
Impact of-covid-19-on-indian-economy-ficci-2003Impact of-covid-19-on-indian-economy-ficci-2003
Impact of-covid-19-on-indian-economy-ficci-2003
 
Ulster Bank Northern Ireland PMI February 2021 Slide Pack
Ulster Bank Northern Ireland PMI February 2021 Slide PackUlster Bank Northern Ireland PMI February 2021 Slide Pack
Ulster Bank Northern Ireland PMI February 2021 Slide Pack
 
Monthly Newsletter 1/2015
Monthly Newsletter 1/2015Monthly Newsletter 1/2015
Monthly Newsletter 1/2015
 
Market Outlook- 2019
Market Outlook- 2019Market Outlook- 2019
Market Outlook- 2019
 

Viewers also liked

Management principles developed by henri fayol
Management principles developed by henri fayolManagement principles developed by henri fayol
Management principles developed by henri fayolRajat Sharma
 
Fayol s 14_principles
Fayol s 14_principlesFayol s 14_principles
Fayol s 14_principlesNice Ahmed
 
Henri Fayol 14 Principles of Management
Henri Fayol 14 Principles of Management Henri Fayol 14 Principles of Management
Henri Fayol 14 Principles of Management Muhammad Osama Hussain
 
The 14 Principles of Management
The 14 Principles of ManagementThe 14 Principles of Management
The 14 Principles of ManagementPratikshya Mishra
 
Henri fayol 14 principles with amendments(1)
Henri fayol 14 principles with amendments(1)Henri fayol 14 principles with amendments(1)
Henri fayol 14 principles with amendments(1)Sooriyabandara Gammune
 
Henry fayols priciple of management- image ppt
Henry fayols priciple of management- image pptHenry fayols priciple of management- image ppt
Henry fayols priciple of management- image pptNajeeb Ahmed
 
Henri fayols 14-principles-of-management
Henri fayols 14-principles-of-managementHenri fayols 14-principles-of-management
Henri fayols 14-principles-of-managementHs Prince
 
14 Principles Of Management
14 Principles Of Management14 Principles Of Management
14 Principles Of Managementrahul singh
 
14 Principles of Management by Henri Fayol with Case Study
14 Principles of Management by Henri Fayol with Case Study14 Principles of Management by Henri Fayol with Case Study
14 Principles of Management by Henri Fayol with Case StudySheikh_Rehmat
 
Henri fayol’s 14 Principles of Management
Henri fayol’s 14 Principles of ManagementHenri fayol’s 14 Principles of Management
Henri fayol’s 14 Principles of ManagementPadmasrinivas N
 
Business Studies (Principles of Management) Project Class 12th CBSE
Business Studies (Principles of Management) Project Class 12th CBSE Business Studies (Principles of Management) Project Class 12th CBSE
Business Studies (Principles of Management) Project Class 12th CBSE Dheeraj Kumar
 

Viewers also liked (13)

Management principles developed by henri fayol
Management principles developed by henri fayolManagement principles developed by henri fayol
Management principles developed by henri fayol
 
Fayol s 14_principles
Fayol s 14_principlesFayol s 14_principles
Fayol s 14_principles
 
Henri Fayol 14 Principles of Management
Henri Fayol 14 Principles of Management Henri Fayol 14 Principles of Management
Henri Fayol 14 Principles of Management
 
Pantene
PantenePantene
Pantene
 
Mm pantene final
Mm pantene finalMm pantene final
Mm pantene final
 
The 14 Principles of Management
The 14 Principles of ManagementThe 14 Principles of Management
The 14 Principles of Management
 
Henri fayol 14 principles with amendments(1)
Henri fayol 14 principles with amendments(1)Henri fayol 14 principles with amendments(1)
Henri fayol 14 principles with amendments(1)
 
Henry fayols priciple of management- image ppt
Henry fayols priciple of management- image pptHenry fayols priciple of management- image ppt
Henry fayols priciple of management- image ppt
 
Henri fayols 14-principles-of-management
Henri fayols 14-principles-of-managementHenri fayols 14-principles-of-management
Henri fayols 14-principles-of-management
 
14 Principles Of Management
14 Principles Of Management14 Principles Of Management
14 Principles Of Management
 
14 Principles of Management by Henri Fayol with Case Study
14 Principles of Management by Henri Fayol with Case Study14 Principles of Management by Henri Fayol with Case Study
14 Principles of Management by Henri Fayol with Case Study
 
Henri fayol’s 14 Principles of Management
Henri fayol’s 14 Principles of ManagementHenri fayol’s 14 Principles of Management
Henri fayol’s 14 Principles of Management
 
Business Studies (Principles of Management) Project Class 12th CBSE
Business Studies (Principles of Management) Project Class 12th CBSE Business Studies (Principles of Management) Project Class 12th CBSE
Business Studies (Principles of Management) Project Class 12th CBSE
 

Similar to Security Analysis Project on Tata Global Beverages

Economic survey of india.ppt
Economic survey of india.pptEconomic survey of india.ppt
Economic survey of india.pptVamshi Raj
 
Economic survey of india
Economic survey of indiaEconomic survey of india
Economic survey of indiaGaurav Sinha
 
Sourajit Aiyer - Finance Monthly Magazine, UK - Catching Up On The India Stor...
Sourajit Aiyer - Finance Monthly Magazine, UK - Catching Up On The India Stor...Sourajit Aiyer - Finance Monthly Magazine, UK - Catching Up On The India Stor...
Sourajit Aiyer - Finance Monthly Magazine, UK - Catching Up On The India Stor...South Asia Fast Track
 
India macroeconomy
India macroeconomyIndia macroeconomy
India macroeconomygarimayadav7
 
China macroeconomy
China macroeconomyChina macroeconomy
China macroeconomygarimayadav7
 
Heritage Foods ltd
Heritage Foods ltdHeritage Foods ltd
Heritage Foods ltdAditya Mehta
 
Monetary policy review 2012 13
Monetary policy review 2012 13Monetary policy review 2012 13
Monetary policy review 2012 13StudsPlanet.com
 
Role of CFO in the Economic Turnaround - What are the Macro Economic Policies...
Role of CFO in the Economic Turnaround - What are the Macro Economic Policies...Role of CFO in the Economic Turnaround - What are the Macro Economic Policies...
Role of CFO in the Economic Turnaround - What are the Macro Economic Policies...Resurgent India
 
Indicus Ma Foi Randstad Employment Trends Survey - Wave 2 - 2011
Indicus Ma Foi Randstad Employment Trends Survey - Wave 2 - 2011Indicus Ma Foi Randstad Employment Trends Survey - Wave 2 - 2011
Indicus Ma Foi Randstad Employment Trends Survey - Wave 2 - 2011Indicus Analytics Private Limited
 
US GDP Analysis for July 2011
US GDP Analysis for July 2011 US GDP Analysis for July 2011
US GDP Analysis for July 2011 David Crace
 

Similar to Security Analysis Project on Tata Global Beverages (20)

Economic survey of india.ppt
Economic survey of india.pptEconomic survey of india.ppt
Economic survey of india.ppt
 
Economic survey of india
Economic survey of indiaEconomic survey of india
Economic survey of india
 
Sourajit Aiyer - Finance Monthly Magazine, UK - Catching Up On The India Stor...
Sourajit Aiyer - Finance Monthly Magazine, UK - Catching Up On The India Stor...Sourajit Aiyer - Finance Monthly Magazine, UK - Catching Up On The India Stor...
Sourajit Aiyer - Finance Monthly Magazine, UK - Catching Up On The India Stor...
 
Gdp india
Gdp indiaGdp india
Gdp india
 
India macroeconomy
India macroeconomyIndia macroeconomy
India macroeconomy
 
Global economy
Global economyGlobal economy
Global economy
 
Economy Matters, November-December 2013
Economy Matters, November-December 2013Economy Matters, November-December 2013
Economy Matters, November-December 2013
 
Economy Matters - July-August 2014
Economy Matters - July-August 2014Economy Matters - July-August 2014
Economy Matters - July-August 2014
 
China macroeconomy
China macroeconomyChina macroeconomy
China macroeconomy
 
Heritage Foods ltd
Heritage Foods ltdHeritage Foods ltd
Heritage Foods ltd
 
Monetary policy review 2012 13
Monetary policy review 2012 13Monetary policy review 2012 13
Monetary policy review 2012 13
 
Role of CFO in the Economic Turnaround - What are the Macro Economic Policies...
Role of CFO in the Economic Turnaround - What are the Macro Economic Policies...Role of CFO in the Economic Turnaround - What are the Macro Economic Policies...
Role of CFO in the Economic Turnaround - What are the Macro Economic Policies...
 
Employment Trends Survey 2012
Employment Trends Survey 2012Employment Trends Survey 2012
Employment Trends Survey 2012
 
c
cc
c
 
gp1302b.pdf
gp1302b.pdfgp1302b.pdf
gp1302b.pdf
 
Indicus Ma Foi Randstad Employment Trends Survey - Wave 2 - 2011
Indicus Ma Foi Randstad Employment Trends Survey - Wave 2 - 2011Indicus Ma Foi Randstad Employment Trends Survey - Wave 2 - 2011
Indicus Ma Foi Randstad Employment Trends Survey - Wave 2 - 2011
 
Economy Matters: July-August 2015
Economy Matters: July-August 2015Economy Matters: July-August 2015
Economy Matters: July-August 2015
 
Economy Matters: November - December Issue
Economy Matters: November - December IssueEconomy Matters: November - December Issue
Economy Matters: November - December Issue
 
Singapore Residential Property Outlook 2015
Singapore Residential Property Outlook 2015Singapore Residential Property Outlook 2015
Singapore Residential Property Outlook 2015
 
US GDP Analysis for July 2011
US GDP Analysis for July 2011 US GDP Analysis for July 2011
US GDP Analysis for July 2011
 

Security Analysis Project on Tata Global Beverages

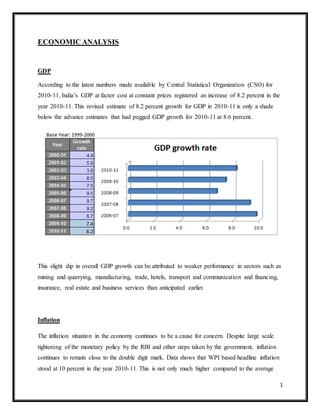
  • 1. 1 ECONOMIC ANALYSIS GDP According to the latest numbers made available by Central Statistical Organization (CSO) for 2010-11, India’s GDP at factor cost at constant prices registered an increase of 8.2 percent in the year 2010-11. This revised estimate of 8.2 percent growth for GDP in 2010-11 is only a shade below the advance estimates that had pegged GDP growth for 2010-11 at 8.6 percent. This slight dip in overall GDP growth can be attributed to weaker performance in sectors such as mining and quarrying, manufacturing, trade, hotels, transport and communication and financing, insurance, real estate and business services than anticipated earlier. Inflation The inflation situation in the economy continues to be a cause for concern. Despite large scale tightening of the monetary policy by the RBI and other steps taken by the government, inflation continues to remain close to the double digit mark. Data shows that WPI based headline inflation stood at 10 percent in the year 2010-11. This is not only much higher compared to the average
  • 2. 2 inflation rate of 3.6 percent seen in 2009-10 but also way above the 5 percent mark considered as the ‘growth promoting inflation level’ or the ‘normal inflation level’ by the RBI. Latest numbers on inflation available for the month of May 2011 shows that headline inflation stood at 9.1 percent in May 2011. Although it is slightly lower than 10.5 percent inflation registered in August 2010, it is still too high as per RBI’s standards. Data on the month on month growth in WPI based inflation also shows that the underlying inflationary pressures in the economy are maintained. The month on month growth in inflation in May 2011 stood at 0.7 percent. In the previous two months March and April, the corresponding figures stood at 0.9 percent and 0.7 percent respectively. However inflation does not have a great impact on the share price of the FMCG companies because of the necessary goods or goods used by consumer on daily basis even though inflation increase their purchasing power of FMCG goods continue to be same . So inflation does not have much impact on the goods. As India is a price sensitive country, FMCG companies cannot increase the price of products even though cost of production increase, so inflation will not have that impact on the price of stock of such companies. Due to inflation, the major companies’ operating expenses have increased as a result the profits of the current year have been decreased, because they can’t increase the price of finished goods. That company which depends on the agriculture for production will have certain impact when inflation goes up.
  • 3. 3 Foreign Trade Financial year 2010-11 was exceptionally good for Indian exporters. With overall exports amounting to US$ 245.5 billion, the sector registered a growth of 37.7 percent in 2010-11 over the previous year. And this was a record growth witnessed in exports since independence. Further, the monthly data for exports for the year 2010-11shows that growth in exports has been particularly strong since November 2010. While during the Period of April to October 2010, exports grew at an average rate of 26.8 %, overall growth was much higher in the remaining part of the year. In fact, during November 2010 and March 2011, India’s exports grew at a whopping 44.3 percent on average. The onset of recovery in the global economy, which was led by the emerging economies, coupled with continuation of export sops announced by the government as part of the fiscal packages offered during the crisis period gave the sector the much needed impetus. The support provided by the government in the form of measures such as interest subvention of 2 percent on pre and post shipment export credit was instrumental in reviving the badly hit labor intensive export oriented industries. The strong momentum in exports, seen particularly during the second half of 2010-11, has continued in the year 2011-12 as well.
  • 4. 4 Coming to imports, it seems that in the year 2010-11 the imports totaled US$ 350.4 billion. This represents an increase of about 21.8 percent over the previous year’s imports of about US$ 287.6 billion. During the year 2010-11, imports of both petroleum crude and products (POL) and non- petroleum crude and products (Non POL) went up. While POL imports amounted to US$ 101.7 billion in 2010-11 and posted a growth of 16.7 percent over the previous year, non-POL imports amounted to US$ 248.7 billion and registered a growth of 24.0 percent over the previous year. With exports likely to come under pressure and imports showing little signs of easing in the coming months, the trade balance in 2011-12 could widen. Foreign Investments Data on total foreign investment flows into the country shows that in 2010-11, foreign investment flows into India saw a dip of about 17% over the previous year. Further, when we look at the two main components of foreign investment, namely foreign direct investment and portfolio investment, we see that the dip is largely on account of a slowdown seen in case of FDI. As the table below shows, FDI flows into India in 2009-10 were to the tune of US$ 37.7 billion and in 2010-11 this figure came down to US$ 27 billion. Portfolio flows, which were to the tune of US$ 32.4 billion in 2009-10, saw a marginal dip to about US$ 31.5 billion in 2010-11. The figures for FDI over the last few years show that the quantum received in 2010-11 was the lowest in the last four years. This clear slowing down in the flow of FDI funds towards India
  • 5. 5 should be a matter of concern for the authorities. Further, data on sector wise FDI flows into India for the period April to February 2010-11 shows that out of a total of top 25 sectors, 15 sectors saw a dip in FDI flows in 2010-11 compared to flows in the previous year. And out of these 15 sectors, it is sectors like services, construction activities, housing and real estate, telecommunication and agricultural services that have taken the biggest hit in terms of inflows compared to corresponding period of the previous year i.e. 2009-10. As this slowdown in FDI is happening at a time when the country is preparing plans to achieve a target growth of 9 to 9.5 percent over the 12th Plan Period, it becomes important to get to the core of this issue and take corrective action. In this context, it may be reiterated that completion
  • 6. 6 of the much awaited FDI policy reforms in sectors such as insurance, defense and multi-brand retail would also give a boost to overall FDI flows into the country. Forex Reserves India’s foreign exchange reserves increased as it moved ahead in fiscal 2010-11. As data given in the table below shows, while in April 2010, India’s foreign exchange reserves totaled US$ 279.6 billion, in September 2010 this figure had increased to US$ 292.9 billion. Most recent numbers show that the country’s foreign exchange reserves have shot up further crossing the US$ 300 billion mark. With this level of reserves, India is amongst the ten largest holders of foreign exchange reserves in the world. Regarding the outlook for the Indian Rupee against the US$ in the months ahead, the majority view amongst analysts and currency strategists is one of depreciation. This bearish view with regard to the Indian Rupee is based on two factors. First is the likely deterioration in the current account due to moderation in exports, continuous rise in imports and a possible slowdown in invisible receipts. Second is the expected slowdown in funds flows into India. While FDI flows into the Indian market are already on a slowdown mode, FII flows too are showing signs of anxiety over the evolving macro-economic situation with inflation remaining high and growth slowing down.
  • 7. 7 Performance of the Corporate Sector The data above on corporate sector performance shows that in the fourth quarter of fiscal 2010- 11, corporate India turned out a good performance both in terms of sales and profits. Such a performance is particularly noteworthy as it came at a time when overall expenses are going up at a fast clip. Further the net sales of ‘All Industries’ in the fourth quarter of 2010-11 registered a growth of 23.5 percent. This is the highest growth in net sales that we have seen in the last eight quarters. Further, while firms from the manufacturing sector saw an increase of 22.26 percent in
  • 8. 8 net sales in the last quarter of 2010-11, companies from the services (other than financial) sector saw sales going up by 27.46 percent. Further, within the manufacturing sector, growth in sales has been particularly strong in sectors such as textiles, cement, steel and transport equipment. Performance of the food and beverages sector and the chemicals sector lagged the average for the manufacturing sector as a whole with food and beverages sector seeing net sales going up by about 8.5 percent in Q4, 2010-11.
  • 9. 9 INDUSTRY ANALYSIS Introduction to FMCG Sector Products which have a quick turnover, and relatively low cost are known as Fast Moving Consumer Goods (FMCG). FMCG products are those that get replaced within a year. Examples of FMCG generally include a wide range of frequently purchased consumer products such as toiletries, soap, cosmetics, tooth cleaning products, shaving products and detergents, as well as other non-durables such as glassware, bulbs, batteries, paper products, and plastic goods. FMCG may also include pharmaceuticals, consumer electronics, packaged food products, soft drinks, tissue paper, and chocolate bars. India’s FMCG sector is the fourth largest sector in the economy and creates employment for more than three million people in downstream activities. Its principal constituents are Household Care, Personal Care and Food & Beverages. The total FMCG market is in excess of Rs. 90,000 crores. It is currently growing at double digit growth rate and is expected to maintain a high growth rate. FMCG Industry is characterized by a well established distribution network, low penetration levels, low operating cost, lower per capita consumption and intense competition between the organized and unorganized segments. Industry Category and Products 1) Household Care a) Personal Wash:- The market size of personal wash is estimated to be around Rs. 8,300 Cr. The personal wash can be segregated into three segments: Premium, Economy and Popular. The penetration level of soaps is 92 per cent. It is available in 5 million retail stores, out of which, 75 per cent are in the rural areas. HUL is the leader with market share of 53 per cent; Godrej occupies second position with market share of 10 per cent. With increase in disposable incomes, growth in rural demand is expected to increase because consumers are moving up towards premium products. However, in the recent past there has not been much change in the volume of premium soaps in proportion to economy soaps, because increase in prices has led some consumers to look for cheaper
  • 10. 10 substitutes. Hindustan Unilever Limited is the biggest producer of Personal wash and detergents. The segment is expected to grow by double digit. b) Detergents:- The size of the detergent market is estimated to be Rs. 12,000 Cr. Household care segment is characterized by high degree of competition and high level of penetration. With rapid urbanization, emergence of small pack size and sachets, the demand for the household care products is flourishing. The demand for detergents has been growing but the regional and small unorganized players account for a major share of the total volume of the detergent market. In washing powder HUL is the leader with 38 per cent of market share. Other major players are Nirma, Henkel and Proctor & Gamble. 2) Personal Care a) Skin Care:- The total skin care market is estimated to be around Rs. 4,000 Cr. The skin care market is at a primary stage in India. The penetration level of this segment in India is around 20 per cent. With changing life styles, increase in disposable incomes, greater product choice and availability, people are becoming aware about personal grooming. The major players in this segment are Hindustan Unilever with a market share of 54 per cent, followed by CavinKare with a market share of 12 per cent and Godrej with a market share of 3 per cent. b) Hair Care:- The hair care market in India is estimated at around Rs. 3,800 Cr. The hair care market can be segmented into hair oils, shampoos, hair colorants and conditioners, and hair gels. Marico is the leader in Hair Oil segment with market share of 33 per cent; Dabur occupies second position with 17 per cent. The Indian shampoo market is estimated to be around Rs. 2,700 Cr. It has the penetration level of only 13 per cent in India. Sachet makes up to 40 per cent of the total shampoo sale. It has low penetration level even in metros. Again the market is dominated by HUL with around 47 per cent market share; P&G occupies second position with market share of around 23 per cent. Anti-dandruff segment constitutes around 15 per cent of the total shampoo
  • 11. 11 market. The market is further expected to increase due to increased marketing by players and availability of shampoos in affordable sachets. c) Oral Care:- The oral care market can be segmented into toothpaste of 60 per cent; toothpowder with 23%; toothbrushes with 17 per cent. The total toothpaste market is estimated to be around Rs. 3,500 Cr. The penetration level of toothpowder/toothpaste in urban areas is three times that of rural areas. This segment is dominated by Colgate-Palmolive with market share of 49 per cent, while HUL occupies second position with market share of 30 per cent. In toothpowders market, Colgate and Dabur are the major players. The oral care market, especially toothpastes, remains under penetrated in India with penetration level 50 percent 3) Food & Beverages a) Food Segment :- The foods category in FMCG is gaining popularity with a swing of launches by HUL, ITC, Godrej, Tata Global Beverages and others. This category has 18 major brands aggregating Rs. 4,600 Cr. Nestle and Amul slug it out in the powders segment. The food category has also seen innovations like softies in ice creams, ready to eat rice by HUL and pizzas by both GCMMF and Godrej Pillsbury. b) Beverages Tea :- According to Tea Board of India, the export of tea is expected to be more than 240 million kg for the year 2011 against about 225 million kg last year. The major share of tea market is dominated by unorganized players. More than 50 per cent of the market share is capture by unorganized players. Leading branded tea players are HUL and Tata Global Beverages. Coffee:- The Indian beverage industry faces over supply in segments like coffee and tea. However, more than 50 per cent of the market share is in unpacked or loose form. The major players in this segment are Nestlé, HUL and Tata Global Beverages.
  • 12. 12 SECTORAL CONTRIBUTION TO GDP OF INDIA The 90,000 Crores Indian FMCG market is one of the important sectors of Indian economy, has registered a robust growth rate. Indian FMCG industry is expected to register a healthy growth in the year of 2011-12 despite the economic downturn in 2008 and subsequent years. The industry is expected to register a 14% growth in the 2011-12 financial Year as compared to the last year. Unlike other sectors, the FMCG industry did not slow down, since 2009 the industry is doing pretty well, bucking the trend. As it is meeting the every-day demands of consumers, it will continue to grow. In the last two years, input costs have come down and this will reflect in the results of coming years. Particulars 2008-2009 2009-2010 Agriculture and allied activities 650461 651901 Agriculture 547980 767119 Industry 830246 916356 Mining and Quarrying 98745 109182 Manufacturing 649635 719975 Electricity, Water and Gas Supply 81866 87199 Services 2674266 2895824 Construction 332782 354541 Trades, hotels, Transport and communication 1084764 1185190 Financing, Insurance, Real Estate & Business Services 701338 769390 Community, Social & Personal Services 555382 586703
  • 13. 13 Market share movements indicate that companies such as HUL, Marico Ltd and Nestle India Ltd, with domination in their key categories, have improved their market shares and outperformed peers in the FMCG sector. This has been also aided by the lack of competition in the respective categories. Single product leaders such as Colgate Palmolive India Ltd and Britannia Industries Ltd have also witnessed strength in their respective categories, aided by innovations and strong distribution. Strong players in the economy segment like Godrej Consumer Products Ltd in soaps and Dabur in toothpastes have also posted market share improvement, with revived growth in semi-urban and rural markets. Porter’s five forces model for FMCG sector Threat of new entrants Economies of scale difficult, product differentiation, capital requirements, cost disadvantage. Bargaining power of Suppliers Large number of suppliers, fragmented environment, switching cost, threat of forward integration Bargainingpowerof Buyers Large number of buyers , switching cost, no individual buyer can impact, less threat of backward integration Rivalry among existing firms Threat of Substitutes Increasing health concerns, changing consumption patterns, customer expectations External forces: political &legal, technological, demographical
  • 14. 14 1) Rivalry among existing Firms In the FMCG sector, the rivalry among competitors is very fierce. There is large number of geographically separated customers because the industry is highly saturated and the competitors try to snatch their share in the market. Market Players use all sorts of tactics and activities from intensive advertisement campaigns to promotional stuff and price wars etc. Hence the intensity of rivalry is very high in FMCG sector. 2) Threat of new entrants FMCG Industry does not have any measures which can control the entry of new firms. The resistance is very low and the structure of the industry is so complex that new firms can easily enter and also offer tough competition due to cost effectiveness. Hence potential entry of new firms is high. 3) Threat of Substitutes There are complex and never ending consumer needs and no firm can satisfy all sorts of needs alone. There are plenty of substitute goods available in the market that can be re-placed if consumers are not satisfied with one. The wide range of choices and needs give a sufficient room for new product development that can replace existing goods. This leads to higher consumer’s expectation. However the changing consumption pattern is a major concern in the sector. 4) Bargaining power of Suppliers The bargaining power of suppliers of raw materials and intermediate goods is not very high. There is ample number of substitute suppliers available and the raw materials are also readily available and most of the raw materials are homogeneous. There is no monopoly situation in the supplier side because the suppliers are also competing among themselves but there are chances of forward integration.
  • 15. 15 5) Bargaining power of Buyers Bargaining power of consumers is also very high. This is because in FMCG industry, the switching cost of most of the goods is very low and there is no threat of buying one product over other. Customers are never reluctant to buy or try new things off the shelf. SWOT Analysis of FMCG sector Strengths: • Low operational costs. • Presence of established distribution networks in both urban and rural areas. • Presence of well-known brands. Weaknesses: • Lower scope of investing in technology and achieving economies of scale. • Low exports levels • "Me-tooʺ products, which illegally mimic the labels of the established brands narrow the scope of FMCG products in rural and semi-urban market. Opportunities: • Untapped rural market • Rising income levels, i.e. increase in purchasing power of consumers • Large domestic market- a population of over one billion. • Export potential • High consumer goods spending Threats: • Removal of import restrictions resulting in replacing of domestic brands • Slowdown in rural demand • Tax and regulatory structure
  • 16. 16 Business life cycle of FMCG sector Growing FMCG Sector The FMCG sector of India expected to grow at 15% of compounded annual growth rate (CAGR). In the year 2015 it is expected to grow at 23%. FMCG depends on the population of India and many people (rural and urban) of India are aware of the FMCG goods due to the advertisements and campaigns done by the companies to increase the market share. In 2015, Indians under age 30 are expected to be around 55% of the total population, which will proportionately impact by higher purchasing power. Well established distribution network, high penetration levels, low operating cost, lower per capita consumption and intense competition between the organized and unorganized segments will provide FMCG sector over the other sectors. Being fourth largest sector in India, FMCG sector is in the growth stage with a growth rate of 15%.
  • 17. 17 SWOT Analysis Matrix Threat External environment Opportunity Strength Weakness Internal environment Considering all the factors, FMCG is considered as a less risky sector to invest. FMCG sector stocks are best for those investors who are less risk averse. The betas for major stocks are less than one, which is considered to be less volatile and less return. Being the fourth largest sector in India, FMCG it is expected to grow in the future. In future there will be more penetration in rural and urban areas. Population of India is growing at a fast rate and touched 1.17 billion. This will impact on the demand for FMCG. This sector may be appropriate for those investors who are less risk averse. FMCG sector is in a growth stage so it better to buy the stocks for longer duration. It does not give much return in case of intraday trading. Confront Avoid Exploit Search
  • 18. 18 PEST Analysis Political Factors: 1. GST Regime 2. Transportation and infrastructure development in rural areas helps in distribution network. 3. Restrictions in import policies. 4. Help and assistance for agricultural sector in the form subsidies and tax relaxation. Economic Factors: 1. GDP rate increase along with the population. 2. Increase in disposable income at 10 % annually for next 8 yrs. 3. Indian FMCG sector recorded 16% Sales Growth in Last Fiscal. 4. The FMCG sector is a 4th largest sector of Indian economy. Social Factors: 1. Rural employment 2. Volume-driven growth in rural market. 3. Major and youth population can increase revenue. 4. The Indian culture, social & life styles are changing drastically. Technological Factors: 1. Technology has been simplified and available in the industry due to economic reforms. 2. Foreign players help in high technological development.
  • 19. 19 COMPETITORS Major large-cap companies are 1) HUL 2) DABUR 3) COLGATE PALMOLIVE 4) GODREJ
  • 20. 20 Major MID-cap companies are 1) MARICO 2) EMAMI 3) UNITED SPIRITS 4) UNITED BREWERIES 5) TATA GLOBAL BEVERAGES
  • 21. 21 Major Small-cap companies are 1) TTK HEALTH CARE 2) DPTL 3) BBTC Net sales of every company project an increasing tendency from 2007 to 2011. This indicates that FMCG sector is growing and there is consistent growth in net profits despite of the global economic slowdown. Except those companies which depend on agriculture FMCG sector’s peer companies made significant growth in both sales and net profits. FMCG companies’ assets constitute only a smaller part when compared with the sales. It is because these companies are engaged in price war with their differentiated products rather than maintaining large volume of assets. Companies are maintaining a good EPS with an average of 10. This projects the strength
  • 22. 22 of the companies in terms of its earning capacity. A low P/E ratio indicates that the price of share is undervalued and when high, it indicates that P/E ratio is overvalued. It is always best to buy the share when P/E ratio is low and best to sell when the P/E ratio is high. P/E ratio when low indicates that share holders have good earnings per share. Furthermore, the return on networth and return on capital employed are showing a healthy growth. However there are some fluctuations resulted from the global economic crisis and constantly shooting inflation. Since the beta for most of the FMCG companies are less than 1, the FMCG sector is a suitable destination for those investors who are risk averse. However there are few companies whose beta is greater than or near to 1, reveals that the sector is also a destination for those who are expecting high returns with high risk.
  • 23. 23 Tata globalbeverages INTRODUCTION Tata Global Beverages today is an integrated beverage business that has set out on a journey to become a global leader in branded ‘good for you’ beverages through innovation, strategic acquisition and organic growth. With over 200 years of history in the beverage market and a heritage of innovation and development, Tata Global Beverages has successfully evolved from a predominantly domestic Indian tea farming company to become marketing and brand focused global organization with a portfolio of strong brands. It all started when Tata Finlay was set up as a joint venture between Tata Sons and the UK-based tea plantation company, James Finlay and Company in 1962. In 1983 Tata Tea was born after James Finlay sold his shareholding to Tata, heralding the beginning of a new journey. The company set out on a path with global ambitions, evidenced by the acquisition of Tetley in 2000. This was followed by a string of strategic acquisitions including Good Earth, Jemca, Vitax, Eight O’ Clock Coffee and Himalayan Water. Tata Global Beverages, the new name, adopted in April 2010, unites the beverage interests of Tata under one umbrella. It signals their global ambition, as well as marking the next logical step in their evolution from a history in plantations to becoming a marketing and brand focused organization with a portfolio of engaging and exciting strong consumer brands. Tata global operate in more than 70 countries through a number of subsidiaries and associate entities. Tata Global Beverages currently employs 3,000 people around the world but through partnerships, joint ventures and supply chains, many thousands more contribute to its business. The company’s annual turnover is US$1.7 billion (FY 2009/10) and it is the second largest player in tea in the world. Its global expansion is highlighted by the fact that over 65 per cent of the consolidated revenue originates from markets outside of India. The group maintains a strong focus on consumer brands; more than 90 per cent of turnover is delivered by its branded products. Over five years ago, nearly all the group’s turnover came from tea interests, but now the figure is nearer 71 per cent, underpinning its successful diversification strategy and giving it a leadership position in the ‘good for you’ beverage space.
  • 24. 24 Formerly known as Tata Tea, the business diversified and expanded significantly over the last decade. It recently opened its new corporate headquarters, located in the UK (Uxbridge, West London). The group is now making strong strides towards its mission of life enhancing sustainable hydration with the recent JV agreement with PepsiCo in the area of non carbonated ready-to-drink beverages, focused on health and enhanced wellness and the acquisition of a stake in Activate, a performance beverage and bottled water company in the United States. With innovation and excellence at the heart of everything it does, Tata Global Beverages has a stable of leading global and regional brands.  Tata Tea: Tata Tea is officially a ‘super brand’ in India, where it is the second most trusted hot beverage brand, thanks to national and regional brands – Tata Tea Premium, Kanan Devan, Chakra Gold, Agni, Gemini, Life and Tata Tea Gold.  Tetley: Acquired by Tata in 2000, Tetley is currently enjoyed in 70 countries worldwide and in close to 11 million UK homes. Tetley is a true leader in black tea, decaffeinated and red bush, with fast growing green tea and innovative tea infusions too. Currently market leader in the UK and Canada, the brand's strong innovation agenda includes the first launch of Extra Strong tea for a fuller flavor and Infusions, a liquid ‘Real Brew’ tea mix for water.  Good Earth: One of the first American herbal tea companies and a leader in specialty teas, Good Earth produces and markets fruit, medicinal, red, green, black, white and organic teas. Today, its premium teas and coffees, all with ‘green’ packaging are enjoyed across the US, Canada and the UK.  Vitax: A part of the Tata Global Beverages’ portfolio since 2007, this is a well- established fruit and herbal tea brand in Poland  Jemca: This is a market leading tea brand in the Czech Republic with a growing range of fruit and herbal, black and green teas  Tata Coffee: The well-known brands here include Mr Bean, Mysore Gold, Coorg Pure, Tata Cafe and Tata Kaapi. The coffees are grown on 19 estates in the southern states of India and produce about 10,000 tonnes of natural shade grown Arabica and Robusta coffees.
  • 25. 25  Eight O’Clock Coffee: This is the best-selling whole-bean coffee in the United States and the third-largest coffee brand by volume in the country.  Grand: Joining the Tata family in 2009, Grand is one of Russia’s leading umbrella beverage brands – known for its consistent quality, good value coffee, tea, cocoa, chocolate, green tea and iced tea products – all made using natural, environmentally friendly ingredients.  Himalayan Water: A brand that has been a part of Tata since 2007. The water is sourced directly from an underground aquifer located about 120 metres below the earth's surface in the Shivalik range of the Himalayas, and is bottled at the source.  T!on: A new ‘good for you’ cold beverage launched in India in 2008  SUKK: This is a brand new ‘jelly drink’ concept launched in the UK in 2010.  T4KIDZ: This caffeine-free hot beverage, specially blended for kids by Tetley in the UK, was launched in March 2010. COMPANY ANALYSIS RATIO ANALYSIS GROSS PROFIT RATIO: GP ratio evaluates the effectiveness of business in terms of its sales. Furthermore it indicates the efficiency of firm in terms of its production and how much profit it has gained from its exact business. However profitability can also be influenced by the liquidity needs of the organization.
  • 26. 26 GP ratio of TGB is showing a declining tendency. It reduced to 7.08% in 2011 from 17.54% in 2007. The global economic crisis contributed to the decline of gross profit as TGB’s 65% of revenue originates from markets outside India. OPERATING PROFIT RATIO: Operating profit ratio shows the operational efficiency of the business. Higher operating profit ratio shows higher operational efficiency and vice versa. There may be different ideal positions constituted by companies according to their internal requirements. The operating profit ratio is on positive move as the ratio touched 100% in 2009 despite the global crisis and was near to the same in the subsequent years. The ratio projects that the company is in good terms of operational efficiency to face the global competition. NET PROFIT RATIO: NP ratio is used to measure the overall profitability and hence it is very useful to proprietors.. This ratio also indicates the firm's capacity to face adverse economic conditions such as price competition, low demand, etc. The NP ratio shows that the company had been badly affected by the global financial crisis as its ratio declined from 29% in 2007 to 10% in 2011. However TGB made significant improvement in 2010 as the ratio touched 23%. The acquisition of Tetley in 2010 contributed for the revival of the ratio from 11.5% in 2009 to 23% in 2010. RETURN ON ASSETS Return on assets reveals the capacity of the company to earn profit with the assets employed. Despite the global crisis in 2008, TGB’s returns on assets were showing an increasing tendency. RETURN ON NETWORTH Return on networth shows the returns available to the equity shareholders of the company. Return on networth of TGB showed a better position impacted through the increase in its profits in 2010. However the ratio further showed a declining tendency in the subsequent years.
  • 27. 27 RETURN ON CAPITAL EMPLOYED ROCE of TBG is decreased from 20% in 2008 to 10% in 2011. However the company maintained momentum in 2010 with a ratio of 21% because of the acquisition of Tetley. CURRENT RATIO: This ratio is a general and quick measure of liquidity of a firm.. A relatively high current ratio is an indication that the firm is liquid and has the ability to pay its current obligations in time on the other hand, a relatively low current ratio represents that the liquidity position of the firm is not good. Hence the profitability and liquidity position of a company are inversely proportional. Current ratio of TGB is increasing by which it showed a reviving tendency to touch 1.5 in 2011. Here the company has good current ratio as it maintained it above 1 which indicates that company has enough cash to pay its current liabilities. QUICK RATIO: The quick ratio/acid test ratio is very useful in measuring the ease of liquidating the current assets of a firm to meet its financial obligations. It measures the firm's capacity to pay off current obligations immediately and is more rigorous test of liquidity than the current ratio. The ratios are showing the weaknesses of the company in terms of its capacity to liquidate its quick assets. The company in terms of liquidity showed a better position in 2009 and 2010 but declined in 2011.
  • 28. 28 STOCK TO CAPITAL RATIO Stock to capital ratio of TGB shows that the company started lessen of stocking of the goods as it declined to 2 in 2011 from 10 in 2007. This indicates that the company is having a good turnover position with regard to stock. FIXED ASSET TO CURRENT ASSETS RATIO: As both the companies are using capital-intensive techniques, they are in need of huge fixed assets. Fixed assets to current assets ratio measure the efficiency of the companies in maintaining its fixed assets in relation to its current assets. In terms of this ratio, TGB is maintaining less fixed assets in relation to its current assets. DEBT-EQUITY RATIO Debt to equity ratio indicates the proportionate claims of owners and the outsiders against the firm’s assets. The purpose is to get an idea of the cushion available to outsiders on the liquidation of the firm. However, the interpretation of the ratio depends upon the financial and business policy of the company. Debt to equity ratio of TGB shows that the company is making significant actions to increase the shareholder’s returns as the ratio declined from .5 in 2007 to .25 in 2011. FIXED ASSET RATIO: Measure of the solvency of a firm, this ratio indicates the extent to which the owners' cash is frozen in the form of brick and mortar and machinery, and the extent to which funds are available for the firm's operations.
  • 29. 29 As TGB’s is engaged in price war with the large-cap companies and the peers in mid-cap group, it aims to make significant progress in the returns. For that it maintained less fixed assets in relation to current assets. This is projected in the fixed asset ratio also and the company is maintaining less fixed assets in relation to the networth. PROPRIETORY RATIO: This ratio throws light on the general financial strength of the company. It is also regarded as a test of the soundness of the capital structure. Higher the ratio the better is the long-term solvency position of the company. A low proprietary ratio will include greater risk to the creditors. Proprietary ratio of TGB shows that the company is in a better position to meet the financial obligations to the outsiders. LONG TERM DEBT-EQUITY RATIO The company has not maintained large number of long term debt before its acquisition of Tetley. Acquisition of Tetley in 2010 effect the ratio as it comes to .25 in relation to the equity. But the company is in a position to safeguard the interest of the owners of the company. TOTAL CAPITAL TURNOVER RATIO TGB’s total capital turnover ratio is showing a growth in the company’s turnover in relation to it’s the total capital employed. This shows that the company is getting ready for a vast expansion.
  • 30. 30 DEBTORS TURNOVER RATIO: This ratio indicates the number of times the debtors are turned over a year. The higher the value of debtors turnover ratio the more efficient is the management of debtors or more liquid the debtors are. Similarly, low debtors turnover ratio implies inefficient management of debtors or less liquid debtors. It is the reliable measure of the time of cash flow from credit sales. There is no rule of thumb which may be used as a norm to interpret the ratio as it may be different from firm to firm. This ratio indicates that the company has continued to maintain the state even after acquiring Tetley which was valued higher than the acquiring company. FIXED ASSET TURNOVER RATIO: This ratio measures the efficiency and profit earning capacity of the concern. Higher the ratio, greater is the intensive utilization of fixed assets. Lower ratio means under-utilization of fixed assets. The ratios projects that the company has been continuously improving its capacity and the inference is that the shareholder’s funds are properly utilized. WORKING CAPITAL TURNOVER RATIO Since the company is a major player in the food beverages sector, the company needs to maintain large stock to outstand the peer companies. For that the company needs to maintain large number of working capital. But the large scale operations of TGB enabled the company to maintain less working capital because of the company’s capacity improvement in debtor turnover. STOCK TURN OVER RATIO: It measures the velocity of conversion of stock into sales. A low stock turnover ratio indicates an inefficient management of inventory and vice versa. The stock turnover ratio has not improved to impact the same in sales. TGB’s stock turnover ratio shows the inefficiency of the company in inventory management.
  • 31. 31 EPS: The earnings per share is a good measure of profitability and when compared with EPS of similar companies, it gives a view of the comparative earnings or earnings power of the firm. EPS ratio calculated for a number of years indicates whether or not the earning power of the company has increased. EPS of TGB shows that the company safeguarding the interest of the shareholders as it is showing an increasing tendency in the subsequent years of the economic crisis. EPS of 2011 shows a single digit figure because of the share split happened in 27 May 2010. P/E RATIO: Price earnings ratio helps the investor in deciding whether to buy or not to buy the shares of a particular company at a particular market price. Generally, higher the price earnings ratio the better it is for the company. If the P/E ratio falls, the management should look into the causes that have resulted into the fall of this ratio. P/E ratio of TGB is continuously growing a steady growth as it increased from 11.7 in 2007 to 33 in 2011. This indicates that the company can provide returns to those investors who are expecting high returns with intermediate risk. DIVIDEND PER SHARE: The company is distributing good dividends to the shareholders and nearly 30% of the profits are retained in the company. Despite the global economic crisis, the company has distributed good dividend to the equity shareholders of the company.
  • 32. 32 DIVIDEND PAYOUT RATIO: Dividend payout ratio is calculated to find the extent to which earnings per share have been used for paying dividend and to know what portion of earnings has been retained in the business. Around 70% of the profit is distributed to the equity shareholders of the company which shows that the company is a best destination for those investors who expect regular income along with capital appreciation. EARNINGS YIELD RATIO The company has showed a better state in the earnings yield when compared with the peers in the sector. PRICE TO SALES RATIO Price to Sales ratio looks at the current stock price in relation to the total sales per share. The Price to sales ratio of TGB reflects that the company’s market price is reviving in correlation with the sales PRICE TO BOOK VALUE RATIO Price to book value ratio is the measure that looks at the value of the market price of the company in relation to the book value of the company. Like the P/E, the lower the Price to book value ratio, the better the value for shareholders. In that sense TGB is doing a better job. PRICE TO CASHFLOW RATIO Price to cash flow ratio is a measure of the market's expectations of a firm's future financial health. This ratio deals with net cashflows from operations in relation to the market price of the stock where the effects of depreciation and other non-cash factors are removed. This ratio of TGB shows that there is a high positive correlation between the two factors namely market price and net cashflows from operations.
  • 33. 33 SWOT Analysis of TATA Global Beverages Strength  Brand name TATA  Product innovation  Portfolio of strong brands  Distribution network and promotional activities  2nd largest producer in the world in Tea segment Weakness  TGB’s brand perception as a tea company makes a stumbling block in venturing into new areas  Competition couldn’t adopt any strategy to defend its position  May not centre on a single product  Not able to increase its sales in expected manner Opportunities  Increasing disposable income  Major portion of the consolidated revenue originates from markets outside India  Subsidies and support from the government  Global presence within 70 countries  Opportunities to increase exports turnover  Diversification in the segment Threat  Competition  Seasonal fluctuations  Currency fluctuations
  • 34. 34 SHARE SPLIT Tata Global Beverage had last split the face value of its shares from Rs 10 to Rs 1 in 2010.The share has been quoting on an ex-split basis from June 30, 2010. The company had fixed July 02, 2010, as the record date for the purpose of sub-division of the existing equity shares of the company having the face value of Rs 10 per share into 10 equity shares having a face value of Re 1 each. Companies that went for stock splits have been getting a positive response on the bourses. It is believed that a sub-division of shares increase the demand for a scrip. Also, a split increases the outstanding shares and improves a stock’s liquidity. Considering its current valuation, the stock split in Tata Tea will certainly be good for retail investors. Trading volumes has increased more than six folds, with 3, 05,000 equity shares changing hands as against average 49,000 shares traded daily in two weeks before the split. BETA OF THE STOCK The beta for the company in relation with the Nifty index is calculated as .585. Since the beta is less than 1, it is considered as a less volatile and having a below average risk. -10.00 -8.00 -6.00 -4.00 -2.00 0.00 2.00 4.00 6.00 8.00 10.00 FMCG Nifty index TGB
  • 35. 35 INTRINSIC VALUE OF THE STOCK Intrinsic value is a measure of value based on the future earnings a company is expected to generate for its investors. It attempts to measure the total net assets a company is expected to build in the future. The intrinsic value of TGB is calculated by the financials of the year ended 31 March 2011. Estimated projections for the year ending 31 March 2012 to calculate the estimated EPS are as follows The above projections are made on the basis of certain assumptions. These assumptions are based on the average rate of the company for the past 5 years.
  • 36. 36  Net Sales increases by 18%  COGS remains as 70% of sales  Operating Expenses decreases by 5%  Interest increases by 8%  Depreciation decreases by 10%  Tax remains at 21% 1. Computation of Value Anchor: Value Anchor = Estimated EPS * Average P/E Ratio = 6.26 * 19.94 = 125 (approx) 2. Computation of Value Edge: Value Edge is the range of the share price which varies up or down 10% of Value anchor Up Value - 137.5 Down Value - 112.5 Market price of the stock on 31 March 2011 - 97.75 The value edge range lies between Rs 112.5 and 137.5 w tells us that in what price what can we do with the share.  The best buy price of the share will be less than 112.5  The best sell price of the share will be when it is more than 137.5  When the price is above 112.5 and below 137.5, it is better to hold the share.
  • 37. 37 CONCLUSION Since the intrinsic value 25% higher than the market price on 31 March 2011, investors can go for this as a safe investment. Investors who are risk averse but ready to take intermediate risk can invest in TGB stock because the stock is less volatile and showed a better stand when compared with the FMCG Nifty index. However there may be fluctuations in the price of stock with regard to market movement. Also TGB is a safe destination for those investors who want a regular return along with capital appreciation for their investment because the company has been continuously distributing an average of 65% of profits as dividends. Income fund managers can look at TGB to provide value for the unit holders. REFERENCES www.nseindia.com www.rbi.org finmin.nic.in www.mca.gov.in mospi.nic.in planningcommission.nic.in www.tataglobalbeverages.com
  • 38. 38