Classify Rice Disease Models with Edge Computing
•
0 likes•66 views

This document summarizes research on classifying rice diseases using self-optimizing machine learning models and edge computing. The researchers used an automated machine learning platform to build models for identifying 3 classes of rice diseases from images. They extracted features from the images using a deep learning network and then used those features to train traditional machine learning models like ExtraTrees Classifier and Stochastic Gradient Descent. The goal was to develop an end-to-end solution for rice farmers to easily and accurately detect diseases in the field and receive treatment recommendations in real-time.
![002
Agricultural Research & Technology: Open Access Journal
How to cite this article: Damian Mingle, Amit Kumar. Classify Rice Disease Using Self-Optimizing Models and Edge Computing with Agricultural
Implications. Agri Res & Tech: Open Access J. 2021; 25 (5): 556316. DOI: 10.19080/ARTOAJ.2021.25.556316
Rice supports more than half the world’s population as
a primary food source [1]. The quality and quantity of rice
production are significantly affected by rice disease. In general,
identification of rice disease is made by visual observation of
experienced producers in the field. This method requires constant
surveillance from manual labor, which could be prohibitively
expensive for large farms. However, with the advances in image
processing and pattern recognition, a cost-effective method for
disease identification is demonstrated. Advances in research
continue on image processing and pattern recognition as a
result of innovations with digital cameras and the increase in
computational capacity. These tools have been effectively applied
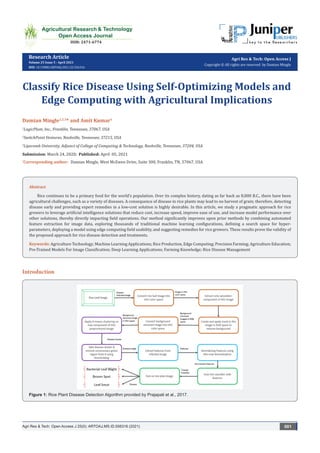
in many areas [2-5]. Prajapati et al., [6] developed a rice plant
disease classification system after detailed experimental analysis
of various techniques. Four techniques of background removal and
three techniques of segmentation were empirically evaluated. It
was proposed for accurate feature extraction, a centroid feeding-
based K-means clustering for segmentation of disease from a
leaf image was necessary. The output from K-means clustering
was enhanced by removing green pixels in the disease portion.
Additional feature extraction was done under three categories:
(1) color, (2) shape, and (3) texture. Ultimately, Support Vector
Machines was chosen to perform a multiclass classifier (Figure 1).
Generally, rice growers identify plant disease through leaves as
the first source. This can be detected automatically using comput-
er vision techniques. Until now, there have been several research-
ers who have conducted experiments with very little utility for
rice farms. Considerations for farmers are cost, speed, ease of use,
model performance, and direct impact on the field. There has been
little attention to structuring a useful machine learning approach
that is end-to-end in agriculture. Previous investigations have suc-
cessfully demonstrated the potential of deep learning algorithms
in plant disease detection; yet, the cost associated with such archi-
tecture makes this unattainable for many rice growers. The length
of training time required for such deep learning models has histor-
ically been lengthy, and specialty hardware is needed. Additional-
ly, the expertise necessary to maintain and optimize deep learning
network hyper-parameters, such as (a) a comparison of activation
functions like ReLU, Sigm, and Tanh, (b) learning rate, (c) quantity
of neurons per layer, (d) quantity of hidden layers, and (e) dropout
regularization remains unrealistic. Much of the research to date
has been concerned with many pre-processing steps and augmen-
tation techniques for images to maximize model performance: (a)
resize images, (b) denoise, (c) segmentation, and (d) morphology.
In almost all the research, model performance has suffered from
over-fitting, evidenced by high accuracy scores for training sets
but significantly lower accuracy for validation sets.
Given that growers value more what is likely to happen in
day-to-day utilization, the emphasis on a practical solution sug-
gests validation scores matter more than training scores. It will
measure how well a solution performs. Lastly, there is little to no
connection between identifying plant disease and what action rice
farms should do next to experience the benefit of an algorithm
detecting a plant disease early. In this work, we studied the ben-
efits of crafting an end-to-end solution for rice farmers using an
automated machine learning platform with the aim of building a
production-grade solution for agriculture that provides real-time
decision support for rice farms. We combine several methods,
namely, employing automated feature extraction for image data,
exploring thousands of possible traditional machine learning con-
figurations, defining a search space for hyper-parameters, deploy-
ing a model built for edge computing for field usability, and sug-
gesting remedies for rice growers. This journal article comprises
the following sections: methods and materials, results, discussion,
and conclusion.
Methods and Materials
Data Acquisition
The dataset contains 120 jpeg images of disease-infected rice
leaves. There are 3 classes of images based on the type of disease,
each containing 40 images, and captured with a NIKON D90 dig-
ital SLR camera with 12.3 megapixels. This dataset was curated
by the research team at the Department of Information Technol-
ogy, Dharmsinh Desai University, and is made publicly available.
The authors gathered these leaves from a rice field in a village
called Shertha in Gujarat, India, and in consultation with farmers,
grouped the leaves into the aforementioned-diseases categories
(Figure 2).
Figure 2: Three different rice disease classes contained in an image database.](data:image/gif;base64,R0lGODlhAQABAIAAAAAAAP///yH5BAEAAAAALAAAAAABAAEAAAIBRAA7)
Recommended
Recommended
More Related Content
What's hot
What's hot (20)
Similar to Classify Rice Disease Models with Edge Computing
Similar to Classify Rice Disease Models with Edge Computing (20)
More from Damian R. Mingle, MBA
More from Damian R. Mingle, MBA (13)
Recently uploaded
Recently uploaded (20)
Classify Rice Disease Models with Edge Computing
- 1. Classify Rice Disease Using Self-Optimizing Models and Edge Computing with Agricultural Implications Damian Mingle1,2,3 * and Amit Kumar1 1 LogicPlum, Inc., Franklin, Tennessee, 37067, USA 2 SwitchPoint Ventures, Nashville, Tennessee, 37215, USA 3 Lipscomb University, Adjunct of College of Computing & Technology, Nashville, Tennessee, 37204, USA Submission: March 24, 2020; Published: April 05, 2021 * Corresponding author: Damian Mingle, West McEwen Drive, Suite 300, Franklin, TN, 37067, USA Agri Res & Tech: Open Access J 25(5): ARTOAJ.MS.ID.556316 (2021) 001 Research Article Volume 25 Issue 5 - April 2021 DOI: 10.19080/ARTOAJ.2021.25.556316 Agri Res & Tech: Open Access J Copyright © All rights are reserved by Damian Mingle Introduction Figure 1: Rice Plant Disease Detection Algorithm provided by Prajapati et al., 2017. Abstract Rice continues to be a primary food for the world’s population. Over its complex history, dating as far back as 8,000 B.C., there have been agricultural challenges, such as a variety of diseases. A consequence of disease in rice plants may lead to no harvest of grain; therefore, detecting disease early and providing expert remedies in a low-cost solution is highly desirable. In this article, we study a pragmatic approach for rice growers to leverage artificial intelligence solutions that reduce cost, increase speed, improve ease of use, and increase model performance over other solutions, thereby directly impacting field operations. Our method significantly improves upon prior methods by combining automated feature extraction for image data, exploring thousands of traditional machine learning configurations, defining a search space for hyper- parameters, deploying a model using edge computing field usability, and suggesting remedies for rice growers. These results prove the validity of the proposed approach for rice disease detection and treatments. Keywords: Agriculture Technology; Machine Learning Applications; Rice Production, Edge Computing; Precision Farming; Agriculture Education; Pre-Trained Models For Image Classification; Deep Learning Applications; Farming Knowledge; Rice Disease Management
- 2. 002 Agricultural Research & Technology: Open Access Journal How to cite this article: Damian Mingle, Amit Kumar. Classify Rice Disease Using Self-Optimizing Models and Edge Computing with Agricultural Implications. Agri Res & Tech: Open Access J. 2021; 25 (5): 556316. DOI: 10.19080/ARTOAJ.2021.25.556316 Rice supports more than half the world’s population as a primary food source [1]. The quality and quantity of rice production are significantly affected by rice disease. In general, identification of rice disease is made by visual observation of experienced producers in the field. This method requires constant surveillance from manual labor, which could be prohibitively expensive for large farms. However, with the advances in image processing and pattern recognition, a cost-effective method for disease identification is demonstrated. Advances in research continue on image processing and pattern recognition as a result of innovations with digital cameras and the increase in computational capacity. These tools have been effectively applied in many areas [2-5]. Prajapati et al., [6] developed a rice plant disease classification system after detailed experimental analysis of various techniques. Four techniques of background removal and three techniques of segmentation were empirically evaluated. It was proposed for accurate feature extraction, a centroid feeding- based K-means clustering for segmentation of disease from a leaf image was necessary. The output from K-means clustering was enhanced by removing green pixels in the disease portion. Additional feature extraction was done under three categories: (1) color, (2) shape, and (3) texture. Ultimately, Support Vector Machines was chosen to perform a multiclass classifier (Figure 1). Generally, rice growers identify plant disease through leaves as the first source. This can be detected automatically using comput- er vision techniques. Until now, there have been several research- ers who have conducted experiments with very little utility for rice farms. Considerations for farmers are cost, speed, ease of use, model performance, and direct impact on the field. There has been little attention to structuring a useful machine learning approach that is end-to-end in agriculture. Previous investigations have suc- cessfully demonstrated the potential of deep learning algorithms in plant disease detection; yet, the cost associated with such archi- tecture makes this unattainable for many rice growers. The length of training time required for such deep learning models has histor- ically been lengthy, and specialty hardware is needed. Additional- ly, the expertise necessary to maintain and optimize deep learning network hyper-parameters, such as (a) a comparison of activation functions like ReLU, Sigm, and Tanh, (b) learning rate, (c) quantity of neurons per layer, (d) quantity of hidden layers, and (e) dropout regularization remains unrealistic. Much of the research to date has been concerned with many pre-processing steps and augmen- tation techniques for images to maximize model performance: (a) resize images, (b) denoise, (c) segmentation, and (d) morphology. In almost all the research, model performance has suffered from over-fitting, evidenced by high accuracy scores for training sets but significantly lower accuracy for validation sets. Given that growers value more what is likely to happen in day-to-day utilization, the emphasis on a practical solution sug- gests validation scores matter more than training scores. It will measure how well a solution performs. Lastly, there is little to no connection between identifying plant disease and what action rice farms should do next to experience the benefit of an algorithm detecting a plant disease early. In this work, we studied the ben- efits of crafting an end-to-end solution for rice farmers using an automated machine learning platform with the aim of building a production-grade solution for agriculture that provides real-time decision support for rice farms. We combine several methods, namely, employing automated feature extraction for image data, exploring thousands of possible traditional machine learning con- figurations, defining a search space for hyper-parameters, deploy- ing a model built for edge computing for field usability, and sug- gesting remedies for rice growers. This journal article comprises the following sections: methods and materials, results, discussion, and conclusion. Methods and Materials Data Acquisition The dataset contains 120 jpeg images of disease-infected rice leaves. There are 3 classes of images based on the type of disease, each containing 40 images, and captured with a NIKON D90 dig- ital SLR camera with 12.3 megapixels. This dataset was curated by the research team at the Department of Information Technol- ogy, Dharmsinh Desai University, and is made publicly available. The authors gathered these leaves from a rice field in a village called Shertha in Gujarat, India, and in consultation with farmers, grouped the leaves into the aforementioned-diseases categories (Figure 2). Figure 2: Three different rice disease classes contained in an image database.
- 3. How to cite this article: Damian Mingle, Amit Kumar. Classify Rice Disease Using Self-Optimizing Models and Edge Computing with Agricultural Implications. Agri Res & Tech: Open Access J. 2021; 25 (5): 556316. DOI: 10.19080/ARTOAJ.2021.25.556316 003 Agricultural Research & Technology: Open Access Journal LogicPlum As part of our research and analysis, we opted to use an A.I. in- novation platform named LogicPlum. LogicPlum includes a library of proprietary and open-source model types, including linear, non-linear, and deep learning approaches [7]. While manual in- terventions are possible during model development, in this study, the autonomous model builder was used; specifically, the platform was provided only with the original data images, and it decided appropriate configurations for machine learning models automat- ically. Additionally, we chose two different autonomous run types within the LogicPlum platform. The first was Rapid mode, which is designed for model development under 5 minutes. We also used Intensive mode, which is intended for model development that allows for an undefined time but stops after several rounds of non-improvement with a given model evaluation metric. The software considers several families of algorithms and ranks them according to model performance based on the machine learning task. Lastly, a combination of base models is automatically evalu- ated, and a subsequent composite model is tested for increased lift before a final solution. Deep Learning for Computer Vision Within research, education, and industry applications, the most essential step in a computer vision process is to extract fea- tures from the images in a dataset. In this context, a feature is a tangible piece of information about a given image, such as color, line, edges, etc. A model needs to observe in order to learn the characteristics of a given image and thereby classify it correctly. Traditional machine learning approaches allow for several dif- ferent feature extraction methods, which require manual feature selection and engineering. This process relies heavily on domain knowledge, both in computer vision and rice plant disease, to cre- ate model inputs that make machine learning algorithms work better. To increase speed to market for the solution and eliminate the need for expertise in machine learning and plant pathology, we explored automatically extracting features using deep learn- ing. The network automatically extracts features and learns their importance based on the output by applying weights to its connec- tions. In practice, an individual feeds the raw image to the network and, as it passes through the network layers, the network identi- fies patterns within the image to create features. Figure 3: Microarcitecural view: Organization of convolution filters in the fire module. We illustrate the convolution filters only. Figure 4: Image featurizer becomes model inputs for ExtraTrees Classifier. We use the SqueezeNet network to extract features from the images. SqueezeNet is a lightweight architecture that is extreme- ly useful in low bandwidth scenarios like mobile platforms and has ImageNet accuracy similar to AlexNet, the convolution neural network that began the deep learning revolution in 2012 (Figure 3). The first layer demonstrates that the first layer is a squeeze layer comprised of a 1×1 convolution that reduces the amount of channels, for example, from 64 to 16 in each image. The squeeze layer aims to compress the data so that the 3×3 convolution does not need to learn so many parameters. This is followed by an ex- pand block with two parallel convolution layers: one with a 1×1 kernel, the other with a 3×3 kernel. These convolution layers also
- 4. 004 Agricultural Research & Technology: Open Access Journal How to cite this article: Damian Mingle, Amit Kumar. Classify Rice Disease Using Self-Optimizing Models and Edge Computing with Agricultural Implications. Agri Res & Tech: Open Access J. 2021; 25 (5): 556316. DOI: 10.19080/ARTOAJ.2021.25.556316 increase the quantity of channels again, from 16 back to 64. Their outputs are joined together so the output of this fire module has 128 channels overall. SqueezeNet has 8 of these Fire modules in succession, sometimes with max-pooling layers between them. There are zero fully-connected layers. At the end of the process is a convolution layer that performs the classification, followed by the global average [8] (Figure 4). Determined Architecture with Rapid Mode Modeling with ExtraTrees Figure 5: Stochastic Gradient Descent rice plant disease predictions become model inputs for Gaussian Naive Bayes Classifier. ExtraTrees Classifier was selected as the top performer. This classifier fits many randomized decision trees on numerous sub-samples of the dataset and uses averaging to enhance the pre- dictive accuracy and control over-fitting. ExtraTrees is considered a perturb-and-combine technique specifically designed for trees. Effectively this means that a diverse set of classifiers is designed by introducing randomness in the classifier construction. The pre- diction of the collection of weak learners is given as the averaged prediction of the individual classifiers (Figure 5). Determined Architecture with Autonomous Mode For a composite model to outperform base models, some sam- ples must be better predicted by one model, and other samples by another model. Stacking is an ensemble learning technique to bring together multiple classification models via a meta-classifi- er [9]. LogicPlum extends the standard stacking algorithm using cross-validation to arrange the input data for the level-2 classifier. In the usual stacking procedure, the first-level classifiers fit the same training set used to arrange the inputs for the level-2 classifier, which may lead to overfitting. However, the LogicPlum approach uses the concept of cross-validation: the dataset is split into k-folds, and in k successive sequences, k-1 folds are used to fit the first level classifier. The first-level classifiers are then utilized on the remaining 1 subset that was not used for model fitting in each iteration in each round. The resulting predictions are then stacked and provided – as input data – to the second-level clas- sifier. After the training of the StackedCVClassifier, the first-level classifiers are fit to the entire dataset, as illustrated in the figure below. More formally, the Stacking Cross-Validation algorithm can be summarized as follows: (Table 1) Table 1: Algorithmic steps for a Cross-Validated Stacked classifier inspired by Wolpert, 1992. Algorithm Stacking with K-fold Cross Validation Input : Training data } ^ { , ( 1 m D x y x i i i R n i i y Y = ∈ = ∈ Output : An ensemble classifier H 1 : Adopt cross-validation approach in preparing a training set for second-level classifier 2 : Randomly split D into equal-size subsets: { , ,...., } 1 2 D D D Dk = 3 : for 1 k ← to K do 4 : Step 1.1: Learn first-level classifiers 5 : for 1 t ← to T do 6 : Learn a classifier hkt form D Dk 7 : end for 8 : Step 1.2 Construct a training set for second-level classifier 9 : for x D i k ∈ do 10 : Get a record ' { , } x y i i where ' { ( ), ( ),..., ( )} 1 2 x h x h x h x i i i i k k kt = 11 : end for 12 : end for 13 : Step 2: Learn a second-level classifier
- 5. How to cite this article: Damian Mingle, Amit Kumar. Classify Rice Disease Using Self-Optimizing Models and Edge Computing with Agricultural Implications. Agri Res & Tech: Open Access J. 2021; 25 (5): 556316. DOI: 10.19080/ARTOAJ.2021.25.556316 005 Agricultural Research & Technology: Open Access Journal 14 : Learn a new classifier from the collection of ' { , } x y i i 15 : Step 3: Re-learn first level classifiers 16 : for 1 t ← to T do 17 : Learn a classifier ht based on D 18 : end for 19 : return ' ( ) ( ( ), ( ),..., ( ) 1 2 H x h h x h x h x T = Modeling with Stochastic Gradient Descent Figure 6: Flow diagram of Stacked Cross-Validation Algorithm. This estimator applies regularized linear models with sto- chastic gradient descent learning; the loss’s gradient is estimated each sample at a time. The model is revised along the way with a decreasing learning rate [10]. This implementation makes use of data represented as dense or sparse arrays of floating-point val- ues for the features (Figure 6). The model it fits can be monitored with the loss parameter; by default, it fits a linear support vector machine. The regularizer is a consequence added to the loss func- tion that shrinks model parameters in the direction of the zero vector using the squared Euclidean norm (L2), the absolute norm (L1), or a mixture of both (Elastic Net). Many hyperparameters were considered in optimizing for the Stochastic Gradient Descent Classifier. The constant that multiplies the regularization term, alpha, is set to 0.0001. In general, the higher the value, the stron- ger the regularization. We did not compute the average Stochastic Gradient Descent weights across all updates and therefore did not store the results as coefficients. We did not set class weights, and thus, all classes are assigned to a weight of one. Early stopping was not engaged, forcing us to not terminate training when validation scores did not improve. The initial learning rate set was 1.0. We did not assume the data was already centered, and chose to es- timate the intercept. We used a squared hinge loss function that is equivalent to Support Vector Classification, but is quadratically penalized. For the exponent for inverse scaling learning rate, we used a power_t =0.1. We set the maximum number of passes over the training data to be 1,000. The L1 ratio is defined with a range of 0 to 1, and we set it to 1.0. We used Elastic Net as the penal- ty term, which brought sparsity to the model. The learning rate schedule used was inverse scaling,
- 6. 006 Agricultural Research & Technology: Open Access Journal How to cite this article: Damian Mingle, Amit Kumar. Classify Rice Disease Using Self-Optimizing Models and Edge Computing with Agricultural Implications. Agri Res & Tech: Open Access J. 2021; 25 (5): 556316. DOI: 10.19080/ARTOAJ.2021.25.556316 ( ) 0 _ eta t power t t η = Where 0 eta and _ power t t are hyperparameters chosen by LogicPlum. Modeling with Gaussian Naïve Bayes We implemented the Gaussian Naïve Bayes algorithm for clas- sification. The likelihood of the features is believed to be Gaussian: 2 ( ) 1 ( | ) exp( ) 2 2 2 2 x uy i p x y i y y σ πσ − = − Where the parameters y σ and y µ are estimated using max- imum likelihood. The classes’ prior probabilities were not specified as part of our experiment and therefore were not adjusted according to the data. It was determined that variable smoothing should be 1e-9, which was the most considerable variance of all features added to variances for calculation stability. Connected to farmers for usability Results Evaluation Metrics We use a ground-truth-based approach to compare the results of various machine learning models. Ground truth is a term used in multiple fields to refer to the information provided by direct observation instead of the information provided by inference. We understood the machine learning task to be a multiclass classi- fication problem that could be realized in a binary classification model framework. The model results were compared concerning the ground truth as follows: Given the definitions of terms within table 2, we can generate standard evaluation metrics for machine learning classification models: Table 2: Definition of terms. Term Definition True Positive (TP) Items where the true label is positive and whose class is correctly predicted to be positive. False Positive (FP) Items where the true label is negative and whose class is incorrectly predicted to be positive. False Negative (FN) Items where the true label is positive and whose class is incorrectly predicted to be negative. True Negative (TN) Items where the true label is negative and whose class is correctly predicted to be negative. Accuracy is defined as the number of items correctly identified as either true positive or true negative out of the total number of items. Mathematically described as, ( ) ( ) TP TN TP TN FP FN + + + + Recall is defined as the number of items correctly identified as positive out of the total actual positives. Mathematically described as, ( ) ( ) TP TP FN + Precision is defined as the number of items correctly identi- fied as positive out of the total items identified as positive. Mathe- matically described as, ( ) ( ) TP TP FP + F1 score is defined as the harmonic average of precision and recall, measures the effectiveness of identification when just as much significance is given to recall as to precision. Mathematical- ly, described as, (2* ) ( ) precision precision Recall + Macro Average computes the metric independently for each class then averages the results. Mathematically, described as, Pr Pr ... Pr 1 2 Pr k macro k + + + = Weighted average weights are calculated by the frequency of a class. Mathematically, described as, #0 #0 #0 1 2 Pr ... Pr bs bs bs k weighted macro k N N N = + + + − LogicPlum randomly selected 30 images from each class and formed a training dataset of 90 images. The remaining 30 images were portioned as a test set. The data in both train and test con- sisted of 513 features (Table 3).
- 7. How to cite this article: Damian Mingle, Amit Kumar. Classify Rice Disease Using Self-Optimizing Models and Edge Computing with Agricultural Implications. Agri Res & Tech: Open Access J. 2021; 25 (5): 556316. DOI: 10.19080/ARTOAJ.2021.25.556316 007 Agricultural Research & Technology: Open Access Journal Table 3: Rapid results model (2 minutes). Disease Type Precision Recall F1 Score Support Bacteria Leaf Blight 0.875 1 0.933 14 Brown Spot 0.882 1 0.938 15 Leaf Smut 1 0.636 0.778 11 Accuracy 0.9 40 Macro Avg 0.919 0.879 0.883 40 Weighted Avg 0.912 0.9 0.892 40 Model Performance Statistics Our primary evaluation metric for model performance was ac- curacy. We observed accuracy of 0.90 across all rice plant disease classifications on the Rapid model’s validation dataset. Recall, as it relates to Leaf Smut, is the lowest secondary evaluation metric for model performance. This measure aims to answer the ques- tion, “What proportion of actual positives was identified correct- ly?” In the context of the Intensive model, which was completed in 60 minutes, we observed accuracy of 92.5% across all rice disease classes. However, the lowest secondary measure is recall as it re- lates to Leaf Smut (Table 4). Table 4: Intensive results model (60 minutes). Disease Type Precision Recall F1 Score Support Bacteria Leaf Blight 0.824 1 0.903 14 Brown Spot 1 0.933 0.966 15 Leaf Smut 1 0.818 0.9 11 Accuracy 0.925 40 Macro Avg 0.941 0.917 0.923 40 Weighted Avg 0.938 0.925 0.926 40 To completely evaluate the effectiveness of a model, we must examine both precision and recall. Precision and recall are often in tension. That is, improving precision typically reduces recall and vice versa. Thus, many machine learning practitioners rely on the F1 score, which combines the effects of both precision and recall. An F1 score is considered perfect if it reaches 1.0. When compar- ing the F1 score from both the Rapid and Intensive mode, we can observe that the Intensive mode does significantly better at classi- fying Leaf Smut than the Rapid mode, with a 15.68% increase. It is worth noting that while the Intensive mode is superior in almost every respect, it does show a percentage decrease of 3.21% when considering the F1 score for Bacterial Leaf Blight. Confusion Matrix Below are the confusion matrices for both models. Table 5: Confusion matrix for LogicPlum Rapid mode.
- 8. 008 Agricultural Research & Technology: Open Access Journal How to cite this article: Damian Mingle, Amit Kumar. Classify Rice Disease Using Self-Optimizing Models and Edge Computing with Agricultural Implications. Agri Res & Tech: Open Access J. 2021; 25 (5): 556316. DOI: 10.19080/ARTOAJ.2021.25.556316 Table 5 illustrates where the Rapid mode made incorrect pre- dictions: Leaf Smut for the True Class should be 11, and instead we have 7. We incorrectly classified 4 Leaf Smut cases as Bacteri- al Leaf Blight in two instances and Brown Spot in the remaining instances (Table 6). In the case of the Intensive mode, there was misclassification that occurs in two classes, Brown Spot and Leaf Smut. However, the total misclassification rate for Intensive was lower by 25% over Rapid mode. Additionally, Bacterial Leaf Blight offered new improvement, and Brown Spot created some minor confusion for the Intensive mode. Table 6: Confusion matrix of LogicPlum Intensive mode. Comparative Accuracy of Models Our experiment was conducted in LogicPlum cloud and only leveraged a CPU configuration. As seen in Table 4, we achieve test accuracy of 90% with the Rapid results model, whereas with the Intensive results model, accuracy goes up to 92.5%. Barring one image, all the test images belonging to Bacteria Leaf Light and Brown Spot are correctly classified. Discussion Summary of conclusions: This paper proposed two new approaches for detecting dis- ease in rice plants, Rapid mode and Intensive mode, using a mea- ger number of images for training a classifier. We provide an in- depth analysis of our methods, which outperform the original paper results on the same dataset with significantly fewer ma- chine learning techniques. Future work involves exploring the edge computing capabilities of these methods. Relation to other results We achieved 90.0% on the test dataset with Rapid mode, which builds the A.I. solution from data upload to prediction with- in 2 minutes. Additionally, we achieved 92.5% accuracy on the test dataset, which has a training time that completes within 60 min- utes. Both approaches increase detection accuracy for rice plant disease over the prior research, which achieved 73.33% accuracy on the dataset [6]. As it relates to model performance, the Rapid mode exhibits a 22.73% increase over the prior research, while the Intensive mode demonstrates a 26.14% percent increase. Furthermore, we reduced the number of technical steps taken by practitioners in the preceding study, from 11 steps to 5 steps in the case of Rapid mode, and 6 steps in the Intensive mode—a 54.54% and 45.45% decrease, respectively, over the prior research (Figure 7). Figure 7: Model performance by approach to identify bacterial leaf blight, brown spot, and leaf smut within rice plants.
- 9. How to cite this article: Damian Mingle, Amit Kumar. Classify Rice Disease Using Self-Optimizing Models and Edge Computing with Agricultural Implications. Agri Res & Tech: Open Access J. 2021; 25 (5): 556316. DOI: 10.19080/ARTOAJ.2021.25.556316 009 Agricultural Research & Technology: Open Access Journal Prior methods This paper evaluated four techniques of background removal by applying masks generated based on the following: (1) original image, (2) hue component values of the image in HSV color space, (3) value components of the image in HSV color space, and finally (4) saturation component values of the image in HSV color space. Three techniques of segmentation were utilized: (1) LAB color space based K-means clustering, (2) Otsu’s segmentation tech- nique, and (3) HSV color space based K-means clustering. Using various features under three categories: color, texture, and shape, the authors extracted 88 features from the disease portion of a leaf image. Finally, the paper used Support Vector Machines with Gaussian kernel for multiclass classification of the leaf images. Implications Edge computing for smartphone users Edge computing has the capability to address the concerns of bringing machine learning approaches to the farming fields. Spe- cifically, edge computing deals with response time requirements, battery life consumption, bandwidth cost savings, and data safety and privacy. Edge computing is at the center of several IoT agricul- tural applications, such as pest identification, safety traceability of farm products, unmanned agrarian machinery, agrarian tech- nology promotion, and in this case, classifying diseases from the images of rice leaves purely because of its speed and efficiency compared to the cloud infrastructure. It offers a potentially tracta- ble model for mainstreaming smart agriculture [11]. Agriculture IoT systems can make informed decisions in the field when using edge computing [12]. We propose an approach that allows for access to our A.I. solution without an internet connection in the field. Figure 8 (A) illustrates the process of a farmer in a field who needs access to rice plant disease classification via her smartphone and does not have access to a network connection. The farmer can make use of the classification algorithm as it is embedded on the phone. (B) demonstrates that the trained model is converted to a LogicPlum Lite file type, which is how the model becomes executable on a mobile phone device. Figure 8.C exemplifies the concept of return- ing to a location that supplies network connection, and a transfer occurs. If an update exists, then an update is made available. Figure 8: Process makes rice plant disease detection available at the edge of the network and allows for intelligent updates when available. Borrowing knowledge from plant experts Making expert plant knowledge readily available to farmers in the field promises a meaningful impact. Edge computing allows farmers with a mobile app to capture the image of infected rice leaf and classify the disease, thereby greatly reducing the need for con- sultation with plant pathologists, which can be a time-consuming process. Furthermore, once a condition is detected, appropriate expert measures can be applied with various management strate- gies, namely preventive methods, cultural methods, and chemical methods (Figure 9). The Next Action Model is built on a concept of just-in-time learning, which meets farmers where they are instead of requiring structured education to form concept knowledge. The advent of our machine learning approach, coupled with edge com- puting and remedies for specific management strategies of rice plant disease, shifts farming further into the 21st century. Many education areas have evolved into a self-paced process of finding information or learning skills exactly when and where they are needed, and farming is no different. Our approach offers flexible delivery of learning to farmers with an “anytime, anyplace” frame- work. This approach allows farmers to independently access in- formation from plant pathology databases in the context of what they observe within their environment. This approach is linked to the idea of lifelong learning, learner-driven learning, and proj- ect-based learning. We have organized expert remedies for each of the three rice disease classes we analyzed: Rice Leaf Blight, Brow Spot, and Leaf Smut. According to Tamil Naud Agricultural Univer- sity, each of these rice diseases has three management strategies categorized as preventive, cultural, and chemicall (Tables 8-14).
- 10. 0010 Agricultural Research & Technology: Open Access Journal How to cite this article: Damian Mingle, Amit Kumar. Classify Rice Disease Using Self-Optimizing Models and Edge Computing with Agricultural Implications. Agri Res & Tech: Open Access J. 2021; 25 (5): 556316. DOI: 10.19080/ARTOAJ.2021.25.556316 Figure 9: Rice farmers can capture images of suspected rice disease and have an expert system classify the disease. Additionally, once the classification is made available, remedies for preventive, cultural, and chemical methods are presented in real-time. Table 7: The contents of preventive methods for rice leaf blight were created by Tamil Nadu Agricultural University. Methods Category Actions Preventive – Rice Leaf Blight Seed treatment with bleaching powder (100g/l) and zinc sulfate (2%) reduces bacterial blight. Seed treatment - seed soaking for 8 hours in Agrimycin (0.025%) and wettable ceresan (0.05%) followed by hot water treatment for 30 min at 52-54oC Seed soaking for 8 hours in ceresan (0.1%) and treat with Streptocyclin (3g in 1 liter) Spray neem oil 3% or NSKE 5% Spray fresh cow dung extract for the control of bacterial blight. Dissolve 20 g cow dung in one liter of water; allow to settle and sieve. Use supernatant liquid. (starting from the initial appearance of the disease and another at fortnightly interval) Table 8: The contents of cultural methods for rice leaf blight were created by Tamil Nadu Agricultural University. Methods Category Action Cultural – Rice Leaf Blight Grow Tolerant varieties (I.R. 20 I.R. 72,PONMANI , TKM 6). Secure disease-free seed. Grow nurseries preferably in isolated upland conditions. Avoid clipping of seedlings during transplanting. Balanced fertilization, avoid excess N – application. Skip N - application at booting (if the disease is moderate). Drain the field (except at the flowering stage of the crop). Destruction of weeds and collateral hosts. Avoid flow of water from affected fields. Maintain proper plant spacing. Table 9: The contents of chemical methods for rice leaf blight were created by Tamil Nadu Agricultural University. Methods Category Action Chemical – Rice Leaf Blight Reduce bacterial leaf blight by seed treatment with bleaching powder (100g/l) and zinc sulfate (2%). Seed treatment - seed soaking for 8 hours in Agrimycin (0.025%) and wettable ceresan (0.05%) followed by hot water treatment for 30 min at 52-54oC. seed soaking for 8 hours in ceresan (0.1%) and treat with Streptocyclin (3g in 1 liter). Spray Streptomycin sulphate + Tetracycline combination 300 g + Copper oxychloride 1.25kg/ha. If necessary repeat 15 days later. Application of bleaching powder @ 5 kg/ha in the irrigation water is recommended in the kresek stage. Foliar spray with copper fungicides alternatively with Strepto-cyclin (250 ppm) to check secondary spread.
- 11. How to cite this article: Damian Mingle, Amit Kumar. Classify Rice Disease Using Self-Optimizing Models and Edge Computing with Agricultural Implications. Agri Res & Tech: Open Access J. 2021; 25 (5): 556316. DOI: 10.19080/ARTOAJ.2021.25.556316 0011 Agricultural Research & Technology: Open Access Journal Table 10: The contents of preventive methods for rice brown smut were created by Tamil Nadu Agricultural University. Methods Category Actions Preventive – Rice Smut Utilize disease-free seeds that are selected from a healthy crop. Seed treatment with carbendazim 2.0g/kg of seeds. Control insect pests. Split application of nitrogen is recommended. Removal and proper disposal of infected plant debris. Table 11: The contents of cultural methods for rice smut spot were created by Tamil Nadu Agricultural University. Methods Category Actions Cultural Methods – Rice Smut Among the cultural control, the destruction of straw and stubble from infected plants is recommended to reduce the disease. Use varieties that are found to be resistant or tolerant against the disease in India. Avoid field activities when the plants are wet. Early planted crop has less smut balls than the late crop. When harvesting, diseased plants should be removed and destroyed so that sclerotia does not fall in the field. This will reduce the primary inoculum for the next crop. Field bunds and irrigation channels should be kept clean to eliminate alternate hosts. Excess application of nitrogenous fertilizer should be avoided. Regular monitoring of disease incidence during rabi season is very essential. Proper destruction of straw and stubble. Table 12: The contents of chemical methods for rice smut spot were created by Tamil Nadu Agricultural University. Methods Category Actions Chemical Methods – Rice Smut Spraying either copper oxychloride at 2.5 g/liter or Propiconazole at 1.0 ml/liter at boot leaf and milky stages will help prevent the fungal infection. Seed treatment with carbendazim 2.0g/kg of seeds. At tillering and pre-flowering stages, spray Hexaconazole @ 1ml/lit or Chlorothalonil 2g/lit. In areas where the disease may cause yield loss, applying captan, captafol, fentin hydroxide, and mancozeb can be inhibited by conidial germination. At tillering and pre-flowering stages, spraying of carbendazim fungicide and copper base fungicide can effectively control the disease. Table 13: The contents of preventive methods for rice brown spot were created by Tamil Nadu Agricultural University. Methods Category Actions Preventive – Rice Brown Spot Seed treatment with Pseudomonas fluorescens @ 10g/kg of seed followed by seedling dip @ of 2.5 kg or products/ ha dissolved in 100 liters and dipping for 30 minutes. seed soak/seed treatment with Captan or Thiram at 2.0g /kg of seed Seed treatment with Agrosan or Ceresan 2.5 g/kg seed to ward off seedling blight stage Since the fungus is seed transmitted, a hot water seed treatment (53-54°C) for 10-12 minutes may be effective be- fore sowing. This treatment controls primary infection at the seedling stage. Presoaking the seed in cold water for 8 hours increases effectivity of the treatment.
- 12. 0012 Agricultural Research & Technology: Open Access Journal How to cite this article: Damian Mingle, Amit Kumar. Classify Rice Disease Using Self-Optimizing Models and Edge Computing with Agricultural Implications. Agri Res & Tech: Open Access J. 2021; 25 (5): 556316. DOI: 10.19080/ARTOAJ.2021.25.556316 Table 14: The contents of cultural methods for rice brown spot were created by Tamil Nadu Agricultural University. Methods Category Actions Cultural – Rice Brown Spot As the disease is seed-borne, use disease-free seeds. Removal of alternate & collateral hosts. The use of resistant varieties is the most economical means of control. Growing Resistant varieties like ADT 44,PY 4,CORH 1,CO 44,CAUVERY,BHAVANI,TPS 4 and Dhanu. Providing proper nutrition for optimum plant growth and prevention of water stress seem to be the most important factors in controlling brown spot. The disease is rarely observed in normally fertile rice soils. Soils known to be low in plant-available silicon should be amended with calcium silicate slag before planting, and the field should be well irrigated to avoid water stress. Data science knowledge Our approach leverages an automated machine learning pro- cess that allows for rapid experimentation on real-world prob- lems. This approach covers the entire process from beginning to end, more specifically, from uploading the data to the deployment of a machine learning classifier, with little to no human interac- tion. This approach has data science expertise built into the pro- cess, offering guardrails for lay users of machine learning. In this approach, the emphasis is placed on the creative use of the tech- nology rather than the details of a given algorithm. Effects of age, educational level, and adoption of farm- ing practices Children who were raised on family farms are familiar with the farming practices that have proven successful for their par- ents. So, even when younger family members don’t make identical decisions to those of their parents, their decisions will continue to be informed by years spent under their parents’ guidance [13]. This is known as multi-generational farming, which often doesn’t involve technology in agriculture. According to Moore’s law, computer processing speed doubles every 18 or so months, and a generation is generally understood to be between 20 and 30 years. This means that processing speeds may double 20 times during a given farming generation, allowing for more insight and actionable machine learning models (Kole- va,2021). Although former generations may not have been raised with digital technology, such significant enhancements in machine learning model performance, along with edge computing, should encourage adoption within agriculture, requiring new behaviors and ways of thinking. We believe that just like rakes, hoes, and shovels are essential for today’s farmers, machine learning will be added to the basic set of farming tools in the 21st century. Digital farming techniques Our approach is additive in the context of modern agricultural methods. Successfully delivering productive and sustainable ag- ricultural systems worldwide will help form the foundations for overcoming food insecurity and hunger. Economic viability makes edge commuting one of the emerging technologies staged to transform the agricultural industry. With sensors, actuators, and real-time data-driven models, digitization can help us overcome some of the biggest challenges of our time [14]. Autonomous trac- tors and robotic machinery, often known as Agribots, can run on autopilot, communicating with nearby sensors to acquire the nec- essary data about the surrounding environment. The introduction of drones has shown great promise with agricultural implications. These unmanned aerial vehicles can help in various ways, such as monitoring livestock and crop growth, and increasing output with real-time insights. Additionally, the introduction of the 5G mobile network, which is designed to connect virtually everyone and ev- erything together, including machines, objects, and devices, will further drive the adoption of digital farming techniques. Precision farming Technology has become an imperative consideration for ev- ery stakeholder involved in agriculture, starting from farmer to agronomist. Precision farming makes farming more accurate and controlled when it comes to growing crops and raising livestock. It can decide on and carry out the best technical intervention in the right place at the best possible moment. It makes it simpler to plan ahead of time and to act precisely in terms of space. A vi- tal component of the precision farming management approach is the use of technology with its wide array of instruments, such as robotics, drones, variable rate technology, sensors, GPS-based soil sampling, telematics, and software. A balance must be found between precision farming, capable of determining the correct, limited scale of mediation at the right time and in the right place, and a preventive, systemic approach empowering a cultivated ecosystem to produce without the need for curative treatments. Digital technology will make it possible for targeted interventions, through data processing, forecasting and anticipating, simulating, and safeguarding [15]. Conclusion The best prediction statistics were achieved with a Gauss- ian Naïve Bayes stacked classifier that used Stochastic Gradient Descent Classifiers predictions as model inputs. The automated
- 13. How to cite this article: Damian Mingle, Amit Kumar. Classify Rice Disease Using Self-Optimizing Models and Edge Computing with Agricultural Implications. Agri Res & Tech: Open Access J. 2021; 25 (5): 556316. DOI: 10.19080/ARTOAJ.2021.25.556316 0013 Agricultural Research & Technology: Open Access Journal model construction approach resulted in a validation set of 92.5% accuracy. Therefore, it can be recommended for use, with little to no involvement from a machine learning expert or trained plant pathologist. Our approach ranged from as much as 60 minutes in total time to 2 minutes. Since our method was automated com- pared to a manually crafted process, it is faster loading the data, model construction, optimization, and deployment. This method is inexpensive compared to other methods, not only in time but in economic terms, as our method only uses CPU rather than GPU ar- chitecture. Our approach cut the number of steps in half compared to prior methods and is also self-optimizing, permitting users of this approach to be hands-free. Additionally, our process does not end with the identification of rice plant disease. Instead, we combined management strategies for specific rice diseases from known plant experts using edge computing. This was chosen to in- crease accessibility to the machine learning approach, and allows for our system to meet more farmers where they are and when they need it [16-20]. Acknowledgments We would like to thank the University of California, Irvine’s Center for Machine Learning and Intelligent Systems, for making the images of rice plant disease available, and Logic Plum, Inc. for supporting our study. Conflict of Interest This research is sponsored by LogicPlum and may lead to the development of products that may be licensed. Amit Kumar receives a salary from LogicPlum. Damian Mingle is the founder of LogicPlum and receives other financial benefits.. References 1. International Rice Research Institute (2021) (n.da.). Rice to zero hunger. IRRI.Org. 2. Sinha P, Balas B, Ostrovsky Y, Russell R (2006) Face Recognition by Humans: Nineteen Results All Computer Vision Researchers Should Know About. Proceedings of the IEEE 94(11): 1948-1962. 3. Noble JA (1995) From inspection to process understanding and monitoring: a view on computer vision in manufacturing. Image and Vision Computing 13(3): 197-214. 4. Sahni S, Mittal A, Kidwai F, Tiwari A, Khandelwal K (2020) Insurance Fraud Identification using Computer Vision and IoT: A Study of Field Fires. Procedia Computer Science 173: 56-63. 5. Santra B, Mukherjee DP (2019) A comprehensive survey on computer vision based approaches for automatic identification of products in retail store. Image and Vision Computing 86: 45-63. 6. Prajapati HB, Shah JP, Dabhi VK (2018) Detection and classification of rice plant diseases. Intelligent Decision Technologies, 1-18. 7. Logic Plum, Inc. (n.d.). A.I. Innovation Platform. LogicPlum. 8. Bhole V, Kumar A (2020) Analysis of Convolutional Neural Network Using Pre-Trained Squeezenet Model for Classification of Thermal Fruit Images. ICT for Competitive Strategies, pp: 759-768. 9. Džeroski S, Ženko B (2004) Is Combining Classifiers with Stacking Better than Selecting the Best One? Machine Learning 54(3): 255-273. 10. Gardner WA (1984) Learning characteristics of stochastic-gradient- descent algorithms: A general study, analysis, and critique. Signal Processing 6(2): 113-133. 11. Pérez-Pons ME, Plaza-Hernández M, Alonso RS, Parra-Domínguez J, Prieto J (2020) Increasing Profitability and Monitoring Environmental Performance: A Case Study in the Agri-Food Industry through an Edge- IoT Platform. Sustainability 13(1), 283. 12. Tang Y, Dananjayan S, Hou C, Guo Q, Luo S, et al. (2021) A survey on the 5G network and its impact on agriculture: Challenges and opportunities. Computers and Electronics in Agriculture 180: 105895. 13. Wójcik M, Jeziorska-Biel P, Czapiewski K (2019) Between words: A generational discussion about farming knowledge sources. Journal of Rural Studies 67: 130-141. 14. Carmela Annosi M, Brunetta F, Capo F, Heideveld L (2020) Digitalization in the agri-food industry: the relationship between technology and sustainable development. Management Decision 58(8): 1737-1757. 15. Jacob PM (2018) A Comparative Analysis on Smart Farming Techniques using Internet of Things (IoT). HELIX 8(2): 3294-3302. 16. Fan FAN, Roy T, Roy K (2020) Classification and Detection Rice leaf Diseases Using Information and Communication Technology (ICT) Tools. International Journal of Advanced Engineering Research and Science 7(6): 460-470. 17. Koleva MK (2021) New Approach to Deep Miniaturization: A Way to Overcoming Moore’s Law. Journal of Modern Physics 12(03): 167-178. 18. Plastiras G, Terzi M, Kyrkou C, Theocharidcs T (2018) Edge intelligence: Challenges and opportunities of near-sensor machine learning applications. 2018 IEEE 29th International Conference on Application- specific Systems, Architectures and Processors (ASAP). 19. Tamil Nadu Agricultural University (n.d.). Bacterial Leaf Blight. TNAU. Ac.In. 20. Wolpert DH (1992) Stacked generalization. Neural Networks 5(2): 241-259.
- 14. 0014 Agricultural Research & Technology: Open Access Journal How to cite this article: Damian Mingle, Amit Kumar. Classify Rice Disease Using Self-Optimizing Models and Edge Computing with Agricultural Implications. Agri Res & Tech: Open Access J. 2021; 25 (5): 556316. DOI: 10.19080/ARTOAJ.2021.25.556316 Your next submission with Juniper Publishers will reach you the below assets • Quality Editorial service • Swift Peer Review • Reprints availability • E-prints Service • Manuscript Podcast for convenient understanding • Global attainment for your research • Manuscript accessibility in different formats ( Pdf, E-pub, Full Text, Audio) • Unceasing customer service Track the below URL for one-step submission https://juniperpublishers.com/online-submission.php This work is licensed under Creative Commons Attribution 4.0 License DOI:10.19080/ARTOAJ.2021.25.556316