Pharmacist Interventions and Medication Reviews at Care Homes - Improving Med...
ASAM Poster_Final_Print1
1. Table 1. Sample Characteristics
Integration of a substance abuse treatment
program into population-based behavioral health care
Weinstein LL,1 Gresky DP,2 Basaria N,2 Manejwala OS,3 Gomari M3
1. LifeSynch, Humana Inc., Irving TX 2. Humana Inc., Louisville KY 3. Catasys, Inc., Los Angeles CA
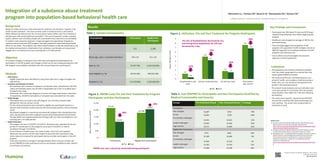
Figure 2. PMPM Costs Pre and Post Treatment for Program
Participants and Non Participants
Background
Nearly 23 million Americans need treatment for substance use disorders; however, only
10.9% receive treatment1. The most common path to treatment entry is self-referral
(36%), followed by referral from the criminal justice system (34%); only 7% of treatment
entrants were referred by healthcare providers2. The current approach creates a passive
system, wherein over 20 million people who may benefit from treatment are overlooked.
To create a more proactive approach, a large managed care organization integrated a
substance abuse treatment (SAT) program into their population-based behavioral health
efforts in two states. The program uses claims-based analytics to identify individuals at risk
for medical and psychiatric complications from substance use disorders and proactively
engages them in treatment and care coaching over a 52 week period.
Objective
To compare changes in emergency room (ER) visits and inpatient hospitalizations for
participants in the SAT program and changes in total cost of care among participants in the
SAT program versus eligible individuals who did not participate (non-participants).
Methods
• Data Source:
- Eligible individuals were identified by using claims data from a large managed care
organization.
• Inclusion and Exclusion Criteria:
- All individuals with a history of substance use disorder (SUD -identified by 139 ICD9
codes) and elevated claims cost ($7,500 in impactable cost in last 12 months) were
included in the study.
- Individuals with a past-year diagnosis of cancer, end stage renal disease, dementia,
schizophrenia, HIV/AIDS, hemophilia or transplant were excluded from the study.
• Study Design:
- Participants were recruited to the SAT program via a monthly outreach letter
followed by 3 phone calls per month.
- For the study, participants were matched to eligible non-participants based on a
measure that estimates medical severity and functionality (severity and functionality
score).
- Participants engaged in a previously described SAT program that included physician
visits, psychosocial visits that employed manual-driven Motivational Enhancement
Therapy (MET) and Cognitive Behavioral Therapy (CBT ) for SUD, and telephonic care
coaching over a 52 week period3.
• Study Outcomes:
- The program ran from 11/2/2013-11/1/2014. Outcomes were reported for the pre-
period (12 months prior to the program) versus post (11/2/2013 or date of
enrollment through 11/1/2014).
- As an indicator of health status, the mean number of ER visits and inpatient
admissions per person and the mean length of stay (LOS) were calculated using
claims data and computed for participants before and after participation in the SAT
program.
- Costs were reported as changes in average allowed claims costs per member per
month (PMPM) for both participants and non-participants stratified by their medical
functionality and severity.
Limitations
Key Findings and Conclusions
• Participants had 16% fewer ER visits and 67% fewer
inpatient hospitalizations than before beginning the
program.
• Healthcare costs dropped an average of 46% for the
participant group.
• These findings suggest that integration of SAT
programs into population health strategies may be an
effective approach to increasing enrollment into SAT
programs and reducing costs.
• Future efforts should investigate this proactive
approach in other populations.
References
(1) Substance Abuse and Mental Health Services Administration (2012)
National Survey on Drug Use and Health. Retrieved from
http://archive.samhsa.gov/data/NSDUH/2012SummNatFindDetTables/
NationalFindings/NSDUHresults2012.htm
(2) Substance Abuse and Mental Health Services Administration, Center
for Behavioral Health Statistics and Quality. (February 6, 2014).
(3) Manejwala, Omar. “Combining Predictive Analytics, Outreach, Evidence
Based Treatment, Case Management and Monitoring to Generate
Clinical Outcome Driven Cost Reductions in High Cost Substance
Dependent Populations.” ASAM 44th Annual Medical-Scientific
Conference. Retrieved from
https://www.softconference.com/ASAM/sessionDetail.asp?SID=31415
4
PMPM costs were reduced by nearly half among participants
American Society of Addiction Medicine | 46th Annual
Conference ǀ Austin TX
April 23-26, 2015
Results
• The population was limited to Medicare members
from two states; geographical or product bias may
impact generalizability of results.
• The study used ER visits and hospitalizations as a
proxy for health; care avoidance could also produce
lower costs, but this would not be expected to be
greater in the participant group.
• The present study analyzed costs and utilization over
a one year period; it is not known from the present
study whether costs might rise in the year following
participation.
• The study used a specific, manual driven MET/CBT
intervention combined with pharmacotherapy and
care coaching. The results may not generalize to
treatment as usual.$2,143
$1,798
$1,151
$2,052
$0
$500
$1,000
$1,500
$2,000
$2,500
Participants Eligible Non-participants
MeanallowedclaimsPMPM
Pre Post
Characteristic Participants Eligible Non-
Participants
N 151 2,198
Mean age, years ± standard deviation 59 ± 10 63 ± 10
Male (n, %) 72 (47.7%) 1,163 (52.9%)
Dual-eligibles (n, %) 49 (32.4%) 559 (25.4%)
Disabled (n, %) 119 (78.8%) 1,530 (69.6%)
46%
14%
Figure 1. Utilization- Pre and Post Treatment for Program Participants
1.2
5.0
1.8
7.6
0.4
4.2
1.5
6.8
0
1
2
3
4
5
6
7
8
9
Hospitalizations (per
year)
LOS (per hospitalization) ER visits (per year) Prescriptions
(per month)
MeanUtilizationCount
Pre Post
67%
15%
16%
10%
Groups Pre-Treatment Period Post-Treatment Period % Change
Participants
Not managed $1,897 $453 -76%
At risk $2,041 $758 -63%
Functionally challenged
$2,391 $2,021 -15%
Health challenged $2,092 $1,039 -50%
High severity $2,371 $1,809 -24%
Eligible Non-Participants
Not managed $775 $941 21%
At risk $1,104 $1,063 -4%
Functionally challenged
$1,854 $1,914 3%
Health challenged $1,365 $1,543 13%
High severity $2,980 $3,568 20%
The rate of hospitalizations decreased by 2/3,
and among those hospitalized, the LOS was
decreased by 1 day.
Table 2. Cost (PMPM) for Participants and Non-Participants Stratified by
Medical Functionality and Severity