
Recommended
More Related Content
Featured
Featured (20)
Let's Make a Bar Graph!
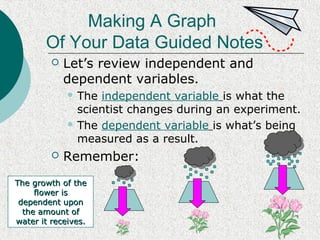
- 1. Making A Graph Of Your Data Guided Notes Let’s review independent and dependent variables. The independent variable is what the scientist changes during an experiment. The dependent variable is what’s being measured as a result. Remember: TThhee ggrroowwtthh ooff tthhee fflloowweerr iiss ddeeppeennddeenntt uuppoonn tthhee aammoouunntt ooff wwaatteerr iitt rreecceeiivveess..
- 2. Making a Bar Graph 11.. CCrreeaattee aa ttiittllee.. Does Changing The Type OOff PPaappeerr AAffffeecctt HHooww FFaarr MMyy AAiirrppllaannee WWiillll FFllyy?? 1100 88 66 44 22.. DDeetteerrmmiinnee iinntteerrvvaall aanndd llaabbeell ffoorr xx--aaxxiiss.. 33.. DDeetteerrmmiinnee iinntteerrvvaall aanndd llaabbeell ffoorr yy-- aaxxiiss.. 44.. PPlloott yyoouurr ddaattaa.. NNootteebbooookk CCoonnssttrruuccttiioonn TTyyppee ooff PPaappeerr 22 00 FFlliigghhtt DDiissttaannccee ((mmeetteerrss)) Make sure you color and make it look professional