SlideShare a Scribd company logo
1 of 4
Download to read offline
U.S. Trade with sub-Saharan Africa, January-March 2014
	
  
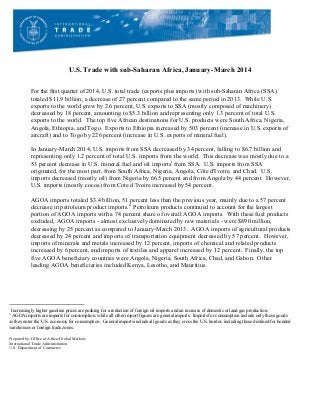
For the first quarter of 2014, U.S. total trade (exports plus imports) with sub-Saharan Africa (SSA)
totaled $11.9 billion, a decrease of 27 percent compared to the same period in 2013. While U.S.
exports to the world grew by 2.6 percent, U.S. exports to SSA (mostly composed of machinery)
decreased by 18 percent, amounting to $5.3 billion and representing only 1.3 percent of total U.S.
exports to the world. The top five African destinations for U.S. products were South Africa, Nigeria,
Angola, Ethiopia, and Togo. Exports to Ethiopia increased by 503 percent (increase in U.S. exports of
aircraft) and to Togo by 226 percent (increase in U.S. exports of mineral fuel).
In January-March 2014, U.S. imports from SSA decreased by 34 percent, falling to $6.7 billion and
representing only 1.2 percent of total U.S. imports from the world. This decrease was mostly due to a
53 percent decrease in U.S. mineral fuel and oil importsi
from SSA. U.S. imports from SSA
originated, for the most part, from South Africa, Nigeria, Angola, Côte d'Ivoire, and Chad. U.S.
imports decreased (mostly oil) from Nigeria by 66.5 percent and from Angola by 44 percent. However,
U.S. imports (mostly cocoa) from Cote d’Ivoire increased by 54 percent.
AGOA imports totaled $3.4 billion, 51 percent less than the previous year, mainly due to a 57 percent
decrease in petroleum product imports.ii
Petroleum products continued to account for the largest
portion of AGOA imports with a 74 percent share of overall AGOA imports. With these fuel products
excluded, AGOA imports - almost exclusively dominated by raw materials - were $890 million,
decreasing by 25 percent as compared to January-March 2013. AGOA imports of agricultural products
decreased by 24 percent and imports of transportation equipment decreased by 57 percent. However,
imports of minerals and metals increased by 12 percent, imports of chemical and related products
increased by 6 percent, and imports of textiles and apparel increased by 12 percent. Finally, the top
five AGOA beneficiary countries were Angola, Nigeria, South Africa, Chad, and Gabon. Other
leading AGOA beneficiaries included Kenya, Lesotho, and Mauritius.


i
Increasingly higher gasoline prices are pushing for a reduction of foreign oil imports and an increase of domestic oil and gas production.
ii
	
  AGOA imports are imports for consumption, while all other import figures are general imports. Imports for consumption include only those goods
as they enter the U.S. economy for consumption. General imports include all goods as they cross the U.S. border, including those destined for bonded
warehouses or foreign trade zones.
Prepared by: Office of Africa/Global Markets
International Trade Administration
U.S. Department of Commerce


U.S. TRADE WITH SUB-SAHARAN AFRICA
U.S. EXPORTS
($MILLIONS F.A.S.)
January-December January-March January-March
COUNTRY 2013 2013 2014
	
  Angola 1,450.13 320.56 402.39
Benin 607.42 162.87 205.49
Botswana 82.12 20.73 6.66
Burkina Faso 77.49 13.54 15.50
Burundi 16.74 9.95 1.07
Cameroon 331.40 80.69 52.01
Cape Verde 9.13 3.95 1.39
Central African Republic 4.10 2.31 1.41
Chad 40.88 10.15 10.37
Comoros 3.54 0.38 0.23
Congo 225.23 57.17 39.52
Congo, Dem. Rep. 169.39 36.50 31.44
Côte d'Ivoire 168.45 46.81 42.89
Djibouti 169.65 50.20 23.64
Equatorial Guinea 755.67 570.45 116.16
Eritrea 11.11 0.70 0.55
Ethiopia 678.09 41.62 251.01
Gabon 236.79 63.51 60.96
Gambia 35.40 6.77 10.79
Ghana 1,067.48 329.33 214.65
Guinea 79.53 25.61 14.60
Guinea-Bissau 6.43 4.09 0.42
Kenya 651.41 115.39 99.23
Lesotho 0.64 0.08 0.94
Liberia 173.23 42.34 47.84
Madagascar 64.07 15.25 8.97
Malawi 54.21 6.98 24.77
Mali 49.92 17.59 17.04
Mauritania 245.24 36.08 26.41
Mauritius 42.04 8.38 6.66
Mozambique 306.39 64.13 81.82
Namibia 206.65 33.86 86.26
Niger 46.17 6.82 12.31
Nigeria 6,474.50 1421.49 1338.20
Rwanda 25.20 3.79 5.19
São Tomé and Príncipe 2.00 0.95 0.08
Senegal 230.43 38.70 50.77
Seychelles 12.19 3.28 3.73
Sierra Leone 82.51 14.89 18.54
Somalia 15.05 1.29 17.87
South Africa 7,292.73 2450.96 1534.88
Sudan 88.11 2.38 25.59


Swaziland 22.94 4.76 6.20
Tanzania 420.19 87.31 56.66
Togo 956.15 64.26 209.24
Uganda 125.13 47.32 24.15
Zambia 141.31 26.90 40.32
Zimbabwe 23,954.54 18.07 14.79
	
  TOTAL 47,909.08 6,391.13 5,261.62
Source: U.S. Dept. of Commerce, Bureau of Census


U.S. IMPORTS
($MILLIONS CUSTOMS VALUE)
January-December January-March January-March
COUNTRY 2013 2013 2014
Angola 8,745.03 2127.79 1187.87
Benin 3.13 0.91 2.03
Botswana 283.39 52.66 54.05
Burkina Faso 6.11 0.35 0.36
Burundi 4.30 1.60 2.43
Cameroon 366.99 98.10 56.86
Cape Verde 2.36 0.03 0.20
Central African Republic 2.79 2.21 0.20
Chad 2,459.15 495.62 442.59
Comoros 2.84 0.66 0.11
Congo 1,166.56 236.29 84.05
Congo, Dem. Rep. 75.63 9.64 31.17
Côte d'Ivoire 1,002.09 367.43 565.81
Djibouti 3.95 0.88 0.78
Equatorial Guinea 898.00 162.54 43.68
Eritrea 0.09 0.05 0.08
Ethiopia 193.57 28.71 46.96
Gabon 1,110.99 33.53 243.40
Gambia 1.69 0.06 0.10
Ghana 366.19 76.48 71.99
Guinea 98.97 31.82 25.59
Guinea-Bissau 3.22 0.05 0.04
Kenya 450.83 97.14 121.80
Lesotho 358.87 75.40 120.37
Liberia 96.53 23.02 16.43
Madagascar 179.79 44.43 49.53
Malawi 73.13 12.27 11.93
Mali 3.69 0.43 0.42
Mauritania 130.69 0.15 31.39
Mauritius 338.46 82.82 88.37
Mozambique 76.07 9.68 19.67
Namibia 262.64 23.93 67.60


Niger 2.33 0.62 0.68
Nigeria 11,723.94 3832.14 1285.27
Rwanda 24.45 8.52 6.24
São Tomé and Príncipe 0.25 0.04 0.04
Senegal 16.98 2.92 5.47
Seychelles 5.76 2.61 1.93
Sierra Leone 41.55 4.54 12.58
Somalia 1.19 0.37 0.14
South Africa 8,480.18 2077.36 1914.64
Sudan 10.24 1.31 1.73
Swaziland 58.94 12.44 14.52
Tanzania 70.32 23.63 25.72
Togo 7.72 1.38 3.53
Uganda 47.01 7.96 8.23
Zambia 37.35 11.26 10.86
Zimbabwe 13.89 1.33 8.47
TOTAL 39,309.84 10,085.13 6,687.9
Source: U.S. Dept. of Commerce, Bureau of Census


More Related Content

More from Dr Dev Kambhampati

FDA Regulation of Medical Devices
FDA Regulation of Medical DevicesFDA Regulation of Medical Devices
FDA Regulation of Medical DevicesDr Dev Kambhampati
 
USA FAQs- Prescription Drug Pricing & Policy
USA FAQs- Prescription Drug Pricing & PolicyUSA FAQs- Prescription Drug Pricing & Policy
USA FAQs- Prescription Drug Pricing & PolicyDr Dev Kambhampati
 
USA Carbon Capture & Sequestration Efforts
USA Carbon Capture & Sequestration EffortsUSA Carbon Capture & Sequestration Efforts
USA Carbon Capture & Sequestration EffortsDr Dev Kambhampati
 
Arctic National Wildlife Refuge (ANWR)- Overview
Arctic National Wildlife Refuge (ANWR)- OverviewArctic National Wildlife Refuge (ANWR)- Overview
Arctic National Wildlife Refuge (ANWR)- OverviewDr Dev Kambhampati
 
NIST Guide- Situational Awareness for Electric Utilities
NIST Guide- Situational Awareness for Electric UtilitiesNIST Guide- Situational Awareness for Electric Utilities
NIST Guide- Situational Awareness for Electric UtilitiesDr Dev Kambhampati
 
Dr Dev Kambhampati | Cybersecurity Guide for Utilities
Dr Dev Kambhampati | Cybersecurity Guide for UtilitiesDr Dev Kambhampati | Cybersecurity Guide for Utilities
Dr Dev Kambhampati | Cybersecurity Guide for UtilitiesDr Dev Kambhampati
 
Dr Dev Kambhampati | USA Cybersecurity R&D Strategic Plan
Dr Dev Kambhampati | USA Cybersecurity R&D Strategic PlanDr Dev Kambhampati | USA Cybersecurity R&D Strategic Plan
Dr Dev Kambhampati | USA Cybersecurity R&D Strategic PlanDr Dev Kambhampati
 
Dr Dev Kambhampati | USA Artificial Intelligence (AI) R&D Strategic Plan
Dr Dev Kambhampati | USA Artificial Intelligence (AI) R&D Strategic PlanDr Dev Kambhampati | USA Artificial Intelligence (AI) R&D Strategic Plan
Dr Dev Kambhampati | USA Artificial Intelligence (AI) R&D Strategic PlanDr Dev Kambhampati
 
Dr Dev Kambhampati | USA Big Data R&D Strategic Plan
Dr Dev Kambhampati | USA Big Data R&D Strategic PlanDr Dev Kambhampati | USA Big Data R&D Strategic Plan
Dr Dev Kambhampati | USA Big Data R&D Strategic PlanDr Dev Kambhampati
 
DARPA -Transition of Technologies
DARPA -Transition of TechnologiesDARPA -Transition of Technologies
DARPA -Transition of TechnologiesDr Dev Kambhampati
 
NASA Technology Roadmaps- Materials, Structures & Manufacturing
NASA Technology Roadmaps- Materials, Structures & ManufacturingNASA Technology Roadmaps- Materials, Structures & Manufacturing
NASA Technology Roadmaps- Materials, Structures & ManufacturingDr Dev Kambhampati
 
Dr Dev Kambhampati | Tennessee Exports, Jobs & Foreign Investment
Dr Dev Kambhampati | Tennessee Exports, Jobs & Foreign InvestmentDr Dev Kambhampati | Tennessee Exports, Jobs & Foreign Investment
Dr Dev Kambhampati | Tennessee Exports, Jobs & Foreign InvestmentDr Dev Kambhampati
 
NAFTA impact on Chemical Industry
NAFTA impact on Chemical IndustryNAFTA impact on Chemical Industry
NAFTA impact on Chemical IndustryDr Dev Kambhampati
 
Chinese Investments in the USA: Impacts & Issues for Policymakers
Chinese Investments in the USA: Impacts & Issues for PolicymakersChinese Investments in the USA: Impacts & Issues for Policymakers
Chinese Investments in the USA: Impacts & Issues for PolicymakersDr Dev Kambhampati
 
China's Pursuit of Next Frontier Tech- Computing, Robotics & Biotechnology
China's Pursuit of Next Frontier Tech- Computing, Robotics & BiotechnologyChina's Pursuit of Next Frontier Tech- Computing, Robotics & Biotechnology
China's Pursuit of Next Frontier Tech- Computing, Robotics & BiotechnologyDr Dev Kambhampati
 
US Access to China's Consumer Markets- Ecommerce, Logistics & Financial Services
US Access to China's Consumer Markets- Ecommerce, Logistics & Financial ServicesUS Access to China's Consumer Markets- Ecommerce, Logistics & Financial Services
US Access to China's Consumer Markets- Ecommerce, Logistics & Financial ServicesDr Dev Kambhampati
 
US Access to China's Consumer Markets- Digital Finance
US Access to China's Consumer Markets- Digital FinanceUS Access to China's Consumer Markets- Digital Finance
US Access to China's Consumer Markets- Digital FinanceDr Dev Kambhampati
 
Access to China's Consumer Markets for Financial Services
Access to China's Consumer Markets for Financial ServicesAccess to China's Consumer Markets for Financial Services
Access to China's Consumer Markets for Financial ServicesDr Dev Kambhampati
 

More from Dr Dev Kambhampati (20)

FDA Regulation of Medical Devices
FDA Regulation of Medical DevicesFDA Regulation of Medical Devices
FDA Regulation of Medical Devices
 
USA FAQs- Prescription Drug Pricing & Policy
USA FAQs- Prescription Drug Pricing & PolicyUSA FAQs- Prescription Drug Pricing & Policy
USA FAQs- Prescription Drug Pricing & Policy
 
USA Carbon Capture & Sequestration Efforts
USA Carbon Capture & Sequestration EffortsUSA Carbon Capture & Sequestration Efforts
USA Carbon Capture & Sequestration Efforts
 
Arctic National Wildlife Refuge (ANWR)- Overview
Arctic National Wildlife Refuge (ANWR)- OverviewArctic National Wildlife Refuge (ANWR)- Overview
Arctic National Wildlife Refuge (ANWR)- Overview
 
NIST Guide- Situational Awareness for Electric Utilities
NIST Guide- Situational Awareness for Electric UtilitiesNIST Guide- Situational Awareness for Electric Utilities
NIST Guide- Situational Awareness for Electric Utilities
 
Dr Dev Kambhampati | Cybersecurity Guide for Utilities
Dr Dev Kambhampati | Cybersecurity Guide for UtilitiesDr Dev Kambhampati | Cybersecurity Guide for Utilities
Dr Dev Kambhampati | Cybersecurity Guide for Utilities
 
Dr Dev Kambhampati | USA Cybersecurity R&D Strategic Plan
Dr Dev Kambhampati | USA Cybersecurity R&D Strategic PlanDr Dev Kambhampati | USA Cybersecurity R&D Strategic Plan
Dr Dev Kambhampati | USA Cybersecurity R&D Strategic Plan
 
Dr Dev Kambhampati | USA Artificial Intelligence (AI) R&D Strategic Plan
Dr Dev Kambhampati | USA Artificial Intelligence (AI) R&D Strategic PlanDr Dev Kambhampati | USA Artificial Intelligence (AI) R&D Strategic Plan
Dr Dev Kambhampati | USA Artificial Intelligence (AI) R&D Strategic Plan
 
Dr Dev Kambhampati | USA Big Data R&D Strategic Plan
Dr Dev Kambhampati | USA Big Data R&D Strategic PlanDr Dev Kambhampati | USA Big Data R&D Strategic Plan
Dr Dev Kambhampati | USA Big Data R&D Strategic Plan
 
DARPA -Transition of Technologies
DARPA -Transition of TechnologiesDARPA -Transition of Technologies
DARPA -Transition of Technologies
 
NASA Technology Roadmaps- Materials, Structures & Manufacturing
NASA Technology Roadmaps- Materials, Structures & ManufacturingNASA Technology Roadmaps- Materials, Structures & Manufacturing
NASA Technology Roadmaps- Materials, Structures & Manufacturing
 
Dr Dev Kambhampati | Tennessee Exports, Jobs & Foreign Investment
Dr Dev Kambhampati | Tennessee Exports, Jobs & Foreign InvestmentDr Dev Kambhampati | Tennessee Exports, Jobs & Foreign Investment
Dr Dev Kambhampati | Tennessee Exports, Jobs & Foreign Investment
 
NAFTA exports by US States
NAFTA exports by US StatesNAFTA exports by US States
NAFTA exports by US States
 
NAFTA impact on Chemical Industry
NAFTA impact on Chemical IndustryNAFTA impact on Chemical Industry
NAFTA impact on Chemical Industry
 
China's 13th Five Year Plan
China's 13th Five Year PlanChina's 13th Five Year Plan
China's 13th Five Year Plan
 
Chinese Investments in the USA: Impacts & Issues for Policymakers
Chinese Investments in the USA: Impacts & Issues for PolicymakersChinese Investments in the USA: Impacts & Issues for Policymakers
Chinese Investments in the USA: Impacts & Issues for Policymakers
 
China's Pursuit of Next Frontier Tech- Computing, Robotics & Biotechnology
China's Pursuit of Next Frontier Tech- Computing, Robotics & BiotechnologyChina's Pursuit of Next Frontier Tech- Computing, Robotics & Biotechnology
China's Pursuit of Next Frontier Tech- Computing, Robotics & Biotechnology
 
US Access to China's Consumer Markets- Ecommerce, Logistics & Financial Services
US Access to China's Consumer Markets- Ecommerce, Logistics & Financial ServicesUS Access to China's Consumer Markets- Ecommerce, Logistics & Financial Services
US Access to China's Consumer Markets- Ecommerce, Logistics & Financial Services
 
US Access to China's Consumer Markets- Digital Finance
US Access to China's Consumer Markets- Digital FinanceUS Access to China's Consumer Markets- Digital Finance
US Access to China's Consumer Markets- Digital Finance
 
Access to China's Consumer Markets for Financial Services
Access to China's Consumer Markets for Financial ServicesAccess to China's Consumer Markets for Financial Services
Access to China's Consumer Markets for Financial Services
 

Recently uploaded

Dr. Admir Softic_ presentation_Green Club_ENG.pdf
Dr. Admir Softic_ presentation_Green Club_ENG.pdfDr. Admir Softic_ presentation_Green Club_ENG.pdf
Dr. Admir Softic_ presentation_Green Club_ENG.pdfAdmir Softic
 
Over the Top (OTT) Market Size & Growth Outlook 2024-2030
Over the Top (OTT) Market Size & Growth Outlook 2024-2030Over the Top (OTT) Market Size & Growth Outlook 2024-2030
Over the Top (OTT) Market Size & Growth Outlook 2024-2030tarushabhavsar
 
New 2024 Cannabis Edibles Investor Pitch Deck Template
New 2024 Cannabis Edibles Investor Pitch Deck TemplateNew 2024 Cannabis Edibles Investor Pitch Deck Template
New 2024 Cannabis Edibles Investor Pitch Deck TemplateCannaBusinessPlans
 
PHX May 2024 Corporate Presentation Final
PHX May 2024 Corporate Presentation FinalPHX May 2024 Corporate Presentation Final
PHX May 2024 Corporate Presentation FinalPanhandleOilandGas
 
Power point presentation on enterprise performance management
Power point presentation on enterprise performance managementPower point presentation on enterprise performance management
Power point presentation on enterprise performance managementVaishnaviGunji
 
Falcon's Invoice Discounting: Your Path to Prosperity
Falcon's Invoice Discounting: Your Path to ProsperityFalcon's Invoice Discounting: Your Path to Prosperity
Falcon's Invoice Discounting: Your Path to Prosperityhemanthkumar470700
 
Mckinsey foundation level Handbook for Viewing
Mckinsey foundation level Handbook for ViewingMckinsey foundation level Handbook for Viewing
Mckinsey foundation level Handbook for ViewingNauman Safdar
 
Marel Q1 2024 Investor Presentation from May 8, 2024
Marel Q1 2024 Investor Presentation from May 8, 2024Marel Q1 2024 Investor Presentation from May 8, 2024
Marel Q1 2024 Investor Presentation from May 8, 2024Marel
 
Uneak White's Personal Brand Exploration Presentation
Uneak White's Personal Brand Exploration PresentationUneak White's Personal Brand Exploration Presentation
Uneak White's Personal Brand Exploration Presentationuneakwhite
 
Buy Verified TransferWise Accounts From Seosmmearth
Buy Verified TransferWise Accounts From SeosmmearthBuy Verified TransferWise Accounts From Seosmmearth
Buy Verified TransferWise Accounts From SeosmmearthBuy Verified Binance Account
 
Mifepristone Available in Muscat +918761049707^^ €€ Buy Abortion Pills in Oman
Mifepristone Available in Muscat +918761049707^^ €€ Buy Abortion Pills in OmanMifepristone Available in Muscat +918761049707^^ €€ Buy Abortion Pills in Oman
Mifepristone Available in Muscat +918761049707^^ €€ Buy Abortion Pills in Omaninstagramfab782445
 
Putting the SPARK into Virtual Training.pptx
Putting the SPARK into Virtual Training.pptxPutting the SPARK into Virtual Training.pptx
Putting the SPARK into Virtual Training.pptxCynthia Clay
 
Katrina Personal Brand Project and portfolio 1
Katrina Personal Brand Project and portfolio 1Katrina Personal Brand Project and portfolio 1
Katrina Personal Brand Project and portfolio 1kcpayne
 
Lundin Gold - Q1 2024 Conference Call Presentation (Revised)
Lundin Gold - Q1 2024 Conference Call Presentation (Revised)Lundin Gold - Q1 2024 Conference Call Presentation (Revised)
Lundin Gold - Q1 2024 Conference Call Presentation (Revised)Adnet Communications
 
joint cost.pptx COST ACCOUNTING Sixteenth Edition ...
joint cost.pptx  COST ACCOUNTING  Sixteenth Edition                          ...joint cost.pptx  COST ACCOUNTING  Sixteenth Edition                          ...
joint cost.pptx COST ACCOUNTING Sixteenth Edition ...NadhimTaha
 
Famous Olympic Siblings from the 21st Century
Famous Olympic Siblings from the 21st CenturyFamous Olympic Siblings from the 21st Century
Famous Olympic Siblings from the 21st Centuryrwgiffor
 
Rice Manufacturers in India | Shree Krishna Exports
Rice Manufacturers in India | Shree Krishna ExportsRice Manufacturers in India | Shree Krishna Exports
Rice Manufacturers in India | Shree Krishna ExportsShree Krishna Exports
 
Falcon Invoice Discounting: Aviate Your Cash Flow Challenges
Falcon Invoice Discounting: Aviate Your Cash Flow ChallengesFalcon Invoice Discounting: Aviate Your Cash Flow Challenges
Falcon Invoice Discounting: Aviate Your Cash Flow Challengeshemanthkumar470700
 

Recently uploaded (20)

Dr. Admir Softic_ presentation_Green Club_ENG.pdf
Dr. Admir Softic_ presentation_Green Club_ENG.pdfDr. Admir Softic_ presentation_Green Club_ENG.pdf
Dr. Admir Softic_ presentation_Green Club_ENG.pdf
 
Over the Top (OTT) Market Size & Growth Outlook 2024-2030
Over the Top (OTT) Market Size & Growth Outlook 2024-2030Over the Top (OTT) Market Size & Growth Outlook 2024-2030
Over the Top (OTT) Market Size & Growth Outlook 2024-2030
 
New 2024 Cannabis Edibles Investor Pitch Deck Template
New 2024 Cannabis Edibles Investor Pitch Deck TemplateNew 2024 Cannabis Edibles Investor Pitch Deck Template
New 2024 Cannabis Edibles Investor Pitch Deck Template
 
PHX May 2024 Corporate Presentation Final
PHX May 2024 Corporate Presentation FinalPHX May 2024 Corporate Presentation Final
PHX May 2024 Corporate Presentation Final
 
Power point presentation on enterprise performance management
Power point presentation on enterprise performance managementPower point presentation on enterprise performance management
Power point presentation on enterprise performance management
 
Falcon's Invoice Discounting: Your Path to Prosperity
Falcon's Invoice Discounting: Your Path to ProsperityFalcon's Invoice Discounting: Your Path to Prosperity
Falcon's Invoice Discounting: Your Path to Prosperity
 
Mckinsey foundation level Handbook for Viewing
Mckinsey foundation level Handbook for ViewingMckinsey foundation level Handbook for Viewing
Mckinsey foundation level Handbook for Viewing
 
Marel Q1 2024 Investor Presentation from May 8, 2024
Marel Q1 2024 Investor Presentation from May 8, 2024Marel Q1 2024 Investor Presentation from May 8, 2024
Marel Q1 2024 Investor Presentation from May 8, 2024
 
HomeRoots Pitch Deck | Investor Insights | April 2024
HomeRoots Pitch Deck | Investor Insights | April 2024HomeRoots Pitch Deck | Investor Insights | April 2024
HomeRoots Pitch Deck | Investor Insights | April 2024
 
Uneak White's Personal Brand Exploration Presentation
Uneak White's Personal Brand Exploration PresentationUneak White's Personal Brand Exploration Presentation
Uneak White's Personal Brand Exploration Presentation
 
Buy Verified TransferWise Accounts From Seosmmearth
Buy Verified TransferWise Accounts From SeosmmearthBuy Verified TransferWise Accounts From Seosmmearth
Buy Verified TransferWise Accounts From Seosmmearth
 
Buy gmail accounts.pdf buy Old Gmail Accounts
Buy gmail accounts.pdf buy Old Gmail AccountsBuy gmail accounts.pdf buy Old Gmail Accounts
Buy gmail accounts.pdf buy Old Gmail Accounts
 
Mifepristone Available in Muscat +918761049707^^ €€ Buy Abortion Pills in Oman
Mifepristone Available in Muscat +918761049707^^ €€ Buy Abortion Pills in OmanMifepristone Available in Muscat +918761049707^^ €€ Buy Abortion Pills in Oman
Mifepristone Available in Muscat +918761049707^^ €€ Buy Abortion Pills in Oman
 
Putting the SPARK into Virtual Training.pptx
Putting the SPARK into Virtual Training.pptxPutting the SPARK into Virtual Training.pptx
Putting the SPARK into Virtual Training.pptx
 
Katrina Personal Brand Project and portfolio 1
Katrina Personal Brand Project and portfolio 1Katrina Personal Brand Project and portfolio 1
Katrina Personal Brand Project and portfolio 1
 
Lundin Gold - Q1 2024 Conference Call Presentation (Revised)
Lundin Gold - Q1 2024 Conference Call Presentation (Revised)Lundin Gold - Q1 2024 Conference Call Presentation (Revised)
Lundin Gold - Q1 2024 Conference Call Presentation (Revised)
 
joint cost.pptx COST ACCOUNTING Sixteenth Edition ...
joint cost.pptx  COST ACCOUNTING  Sixteenth Edition                          ...joint cost.pptx  COST ACCOUNTING  Sixteenth Edition                          ...
joint cost.pptx COST ACCOUNTING Sixteenth Edition ...
 
Famous Olympic Siblings from the 21st Century
Famous Olympic Siblings from the 21st CenturyFamous Olympic Siblings from the 21st Century
Famous Olympic Siblings from the 21st Century
 
Rice Manufacturers in India | Shree Krishna Exports
Rice Manufacturers in India | Shree Krishna ExportsRice Manufacturers in India | Shree Krishna Exports
Rice Manufacturers in India | Shree Krishna Exports
 
Falcon Invoice Discounting: Aviate Your Cash Flow Challenges
Falcon Invoice Discounting: Aviate Your Cash Flow ChallengesFalcon Invoice Discounting: Aviate Your Cash Flow Challenges
Falcon Invoice Discounting: Aviate Your Cash Flow Challenges
 

Dr Dev Kambhampati | US Trade with Sub-Saharan Africa, Jan- Mar 2014

  • 1. U.S. Trade with sub-Saharan Africa, January-March 2014   For the first quarter of 2014, U.S. total trade (exports plus imports) with sub-Saharan Africa (SSA) totaled $11.9 billion, a decrease of 27 percent compared to the same period in 2013. While U.S. exports to the world grew by 2.6 percent, U.S. exports to SSA (mostly composed of machinery) decreased by 18 percent, amounting to $5.3 billion and representing only 1.3 percent of total U.S. exports to the world. The top five African destinations for U.S. products were South Africa, Nigeria, Angola, Ethiopia, and Togo. Exports to Ethiopia increased by 503 percent (increase in U.S. exports of aircraft) and to Togo by 226 percent (increase in U.S. exports of mineral fuel). In January-March 2014, U.S. imports from SSA decreased by 34 percent, falling to $6.7 billion and representing only 1.2 percent of total U.S. imports from the world. This decrease was mostly due to a 53 percent decrease in U.S. mineral fuel and oil importsi from SSA. U.S. imports from SSA originated, for the most part, from South Africa, Nigeria, Angola, Côte d'Ivoire, and Chad. U.S. imports decreased (mostly oil) from Nigeria by 66.5 percent and from Angola by 44 percent. However, U.S. imports (mostly cocoa) from Cote d’Ivoire increased by 54 percent. AGOA imports totaled $3.4 billion, 51 percent less than the previous year, mainly due to a 57 percent decrease in petroleum product imports.ii Petroleum products continued to account for the largest portion of AGOA imports with a 74 percent share of overall AGOA imports. With these fuel products excluded, AGOA imports - almost exclusively dominated by raw materials - were $890 million, decreasing by 25 percent as compared to January-March 2013. AGOA imports of agricultural products decreased by 24 percent and imports of transportation equipment decreased by 57 percent. However, imports of minerals and metals increased by 12 percent, imports of chemical and related products increased by 6 percent, and imports of textiles and apparel increased by 12 percent. Finally, the top five AGOA beneficiary countries were Angola, Nigeria, South Africa, Chad, and Gabon. Other leading AGOA beneficiaries included Kenya, Lesotho, and Mauritius.                                                                                                                                 i Increasingly higher gasoline prices are pushing for a reduction of foreign oil imports and an increase of domestic oil and gas production. ii  AGOA imports are imports for consumption, while all other import figures are general imports. Imports for consumption include only those goods as they enter the U.S. economy for consumption. General imports include all goods as they cross the U.S. border, including those destined for bonded warehouses or foreign trade zones. Prepared by: Office of Africa/Global Markets International Trade Administration U.S. Department of Commerce
  • 2.                                                                                                                                                                                                                                                                                                                                                                                                                                                                         U.S. TRADE WITH SUB-SAHARAN AFRICA U.S. EXPORTS ($MILLIONS F.A.S.) January-December January-March January-March COUNTRY 2013 2013 2014  Angola 1,450.13 320.56 402.39 Benin 607.42 162.87 205.49 Botswana 82.12 20.73 6.66 Burkina Faso 77.49 13.54 15.50 Burundi 16.74 9.95 1.07 Cameroon 331.40 80.69 52.01 Cape Verde 9.13 3.95 1.39 Central African Republic 4.10 2.31 1.41 Chad 40.88 10.15 10.37 Comoros 3.54 0.38 0.23 Congo 225.23 57.17 39.52 Congo, Dem. Rep. 169.39 36.50 31.44 Côte d'Ivoire 168.45 46.81 42.89 Djibouti 169.65 50.20 23.64 Equatorial Guinea 755.67 570.45 116.16 Eritrea 11.11 0.70 0.55 Ethiopia 678.09 41.62 251.01 Gabon 236.79 63.51 60.96 Gambia 35.40 6.77 10.79 Ghana 1,067.48 329.33 214.65 Guinea 79.53 25.61 14.60 Guinea-Bissau 6.43 4.09 0.42 Kenya 651.41 115.39 99.23 Lesotho 0.64 0.08 0.94 Liberia 173.23 42.34 47.84 Madagascar 64.07 15.25 8.97 Malawi 54.21 6.98 24.77 Mali 49.92 17.59 17.04 Mauritania 245.24 36.08 26.41 Mauritius 42.04 8.38 6.66 Mozambique 306.39 64.13 81.82 Namibia 206.65 33.86 86.26 Niger 46.17 6.82 12.31 Nigeria 6,474.50 1421.49 1338.20 Rwanda 25.20 3.79 5.19 São Tomé and Príncipe 2.00 0.95 0.08 Senegal 230.43 38.70 50.77 Seychelles 12.19 3.28 3.73 Sierra Leone 82.51 14.89 18.54 Somalia 15.05 1.29 17.87 South Africa 7,292.73 2450.96 1534.88 Sudan 88.11 2.38 25.59
  • 3.                                                                                                                                                                                                                                                                                                                                                                                                                                                                       Swaziland 22.94 4.76 6.20 Tanzania 420.19 87.31 56.66 Togo 956.15 64.26 209.24 Uganda 125.13 47.32 24.15 Zambia 141.31 26.90 40.32 Zimbabwe 23,954.54 18.07 14.79  TOTAL 47,909.08 6,391.13 5,261.62 Source: U.S. Dept. of Commerce, Bureau of Census     U.S. IMPORTS ($MILLIONS CUSTOMS VALUE) January-December January-March January-March COUNTRY 2013 2013 2014 Angola 8,745.03 2127.79 1187.87 Benin 3.13 0.91 2.03 Botswana 283.39 52.66 54.05 Burkina Faso 6.11 0.35 0.36 Burundi 4.30 1.60 2.43 Cameroon 366.99 98.10 56.86 Cape Verde 2.36 0.03 0.20 Central African Republic 2.79 2.21 0.20 Chad 2,459.15 495.62 442.59 Comoros 2.84 0.66 0.11 Congo 1,166.56 236.29 84.05 Congo, Dem. Rep. 75.63 9.64 31.17 Côte d'Ivoire 1,002.09 367.43 565.81 Djibouti 3.95 0.88 0.78 Equatorial Guinea 898.00 162.54 43.68 Eritrea 0.09 0.05 0.08 Ethiopia 193.57 28.71 46.96 Gabon 1,110.99 33.53 243.40 Gambia 1.69 0.06 0.10 Ghana 366.19 76.48 71.99 Guinea 98.97 31.82 25.59 Guinea-Bissau 3.22 0.05 0.04 Kenya 450.83 97.14 121.80 Lesotho 358.87 75.40 120.37 Liberia 96.53 23.02 16.43 Madagascar 179.79 44.43 49.53 Malawi 73.13 12.27 11.93 Mali 3.69 0.43 0.42 Mauritania 130.69 0.15 31.39 Mauritius 338.46 82.82 88.37 Mozambique 76.07 9.68 19.67 Namibia 262.64 23.93 67.60
  • 4.                                                                                                                                                                                                                                                                                                                                                                                                                                                                       Niger 2.33 0.62 0.68 Nigeria 11,723.94 3832.14 1285.27 Rwanda 24.45 8.52 6.24 São Tomé and Príncipe 0.25 0.04 0.04 Senegal 16.98 2.92 5.47 Seychelles 5.76 2.61 1.93 Sierra Leone 41.55 4.54 12.58 Somalia 1.19 0.37 0.14 South Africa 8,480.18 2077.36 1914.64 Sudan 10.24 1.31 1.73 Swaziland 58.94 12.44 14.52 Tanzania 70.32 23.63 25.72 Togo 7.72 1.38 3.53 Uganda 47.01 7.96 8.23 Zambia 37.35 11.26 10.86 Zimbabwe 13.89 1.33 8.47 TOTAL 39,309.84 10,085.13 6,687.9 Source: U.S. Dept. of Commerce, Bureau of Census