1.
1 Flow Computers
FLOW COMPUTERS
METERING, MONITORING, & DATA ACQUISITIONS
Sami Halilah
Dynamic Flow Computers
Houston, Texas
GENERAL LAYOUT
This paper presents information about applications of flow computers in the oil and gas industry for (a)
Upstream Production, (b) Midstream Pipeline, and (c) Downstream Refining, Process plants, and
Chemical Plants. Different applications in those three areas are presented in this paper. Some of the
applicable standards are discussed and examples of few hardcopy print out of the flow computer are
presented to provide some idea about the capabilities of the Flow Computers.
UPSTREAM APPLICATION
Upstream applications use the flow computer for metering production fluids coming out of the ground
as produced water, hydrocarbon liquids (crude, condensate, etc.) and gas. Crude oil can be produced
under natural underground pressure or through secondary recovery pressure, generated by injecting
liquid or gas into the reservoir to increase pressure underground and thereby force the oil out.
Sometimes steam is injected into the reservoir, especially for the fields with heavy crude, in order to
reduce its viscosity and mix the crude with condensed stream as produced water. Sometimes high
pressure CO2 is also injected into the ground to increase production.
All these processes require flow computers to measure,
monitor, and sometime control the injected fluids and the
production of the well. The flow computer outputs of the
injection process and production rate provide necessary
information to the reservoir engineer of how effective the
injection process is and also the condition of the well. This
information allows the reservoir engineer to better
understand and estimate, if further action is needed to
increase or optimize production of the reservoir or the well.
The measurement of the production gas flow rate is often
monitored by differential pressure type flowmeters (e.g.
orifice meter, cone meter, etc.) or others devices for measuring gas production and for produced
liquids, typically turbine meter or PD (Positive Displacement) meter is most commonly used. Also, in
many production fields, often separators are used, where a flow
computer is needed to project daily produced water, oil, and gas for each
well. Other parameters often monitored are tank levels, compressors
inlet and outlet pressures and temperature, as well as compressor gas
consumption.
All these above data need to be reported back to the accounting
department and production engineers. Even though they are in different
departments, each need separate sets of data from the flow computer.
Reservoir engineers are interested in tubing‐casing pressures and other
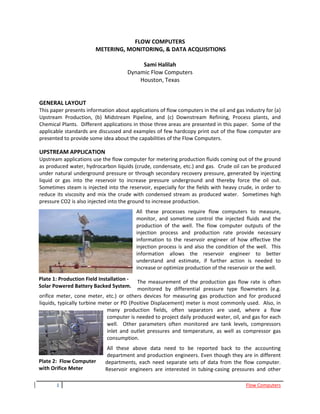
Plate 1: Production Field Installation ‐
Solar Powered Battery Backed System.
Plate 2: Flow Computer
with Orifice Meter
2.
2 Flow Computers
parameters related to response and behavior of wells, while accounting is interested in final
production numbers in order to generate revenue or asset management ticket.
Prior method to obtain these information was manual that utilized chart recorders. In the last several
decades many newer methods have developed that offer many advantages over the old method of
using chart recorders. These methods include Global System for Mobile
Communications (GSM), General Packet Radio Service (GPRS), satellite, radio,
etc. Radio communication is based on licensed or no licensed frequency. The
GSM or GPRS can be used for direct polling and as well as SMS messaging.
Satellite is the most versatile, provided money is not an issue and unless it is
used in short messaging structure with zipped data format. All of these
communication methods require power. If locally power source is not available
a solar package would be required. Solar packages have limitations when there
is no sun for an extended period of time. That may cause the system to go
down and computer data would be lost. Some alternatives like rechargeable
backup battery or thermal or gas turbines power generator may be installed.
These alternate systems are new and relatively expensive. These are some of
the challenges in the power generation.
Test separators are employed to allocate production for each well. Wells often produce three phase
flows where gas, oil, and water are mixed. Knowing how much liquid (oil/water) and gas are being
produced is extremely important to better understand and optimize the performance of each well. A
flow computer is installed to measure across the test separator and thereby, project daily production
rate for each well. These data are very useful for the reservoir engineer in order to better understand
their wells.
Tank levels and compressors are where water and condensate is stored for transmission or delivery.
Operations need to know the liquid levels in order to send a truck to remove the liquid to avoid over
filling or overflow. These data are monitored by the flow computer and transmitted to the control
room or on displays for appropriate or necessary action.
MIDSTREAM APPLICATION
Midstream pipeline are in the transmission or distribution mode for the gas, crude, refined products,
LPGs, and also the petrochemical products. Pipelines need constant monitoring for line pressure,
batches, temperatures, and all the parameters that has to do with
operation and accounting at the base conditions or at conditions
defined by the terms of the contract. Some of the applications for
flow computers include metering, meter proving, valve control,
batching, ticketing, and product interface. This is the most intensive
application for flow computers and requires the flow computer to be
versatile for all applications and handle all the different
requirements. Most of the time multiple ports are used to transmit
data to local operator, to pipe line monitoring system, to local
printer, to the accounting department and possibly to other
customers that need certain information.
The communication package used for that interface would be a real time SCADA application, where
data are retrieved in real time. Ethernet, fiber optics, radio transmission, or satellite can be used to
achieve this transmission.
Plate 3: E‐Chart
Plate 4: Pipeline Application
3.
3 Flow Computers
Type of metering devices is usually different between liquid and gases. Liquid metering requires meter
proving and batching for custody transfer measurement. Each batch might have to be proved to
accommodate the differences in viscosity and product characteristics. Turbine meters, PD meters,
ultrasonic flowmeters, as well as direct mass (Coriolis force) flowmeters are commonly used in these
applications. Densitometer can be used for meters that measure flow rate in volume to insure correct
product gravity and tables to be selected in the flow computer. Densitometers are not needed when
the product gravity is known. There are different algorithms in the flow computer to accommodate
temperature‐pressure corrections and also achieve vapor pressure calculations.
Flow computers in liquid pipeline also monitor pressure and flow
rate information that can provide information to provide leak
detection capability and valve control information. In many
applications flow rate information can be utilize other pipeline
control activities.
Gas pipeline would utilize variety of meters from differential
pressure devices like the standard orifice flow meter, venturi,
nozzle, or cone meters to direct mass meter and Ultrasonic flow
meters. Data are normally transmitted by a radio infrastructure
combined with satellite or GSM setup. Data are needed as fast as
possible. Similar to liquid pipeline application, flow computer output is often used to monitoring, leak
detection, and control.
DOWNSTREAM APPLICATION
Downstream applications include refineries and chemical plants. In refineries and chemical plants flow
computers are used, where accuracy for custody transfer measurement is required. when products are
transferred between the buyer and the seller. A billing system that is approved by local regulatory
agency and parties involved, which is the acceptable method to accomplish measurement, which can
be achieved by a flow computer.
Other measurements inside the plant is normally for indication or
controlling purpose, which are not used for billing but only for
monitoring and verification of process. Data are usually retrieved
by modbus RS485 to DCS or simply the analog out to the DCS for
compensated flow. The DCS will integrate the analog output into
the plant system. Accounting would use the digital data (RS485) or
a daily reading the operator makes inside the plant facility. All types
of meters are used inside the plant from simple differential
pressure type meter (orifice, venture, nozzle, averaging Pitot,
Wedge, Cone, etc.) to MAG (magnetic flowmeter), turbine, PD,
vortex, ultrasonic, and direct mass meters. The type of products
inside the plant could range from crude oil, gas, process gas, steam (saturated and superheated), air,
ethylene, propylene, and many other intermediate products.
INDUSTRY STANDARDS
There are several industry standards that are applicable for flow computers. Primary Industry
standards that flow computers has to comply with are API (American Petroleum Institute), AGA
(American Gas Association), ISO (International Standards Organization), GPA (Gas Processors
Association), and ASTM (American Standards of Testing and Material). Some of the applicable API
Plate 5: Prover Application with
Flow Computer
Plate 6: Plant Application for
Flow Computers
4.
4 Flow Computers
standards are different sections of MPMS Chapters 2, 4, 5, 7, 11, 14, 12, 20, 21, and 22. Similarly
applicable AGA Reports are 3, 4, 5, 7, 8, 9, 10, and 11. There are several GPA and API Tables that must
be implemented into the flow computers to compute corrected liquid and/or gas volumes to the
applicable base condition, which can vary between industries, states, and countries. Sometimes it is
necessary to interface the flow computer with other instruments and analyzers to determine and/or
calculate fluid properties using different tables and empirical equations to obtain corrected volume. In
addition there are different devices that have empirical flow coefficients (e.g. orifice meter, cone
meters, etc.) that must be programmed into the flow computer which often require iterative
computation to determine the corrected flow rate within specified limits of precision. Those details
depend on the type of metering device installed to determine the flow rate.
For liquid flows, flowmeters are often proved on site that require updating meter factors based on field
proving of meters. Some flow computers can be configured to initiate proving if the flowing fluid
properties change beyond acceptable range of application. These installations require dedicated on‐
site provers. Discussion of those configurations is beyond the scope of this presentation.
GENERAL OUTPUT CAPABILITIES:
Flow computers can generate several reports depending on what is required by the user. For liquid
meters, some of the possible reports are
• Alarm Report
• Audit Report
• Snapshot Report
• Hourly Report
• Daily Report
• Batch Report
• Prover Report
Similarly for Gas meters some of the outputs are:
• Snapshot Report
• Choke Report
• Batch Report
• Daily Report
• Hourly Report
Examples of a few of above reports are present here in this paper.
CONCLUSION
The flow computer is the primary part of the custody transfer requirement. Its job is to read raw data
at actual flowing conditions and correct them for the line conditions and to the reference or base
conditions. Then provide the delivery ticket that reflects output the data and the supporting
information and data for the ticket. The flow computer has certain requirements that must be met,
which includes computation accuracy, audit trail, alarm log, and historical data. Additional functions
may be needed, such as ticket printing and meter proving capability of proving information.
ACKNOWLEDGEMENT
Author wishes to acknowledge assistance and support of Dr. Zaki Husain and Steve Baldwin of Chevron
Corporation and Celso Siado of Dynamic Flow Computer in preparing this paper.
6.
6 Flow Computers
BATCH REPORT
Company Name: DFC Unit ID : 1
Date 03/11/10 Time 00:00:00
Batch Opening Date 03/10/10 Time 00:00:00
STREAM #1
ID MTR1 Batch ID BatchID Batch No 4
Location Houston Rec.From Receive1 Ship To Ship1
Product
Name
IC4 Table NEW24
Meter 1
Meter ID MTR1
K Factor 2440.13
Dens. Corr. Factor 1.00000
Open Total Meter 1
IV BBL 253
NSV BBL 249
Mass MLB 48.9
Batch Total Meter 1
IV BBL 135
NSV BBL 134
Mass MLB 26.2
Cumulative Total Meter 1
IV BBL 388
NSV BBL 383
Mass MLB 75.1
Average Meter 1
Temperature �F 80.00
Pressure PSIG 500.0
API 124.6
API@60 121.2
SG 0.5525
SG@60 0.5600
Meter Density 0.5520
Density@60 0.5594
LMF 1.0000
CTL 0.97523
CPL 1.01185
CTPL 0.98679
BSW% 0.00
7.
7 Flow Computers
PROVER REPORT
COMPANY LOCATION
DATE: 00/00/00 TIME: 00:00:00 PRESET: OLD SEAL: NEW SEAL:
PROVER: MFG: MODEL: TAG: SER NO:
TYPE: SIZE: ID (in): 0.000 WT (in): 0.0000
RUNS: 0 PASS: 0 ELASTICITY E+7 (E): 0.0 SHAFT COEF E-7 (GL): 0.0
REPEAT %: 0.000 AREA COEF E-7 (GA) : 0.0 CUBIC COEF E-7 (GC): 0.0
METER : MFG: MODEL: TAG: SER NO:
TYPE: SIZE: TOTALIZER (L) 0
FLUID : TYPE: PE. BAR 0.000 API TABLE: 5/6A/CH.11.2.1.M
RUN NUMBER 1 2 3 4 5 AVERAGE
FORWARD 0 0 0 0 0
TOTAL PULSES 0 0 0 0 0 0.0
INTERP.PULSES 0.0000 0.0000 0.0000 0.0000 0.0000 0.0000
TFMP (s) 0.00000 0.00000 0.00000 0.00000 0.00000 0.00000
TDVOL (s) 0.00000 0.00000 0.00000 0.00000 0.00000 0.00000
METER (C) 0.00 0.00 0.00 0.00 0.00 0.00
PROVER (C) 0.00 0.00 0.00 0.00 0.00 0.00
SWITCHBAR(C) 0.00 0.00 0.00 0.00 0.00 0.00
METER BAR 0.00 0.00 0.00 0.00 0.00 0.00
PROVER BAR 0.00 0.00 0.00 0.00 0.00 0.00
DENSITY@15C 0.0 0.0 0.0 0.0 0.0 0.0
FLOW L/HR. 0 0 0 0 0 0
FREQUENCY (Hz) 0.000 0.000 0.000 0.000 0.000 0.000
________________________ CALCULATION DATA _________________________
PROVER AVERAGE
A. BASE PROVER VOLUME (BPV) (m3)........................................................... 0.0000000
B. CORRECTION FOR TEMPERATURE EFFECT ON PROVER (CTSp).................. 0.00000
C. CORRECTION FOR PRESSURE EFFECT ON PROVER (CPSp)....................... 0.00000
D. CORRECTION FOR TEMPERATURE EFFECT ON LIQUID IN PROVER (CTLp). 0.00000
E. CORRECTION FOR PRESSURE EFFECT ON LIQUID IN PROVER (CPLp)....... 0.00000
P. COMBINED PROVER CORRECTION FACTOR (BxCxDxE)............................. 0.00000
F. CORRECTED PROVER VOLUME (AxP) (m3)................................................ 0
METER
G. TOTAL INTERPOLATED COUNTS............................................................... 0.0000
H. K FACTOR (pulses/m3)............................................................................ 0.00
I. METERED VOLUME (IVM) (m3).................................................................. 0.000000
J. CORRECTION FOR TEMPERATURE EFFECT ON LIQUID IN METER (CTLm).. 0.00000
K. CORRECTION FOR PRESSURE EFFECT ON LIQUID IN METER (CPLm)....... 0.00000
Q. COMBINED METER CORRECTION FACTOR (JxK)....................................... 0.00000
L. CORRECTED METER VOLUME (IxQ) (m3).................................................. 0
M. METER FACTOR (F/L)............................................................................... 0.0000
N. ACTUAL K FACTOR (H/M)......................................................................... 0.00
O. REPEATABILITY % = (MAX-MIN)/MIN x 100............................................. 0.000
_____________________________ PREVIOUS PROVE DATA _____________________
DATE TIME TEMP C PRESS BAR DENS@15C FLOW L/HR. M.F. REPEAT %
00/00/00 00:00:00 0.00 0.00 0.0 0 0.0000 0.000
00/00/00 00:00:00 0.00 0.00 0.0 0 0.0000 0.000
00/00/00 00:00:00 0.00 0.00 0.0 0 0.0000 0.000
ADDITIONAL COMMENTS : _________________________________________________
PROVER OPERATOR: _________________ WITNESSED BY _____________________