Pohl & van genderen 2017 pp.8-13 table 1.2 popular optical remote sensing platforms
•Download as DOCX, PDF•
0 likes•36 views

band specifications for popular satellite

Recommended
More Related Content
More from Muhammad Jazman
More from Muhammad Jazman (9)
Recently uploaded
Recently uploaded (20)
Pohl & van genderen 2017 pp.8-13 table 1.2 popular optical remote sensing platforms
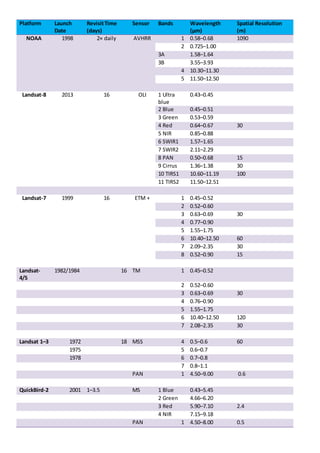
- 1. Platform Launch Date RevisitTime (days) Sensor Bands Wavelength (µm) Spatial Resolution (m) NOAA 1998 2× daily AVHRR 1 0.58–0.68 1090 2 0.725–1.00 3A 1.58–1.64 3B 3.55–3.93 4 10.30–11.30 5 11.50–12.50 Landsat-8 2013 16 OLI 1 Ultra blue 0.43–0.45 2 Blue 0.45–0.51 3 Green 0.53–0.59 4 Red 0.64–0.67 30 5 NIR 0.85–0.88 6 SWIR1 1.57–1.65 7 SWIR2 2.11–2.29 8 PAN 0.50–0.68 15 9 Cirrus 1.36–1.38 30 10 TIRS1 10.60–11.19 100 11 TIRS2 11.50–12.51 Landsat-7 1999 16 ETM + 1 0.45–0.52 2 0.52–0.60 3 0.63–0.69 30 4 0.77–0.90 5 1.55–1.75 6 10.40–12.50 60 7 2.09–2.35 30 8 0.52–0.90 15 Landsat- 4/5 1982/1984 16 TM 1 0.45–0.52 2 0.52–0.60 3 0.63–0.69 30 4 0.76–0.90 5 1.55–1.75 6 10.40–12.50 120 7 2.08–2.35 30 Landsat 1–3 1972 18 MSS 4 0.5–0.6 60 1975 5 0.6–0.7 1978 6 0.7–0.8 7 0.8–1.1 PAN 1 4.50–9.00 0.6 QuickBird-2 2001 1–3.5 MS 1 Blue 0.43–5.45 2 Green 4.66–6.20 3 Red 5.90–7.10 2.4 4 NIR 7.15–9.18 PAN 1 4.50–8.00 0.5
- 2. Platform Launch Date RevisitTime (days) Sensor Bands Wavelength (µm) Spatial Resolution (m) WorldView- 2 2009 1–3.7 MS 1 Coastal 4.00–5.10 2 2 Blue 4.50–5.10 3 Green 5.10–5.80 4 Yellow 5.85–6.25 5 Red 6.30–6.90 6 Red edge 7.05–7.45 7 NIR1 7.70–8.95 8 NIR2 8.60–10.40 PAN 1 0.45–0.90 1 IKONOS 1999 1 MS 1 Blue 0.45–0.52 4 2 Green 0.51–0.59 3 Red 0.63–0.70 4 NIR 0.76–0.85 PAN 1 0.45–0.80 0.4 GeoEye-1 2008 1–9 MS 1 Blue 0.45–0.51 1.65 2 Green 0.51–0.58 3 Red 0.66–0.69 4 NIR 0.78–0.92 Terra/Aqua 1999/2002 0.5 MODIS 1 0.62–0.67 2 0.84–0.88 3 0.46–0.48 4 0.54–0.56 500 5 0.12–0.13 6 0.16–0.17 7 0.21–0.22 8 0.40–0.42 9 0.44–0.45 10 0.48–0.50 11 0.53–0.54 12 0.55–0.56 13 0.66–0.67 14 0.67–0.68 1000 15 0.74–0.75 16 0.86–0.88 17 0.89–0.92 18 0.93–0.94 19 0.92–0.96 20–36a 3.66–14.38