Executive insite CasaVidaWahneta.1.5mile
•
0 likes•34 views

Una data necesaria. Usando la herramienta Mission Insite. (www.missioninsite.com).

Recommended
Recommended
More Related Content
Similar to Executive insite CasaVidaWahneta.1.5mile
Similar to Executive insite CasaVidaWahneta.1.5mile (20)
More from Rodolfo A. Martinez Ochoa
More from Rodolfo A. Martinez Ochoa (20)
Recently uploaded
Recently uploaded (20)
Executive insite CasaVidaWahneta.1.5mile
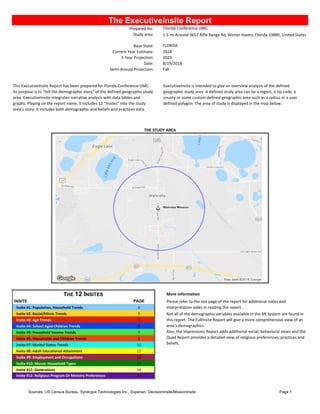
- 1. Sources: US Census Bureau, Synergos Technologies Inc., Experian, DecisionInsite/MissionInsite Page 1 The ExecutiveInsite Report Prepared for: Florida Conference UMC Study area: 1.5 mi Around 3657 Rifle Range Rd, Winter Haven, Florida 33880, United States Base State: FLORIDA Current Year Estimate: 2018 5 Year Projection: 2023 Date: 8/19/2018 Semi-Annual Projection: Fall This ExecutiveInsite Report has been prepared for Florida Conference UMC. Its purpose is to “tell the demographic story” of the defined geographic study area. ExecutiveInsite integrates narrative analysis with data tables and graphs. Playing on the report name, it includes 12 “Insites” into the study area’s story. It includes both demographic and beliefs and practices data. ExecutiveInsite is intended to give an overview analysis of the defined geographic study area. A defined study area can be a region, a zip code, a county or some custom defined geographic area such as a radius or a user defined polygon. The area of study is displayed in the map below. THE STUDY AREA THE 12 INSITES More Information INSITE PAGE Please refer to the last page of the report for additional notes and interpretation aides in reading the report.Insite #1: Population, Household Trends 2 Insite #2: Racial/Ethnic Trends 3 Not all of the demographic variables available in the MI System are found in this report. The FullInsite Report will give a more comprehensive view of an area's demographics. Also, the Impressions Report adds additional social, behavioral views and the Quad Report provides a detailed view of religious preferences, practices and beliefs. Insite #3: Age Trends 4 Insite #4: School Aged Children Trends 6 Insite #5: Household Income Trends 7 Insite #6: Households and Children Trends 9 Insite #7: Marital Status Trends 10 Insite #8: Adult Educational Attainment 11 Insite #9: Employment and Occupations 12 Insite #10: Mosaic Household Types 13 Insite #11: Generations 14 Insite #12: Religious Program Or Ministry Preferences 15
- 2. Sources: US Census Bureau, Synergos Technologies Inc., Experian, DecisionInsite/MissionInsite Page 2 INSITE #1: POPULATION AND HOUSEHOLD TRENDS Population: Households: The estimated 2018 population within the study area is 7,637. The 2023 projection would see the area grow by 592 to a total population of 8,229. The population within the study area is growing somewhat faster than the statewide growth rate. While the study area is projected to grow by 7.8% in the next five years, the state is projected to grow by 6.4%. The study area’s estimated average change rate is 1.6%. The households within the community are growing but not as fast as the population, thus the average population per household in 2010 was 3.82 but by 2023 it is projected to be 3.84. Compare this to the statewide average which for the current year is estimated at 2.53 persons per household. Population Per Household Family Households: Population per Household: The relationship between population and households provides a hint about how the community is changing. When population grows faster than households, it suggests an increase in the persons per household. This can only happen when more persons are added either by birth or other process such as young adults in multiple roommate households or young adults returning to live with parents. In some communities this can occur when multiple families live in the same dwelling unit. Family households provide an additional hint about the changing dynamics of a community. If family household growth follows population growth, then it would be reasonable to assume that the increasing population per household comes from additional children. This is the case within the the study area. Family households are growing as fast as the population suggesting that the increasing population per household is from additional children. Population/Households & Family Trends 2000 2010 2018 2023 2028 Population 5,782 6,727 7,637 8,229 8,880 Population Change 945 910 592 651 Percent Change 16.3% 13.5% 7.8% 7.9% Households 1,638 1,761 1,993 2,144 2,313 Households Change 123 232 151 169 Percent Change 7.5% 13.2% 7.6% 7.9% Population / Households 3.53 3.82 3.83 3.84 3.84 Population / Households Change 0.29 0.01 0.01 0.00 Percent Change 8.2% 0.3% 0.2% 0.0% Families 1,266 1,364 1,555 1,682 Families Change 98 191 127 Percent Change 7.7% 14.0% 8.2% NOTE: Family Household data is not projected out 10 years. Population, Household & Family Trends 2000 2010 2018 2023 2028 0 1,000 2,000 3,000 4,000 5,000 6,000 7,000 8,000 9,000 10,000 Population Households Families* 1.63% 1.69% 1.55% 1.58% Average Annual Percentage Change Between Reported Years 2010 2018 2023 2028 1.5% 1.5% 1.6% 1.6% 1.7% 1.7%
- 3. Sources: US Census Bureau, Synergos Technologies Inc., Experian, DecisionInsite/MissionInsite Page 3 INSITE #2: RACIAL-ETHNIC TRENDS The US population’s racial-ethnic diversity is continually adding new and rich cultural mixes. This data considers the five groups for which trending information is available. Please note that several groups are aggregated into a single category due to their smaller size. Those persons who indicated Hispanic or Latino ethnicity along with a racial category have been separated into a Hispanic or Latino category. The Population: Racial/Ethnic Trends table provides the actual numbers and percentage of the total population for each of the five racial/ethnic categories. Pay special attention to the final column on the right. This will quickly indicate the direction of change from the last census to the current five year projection. The Racial Ethnic Trends graph displays history and projected change by each racial/ethnic group. This chart shows the percentage of each group for the current year estimate. The percentage of the population… Asian (Non-Hisp) is projected to remain about the same over the next five years. White (Non-Hisp) is projected to grow by 0.9% over the next five years. Black/African American (Non-Hisp) is projected to remain about the same over the next five years. Hispanic or Latino is projected to decline by -1.1% over the next five years. 2010 2018 2023 2010% 2018 % 2023 % 2010 to 2023 %pt Change Race and Ethnicity Asian (NH) 53 60 64 0.79% 0.79% 0.78% -0.01% Black/Afr Amer (NH) 232 259 292 3.45% 3.39% 3.55% 0.10% White (NH) 2,606 3,151 3,467 38.74% 41.25% 42.13% 3.39% Hispanic/Latino 3,777 4,098 4,328 56.15% 53.65% 52.59% -3.55% P Is/Am In/Oth (NH) 59 70 78 0.88% 0.92% 0.95% 0.07% Totals: 6,727 7,638 8,229 Racial-Ethnic Population Trends 2010 2018 2023 0 500 1,000 1,500 2,000 2,500 3,000 3,500 4,000 4,500 5,000 Asian (NH) Black/Af Am (NH) White (NH) Hisp/Latino P Is/Am In/Oth (NH) 1% 3% 41% 54% 1% Racial/Ethnicity as Percentage of Pop: 2017 Asian (NH) Black/Af Am (NH) White (NH) Hisp/Latino P Is/Am In/Oth (NH)
- 4. Sources: US Census Bureau, Synergos Technologies Inc., Experian, DecisionInsite/MissionInsite Page 4 INSITE #3: AGE TRENDS A community’s age structure and how it is changing is an important part of its story. Overall, the American Population has been aging as the Baby Boomers progress through each phase of life. This has been abetted by episodes of declining live births. However, this picture may particularize differently from community to community. There are communities in the US where the average age is lower than some others. In other cases, there is a clear shift toward senior years as the Boomers enter their retirement years. The Age Trend Insite explores two variables: Average age and Phase of Life. Average Age Trends provides five important snapshots of a community from five data points; the 2000 census, the last census, the current year estimate, the five-year projection and the ten year forecast. These five numbers will indicate the aging direction of a community. The Phase of Life Trends breaks the population into seven life phases that the population passes through in its life time. AGE Average Age Trends 2000 2010 2018 2023 2028 Average Age: Study Area 30.94 31.31 34.61 36.20 37.55 Percent Change 1.2% 10.5% 4.6% 3.7% Average Age: FL 39.56 40.04 42.01 42.76 43.28 Percent Change 1.2% 4.9% 1.8% 1.2% Comparative Index 78 78 82 85 87 Median Age: Study Area 26 28 31 33 35 Summary of Average Age Findings: The Average Age Trend chart shows both history and projection of the change in average age in the study area. The average age of the study area has been rising for several years. It is projected to rise over the next five years. A comparison to the average age of the state helps to contextualize the significance of the average age of the study area and its history and projection. In the graph above, the study area and state are laid out side by side. The state's average age is estimated to be higher than the study area. 31 31 35 36 38 Study Area Average Age Trend 2000 2010 2018 2023 2028 20 25 30 35 40 45 50 Ave. Age Comparison: Study Area to State 2000 2010 2018 2023 2028 0 5 10 15 20 25 30 35 40 45 50 Study area FL
- 5. Sources: US Census Bureau, Synergos Technologies Inc., Experian, DecisionInsite/MissionInsite Page 5 INSITE #3: AGE TRENDS (continued) PHASE OF LIFE The Phase of Life analysis provides insight into the age distribution of a population across the different stages of life experience. It can reveal a community in transition. Pay special attention to the color codes of the Change column (far right below). It will immediately indicate which phases are increasing or decreasing as a percentage of the population. Phase of Life 2010 2018 2023 2028 2010% 2018% 2023% 2028% Estimated 10 Year %pt Change 2018 - 2028 Before Formal Schooling Ages 0 to 4 644 493 532 577 9.6% 6.5% 6.5% 6.5% 0.0% Required Formal Schooling Ages 5 to 17 1,492 1,631 1,504 1,409 22.2% 21.4% 18.3% 15.9% -5.5% College/Career Starts Ages 18 to 24 778 834 943 1,023 11.6% 10.9% 11.5% 11.5% 0.6% Singles & Young Families Ages 25 to 34 1,078 1,173 1,236 1,321 16.0% 15.4% 15.0% 14.9% -0.5% Families & Empty Nesters Ages 35 to 54 1,634 1,988 2,198 2,413 24.3% 26.0% 26.7% 27.2% 1.1% Enrichment Years Sing/Couples Ages 55 to 64 520 710 815 918 7.7% 9.3% 9.9% 10.3% 1.0% Retirement Opportunities Age 65 and over 581 809 1,001 1,220 8.6% 10.6% 12.2% 13.7% 3.1% Summary of Phase of Life Findings: Phase of Life changes reflect the age profile of a community. On average, it takes 2.1 children per woman to replace both mother and father. If the percentage of the population under 20 is declining as a percentage of the total it is likely that the community will see an increase in the more senior aged population possibly due to a decline in birth rates. In this study area children 17 years of age and younger are declining as a percentage of the total population. Considering the other end of the phases of life, adults 55 years of age and older are increasing as a percentage of the total population. In summary it may be that the community is aging as children are raised and leave but parents remain. 0.0% -5.5% 0.6% -0.5% 1.1% 1.0% 3.1% Phase of Life Changes 0to4 5to17 18to24 25to34 35to54 55to64 65&over -6.0% -5.0% -4.0% -3.0% -2.0% -1.0% 0.0% 1.0% 2.0% 3.0% 4.0%
- 6. Sources: US Census Bureau, Synergos Technologies Inc., Experian, DecisionInsite/MissionInsite Page 6 INSITE #4: SCHOOL AGED CHILDREN TRENDS Children are the future! Understanding their specific population dynamics is critical for all planners of social and/or educational services. The “School Aged Children” variable is a subset of the “Required Formal Schooling” segment in the Phase of Life profile. It allows one to zoom in more closely on the children who are of formal schooling age. The School Aged Children variable provides a snapshot of three levels of the population that comprise school age children. The three levels roughly correspond to the following. · Elementary grades · Intermediate/Middle School grades The school aged population includes all school aged children including those enrolled in public and private schools, those home schooled and children in institutions. · High School grades School Aged Children 2010 2018 2023 2010% 2018% 2023% Estimated 5 Year %pt Change 2018 - 2023 Early Elementary Ages 5 to 9 609 631 478 40.8% 38.7% 31.8% -6.9% Late Elementary-Middle School Ages 10 to 14 545 597 623 36.5% 36.6% 41.4% 4.8% High School Ages 15 to 17 338 403 403 22.7% 24.7% 26.8% 2.1% Summary of School Aged Children Findings: Early Elementary children ages 5 to 9 are projected to decline as a percentage of children between 5 and 17 by -6.9%. High School aged children 15 to 17 are increasing as a percentage of children between 5 and 17 by 2.1%. Late Elementary to Middle School aged children ages 10 to 14 are increasing as a percentage of children between 5 and 17 by 4.8%. Overall, children are aging through, but not being replaced at the younger levels. 101 -94 107 Comparative Index: Study Area to State by Level Early Elem Late Elem/Mid High School -150 -100 -50 0 50 100 150 2018 to 2023 Change 39% 37% 25% 32% 41% 27% School Aged Children Trends: By Levels Early Elem Late Elem/Mid High School 0% 5% 10% 15% 20% 25% 30% 35% 40% 45% 2018 2023
- 7. Sources: US Census Bureau, Synergos Technologies Inc., Experian, DecisionInsite/MissionInsite Page 7 INSITE #5: HOUSEHOLD AND FAMILY INCOME TRENDS AVERAGE HOUSEHOLD INCOME AND PER CAPITA INCOME Average Household Income and Per Capita Income indicate the level of financial resources within a community. Average Household income reflects the average income for each household, whether family or non- family. Per Capita Income is a measure of the average income of all persons within a household. For family households, this would include all children. It does not mean that each person actually contributes to the average income from work. It is calculated by dividing the aggregate household income by the population. In this study area, the estimated current year average household income is $48,757. The average household income is projected to grow by 8.0% to $52,668. The estimated per capita income for the current year is $12,724. The Per Capita Income is projected to grow by 7.8% to $13,722. Income Trends 2010 2018 2023 2010% 2018% 2023% Estimated 5 Year %pt Change 2018 - 2023 Households Less than $10,000 177 136 134 10.0% 6.8% 6.3% -0.6% $10,000 to $14,999 129 115 110 7.3% 5.8% 5.1% -0.6% $15,000 to $24,999 312 384 380 17.7% 19.3% 17.7% -1.6% $25,000 to $34,999 273 303 308 15.5% 15.2% 14.4% -0.8% $35,000 to $49,999 397 300 312 22.5% 15.1% 14.6% -0.5% $50,000 to $74,999 214 373 409 12.1% 18.7% 19.1% 0.4% $75,000 to $99,999 149 224 240 8.5% 11.2% 11.2% -0.1% $100,000 to $149,999 72 140 218 4.1% 7.0% 10.2% 3.1% $150,000 to $199,999 30 13 22 1.7% 0.7% 1.0% 0.4% $200,000 or more 9 4 11 0.5% 0.2% 0.5% 0.3% Totals 1,762 1,992 2,144 $43,113 $48,757 $52,668 Average Household Income Trend 2010 2018 2023 $11,286 $12,724 $13,722 Per Capita Income Trend 2010 2018 2023
- 8. Sources: US Census Bureau, Synergos Technologies Inc., Experian, DecisionInsite/MissionInsite Page 8 INSITE #5: HOUSEHOLD AND FAMILY INCOME TRENDS (continued) FAMILY INCOME Family income is a sub-set of household income. It excludes non-family households. Family households include two or more persons who are related and living in the same dwelling unit. Children are more likely to live in family households. Non-family households are households in which two or more persons live in the same dwelling unit but are unrelated. The number of families with annual incomes above $100,000 is projected to decline over the next five years. For the current year, it is estimated that 7.2% of all family incomes exceed $100,000 per year. In five years that number is projected to be 7.1%. Income Trends 2018 2023 2018% 2023% Estimated 5 Year %pt Change 2018 - 2023 Families Less than $10,000 50 53 3.2% 3.2% -0.06% $10,000 to $14,999 67 70 4.3% 4.2% -0.14% $15,000 to $24,999 316 335 20.3% 19.9% -0.39% $25,000 to $34,999 226 254 14.5% 15.1% 0.58% $35,000 to $49,999 300 324 19.3% 19.3% -0.02% $50,000 to $74,999 303 327 19.5% 19.5% -0.03% $75,000 to $99,999 181 198 11.6% 11.8% 0.14% $100,000 to $149,999 96 104 6.2% 6.2% 0.01% $150,000-$199,999 13 13 0.8% 0.8% -0.06% $200,000 or more 3 3 0.2% 0.2% -0.01% Totals 1,555 1,681 MEDIAN INCOME BY RACE AND ETHNICITY Median income by race and ethnicity is a subset of household income. Median income is that point where there are as many households with incomes greater than the median as there are households with incomes less than the median. Median Income by Race and Ethnicity 2018 Asian Household Income $26,666 Black/ African American Household Income $18,928 Hispanic/Latino Household Income $33,350 White/Anglo Household Income $43,189 P Is, Am Indian Other Household Income $26,249 Average $29,676 Median Household Income by Race and Ethnicity Asian Household Incom e Black/ African Am erican Household Hispanic/Latino Household Incom e W hite/Anglo Household Incom e P Is, Am Indian Other Household $0 $10,000 $20,000 $30,000 $40,000 $50,000
- 9. Sources: US Census Bureau, Synergos Technologies Inc., Experian, DecisionInsite/MissionInsite Page 9 INSITE #6: HOUSEHOLDS AND CHILDREN TRENDS Diversity of child rearing environments is increasing along with the many other types of growing diversity in the US. To understand this, we begin with the types of households that exist in a community. There are… The concern of this analysis is family households with children under 18. Of the types of family households with children there are… • family households with children under 18 • Married couple families • family households without children under 18 • Single parent families (father or mother) These two are reported for the study area in the table below. Households 2010 2018 2023 2010% 2018% 2023% Estimated 5 Year %pt Change 2018 - 2023 Households with Children under 18 Married Couple 527 381 363 64.2% 54.1% 50.1% -4.1% Single Parent 294 323 362 35.8% 45.9% 49.9% 4.1% Of the households with children under 18, married couple households are decreasing as a percentage while single parent households are increasing. The graph to the right illustrates this. Bars above the 0% point indicate a family type that is increasing while bars below 0% is decreasing. This provides "insite" into how family households and structures with children are changing in the study area. A comparison to the state reveals to what extent this community is similar or dissimilar to the state as a whole. The study area's married couple households with children are similar to the state's profile. The percentage of single parent households with children is less than the state. -4.1% 4.1% Households with Children: Projected Change Married Couple Families Single Parent Families -6% -4% -2% 0% 2% 4% 6% Households with Children Under 18 Compared to State Family: Married-couple Family: Single Parent 0% 10% 20% 30% 40% 50% 60% 70% 2018% FL 2018% of Total 54.1% 45.9% Percentage of Households with Children by Type Married Couple Single Parent
- 10. Sources: US Census Bureau, Synergos Technologies Inc., Experian, DecisionInsite/MissionInsite Page 10 INSITE #7: MARITAL STATUS TRENDS MARITAL STATUS BY TYPE Population by Marital Status considers the number and percentage of persons 15 years of age and greater by their current marital status. Trend information as well as a comparison to the study area’s state marital status types provide two different views of this social reality. Marital types reported include.. • Never Married (Singles) • Currently Married • Divorced • Separated • Widowed 2010 2018 2023 2010% 2018% 2023% 2010 to 2023 %pt Change Population by Marital Status: Age 15+ Never Married 1,426 2,131 2,389 28.3% 35.2% 35.4% 7.1% Married 3,023 3,110 3,468 60.0% 51.4% 51.4% -8.6% Divorced 323 455 499 6.4% 7.5% 7.4% 1.0% Separated 89 113 124 1.8% 1.9% 1.8% 0.1% Widowed 174 240 268 3.5% 4.0% 4.0% 0.5% In this community, the current year estimate of marital status reveals a community of adults more likely to be married than the state average for adults. The percentage single, never married in the study area is higher than the state average for adults 15 years and older. Divorce is less prevalent than the state wide average. Women 15 years and older are less likely to be divorced than men. Women 15 years and older are more likely to be widowed than men. 123 104 -62 -73 -54 Marital Status: Comparison to the State Never Married Married Divorced Separated Widowed -100 -50 0 50 100 150 Single Female and Male Comparison by Type (CY) Divorced Never Married Widowed 0% 10% 20% 30% 40% 50% 60% 70% 80% 90% Female Male
- 11. Sources: US Census Bureau, Synergos Technologies Inc., Experian, DecisionInsite/MissionInsite Page 11 INSITE #8: ADULT EDUCATIONAL ATTAINMENT The level of educational attainment of a community’s adult population is an important indicator of its opportunities and challenges. This analysis will look at the Adult Educational Attainment from three perspectives. First, it looks to see if the level of educational attainment for adults is rising or not. Second, it compares the level of attainment to that of the state of FLORIDA. (If this is a state report, the comparison will be to itself.) Finally, the table provides the percentages from 2010. EDUCATIONAL LEVEL ATTAINMENT CHANGE The educational attainment level of adults has declined over the past few years. It is projected to rise over the next five years by 0.4%. EDUCATIONAL LEVEL COMPARED TO THE STATE 2010 2018 2023 FL 2018% 2018 Study Area-State Comp Index The overall educational attainment of the adults in this community is lower than the state. Population by Educational Attainment: 25+ Less than 9th Grade 28.3% 21.7% 20.1% 5.2% 421 Some HS 18.4% 15.3% 13.9% 7.5% 203 HS Dipl or GED 37.0% 40.0% 42.0% 29.0% 138 Some College 10.1% 11.2% 11.8% 20.6% 55 Associate Degree 1.4% 5.0% 5.2% 9.6% 52 Bachelor's Degree 4.5% 4.6% 4.6% 18.0% 25 Grad/Profess Deg 0.3% 2.2% 2.3% 10.2% 22 -3% 0% Projected Change in Adult Educational Attainment HS or Less Assoc Degree or Greater -4.0% -3.0% -2.0% -1.0% 0.0% 1.0% 21.7% 15.3% 40.0% 11.2% 5.0% 4.6% 2.2% 5.2% 7.5% 29.0% 20.6% 9.6% 18.0% 10.2% Comparison of Study Area to State Less than 9th Grade Some HS HS Dipl or GED Some College Associate Degree Bachelor's Degree Grad/Profess Deg 2018% FL 2018%
- 12. Sources: US Census Bureau, Synergos Technologies Inc., Experian, DecisionInsite/MissionInsite Page 12 INSITE #9: POPULATION BY EMPLOYMENT Like educational attainment, an analysis of a community by its employment types and categories provides an important “insite” into its socio-economics. This analysis looks at two factors. First is a report of the employed population 16 and over by the traditional “blue collar” and “white collar” occupations and compares these to the state. Second, it looks at the community by the seven standard census bureau occupations and compares them to the state. EMPLOYED POPULATION: BLUE COLLAR OR WHITE COLLAR On the chart to the left, the study area is compared to the state of FLORIDA. This study area is well below the state average for White Collar workers. It is well above the state average for Blue Collar workers. EMPLOYED CIVILIAN POPULATION BY OCCUPATION 2018 FL 2018 Comp. Index Interpretation Employed Civilian Pop 16+ by Occupation Bldg Maintenance & Cleaning 4.3% 5.0% 86 Well below the state average. Construction 18.1% 8.4% 215 Well above the state average. Farming, Fishing, & Forestry 15.1% 0.7% 2195 Well above the state average. Food Preparation Serving 5.7% 6.6% 87 Well below the state average. Healthcare Support 1.4% 2.6% 56 Well below the state average. Managerial Executive 9.0% 14.6% 61 Well below the state average. Office Admin 9.5% 14.1% 67 Well below the state average. Personal Care 1.3% 3.4% 39 Well below the state average. Production Transportation 16.4% 9.0% 181 Well above the state average. Prof Specialty 8.4% 20.0% 42 Well below the state average. Protective 2.4% 2.6% 95 At about the state average. Sales 8.4% 13.0% 65 Well below the state average. 63.3% 36.7%35.8% 64.2% Comparison of Blue and White Collar Employment Blue Collar White Collar 0% 10% 20% 30% 40% 50% 60% 70% 2018% FL 2018% 63.3% 36.7% Percentage White to Blue Collar Blue Collar White Collar
- 13. Sources: US Census Bureau, Synergos Technologies Inc., Experian, DecisionInsite/MissionInsite Page 13 INSITE #10: MOSAIC Segments Mosaic is a geo-demographic segmentation system developed by and for marketers. Instead of looking at individual demographic variables, a segmentation system clusters households into groups with multiple common characteristics. Demographic variables that generally cluster together would include income, educational levels, presence of children and occupations among others. This database is developed by Experian. Some find the information helpful because it presents a multi-dimensional view of a community. In the report below, the top 15 Mosaic Segments of the study area are provided. (If less than 15, rows will be blank.) NOTE: For a full description please see the DI Demographic Segment Guide (Mosaic) under the Help menu on the Documents gallery. 2018 2018% State % Comp Index Relative to the FL State Ave. Mosaic Segments P59 Cultural Connections - Expanding Horizons 1,052 52.8% 0.7% 7498 Well above the state average Q64 Golden Year Guardians - Town Elders 224 11.2% 4.8% 233 Well above the state average R66 Aspirational Fusion - Dare to Dream 136 6.8% 1.4% 485 Well above the state average I33 Family Union - Balance and Harmony 91 4.6% 1.8% 258 Well above the state average P60 Cultural Connections - Striving Forward 69 3.5% 0.9% 404 Well above the state average L43 Blue Sky Boomers - Homemade Happiness 62 3.1% 1.7% 178 Well above the state average O51 Singles and Starters - Digital Dependents 62 3.1% 4.7% 66 Somewhat below the state average D15 Suburban Style - Sports Utility Families 40 2.0% 0.6% 344 Well above the state average J36 Autumn Years - Settled and Sensible 33 1.7% 1.9% 89 Somewhat below the state average M45 Families in Motion - Diapers and Debit Cards 30 1.5% 0.7% 228 Well above the state average M44 Families in Motion - Red, White and Bluegrass 25 1.3% 0.7% 188 Well above the state average L42 Blue Sky Boomers - Rooted Flower Power 20 1.0% 3.9% 26 Well below the state average E20 Thriving Boomers - No Place Like Home 17 0.9% 2.0% 43 Well below the state average E21 Thriving Boomers - Unspoiled Splendor 16 0.8% 1.1% 74 Somewhat below the state average N48 Pastoral Pride - Rural Southern Bliss 14 0.7% 1.2% 61 Learn about your Mosaic Households To access Mosaic Portrait data click on: Mosaic USA E-Handbook by Experian (To open in a new Tab hold Control key when you click on the link) Handbook includes Mosaic Overview and two graphic pages for each of the 19 Groups and 71 Segments. For faith based clients, to access the Mosaic application guide click on: Mission Impact Mosaic Application Guide by Bandy (To open in a new Tab hold Control key when you click on the link)
- 14. Sources: US Census Bureau, Synergos Technologies Inc., Experian, DecisionInsite/MissionInsite Page 14 INSITE #11: GENERATIONS A powerful way to envision demographics is by following a generation through its phases of life. This is because there are, in a general sense, common life experiences at each phase of life. But even more interesting is to understand a generational cohort group that has a unique sense of belonging to others born and coming of age together. More than mere age bracketing, a generation develops a sense of identity as a group based upon their coming of age experiences—how they were parented and major world defining events, such as 9/11. Using the Strauss and Howe model of generations one is able to see a more three-dimensional view of a generational group, bringing mere age demographics to life. According to the Strauss and Howe model, members of a generation share three qualities. * • An age location in history • Some common beliefs and behaviors, including basic attitudes about risk taking, culture and values, civic engagement, and family life • A common perceived membership in a generation, e.g., Boomers, Gen X, Millennials etc. (* http://www.lifecourse.com/about/method/phases.html) Name S & H Type Initial Birth Yr Final Birth Yr 2010 2018 2023 2028 Homeland (Z)Artist 2005 2025 645 9.7% 1,477 19.6% 2,036 25.2% 2,570 29.9% Millennial (Y) Hero 1982 2004 2,609 39.4% 2,777 36.9% 2,857 35.4% 2,971 34.6% Gen X (13th) Nomad 1961 1981 1,918 29.0% 1,992 26.4% 2,026 25.1% 2,040 23.7% Boom Prophet 1946 1960 865 13.1% 849 11.3% 827 10.2% 799 9.3% Silent Artist 1925 1945 530 8.0% 390 5.2% 283 3.5% 176 2.0% GI Hero 1901 1924 51 0.8% 49 0.7% 47 0.6% 36 0.4% Totals: 6,618 100.0% 7,534 100% 8,076 100% 8,593 100.0% For more information on Generational types, go to http://www.fourthturning.com/ Strauss and Howe Generations: Projected Percentages 2010 2018 2023 2028 0% 5% 10% 15% 20% 25% 30% 35% 40% 45% Homeland (Z) Millennial (Y) Gen X (13th) Boom Silent GI 19.6% 36.9% 26.4% 11.3% 5.2% 0.7% Generations Current Year Percentage Homeland (Z) Millennial (Y) Gen X (13th) Boom Silent GI
- 15. Sources: US Census Bureau, Synergos Technologies Inc., Experian, DecisionInsite/MissionInsite Page 15 INSITE #12: RELIGIOUS PROGRAM OR MINISTRY PREFERENCES This information is from the 2017 Quadrennium Project Survey conducted by MissionInsite of US Religious Preferences, Practices and Beliefs called the Quadrennium Project. The complete survey results are available in the four Predesigned Quad Reports; ReligiousInsite, ReligiousInsite Priorities, MinistryInsite or MinistryInsite Priorities. The Quadrennium White Paper is available on the web site. Study Area US Average Comparative Index Modestly Important Very Important Modestly Important Very Important Modestly Important Very Important Personal Growth 38.4% 11.3% 33.9% 7.3% 113 154 Addiction support groups 39.8% 12.0% 29.1% 7.7% 137 156 Health/weight loss programs 35.3% 13.6% 34.4% 7.5% 103 181 Practical training seminars 40.1% 8.3% 38.1% 6.7% 105 123 Family Support and Intervention Services 43.9% 14.0% 36.5% 10.5% 120 133 Crisis support groups 40.9% 13.9% 41.9% 10.1% 98 137 Daycare/After-School Programs 29.0% 10.3% 27.2% 7.8% 107 132 Family oriented activities 45.0% 21.6% 42.6% 17.5% 105 124 Marriage enrichment 39.8% 12.5% 36.5% 9.7% 109 129 Parenting development 34.9% 9.7% 30.9% 7.9% 113 123 Personal/family counseling 45.9% 11.7% 40.0% 10.1% 115 116 Community Involvement and Advocacy Programs 50.7% 17.5% 47.7% 13.8% 106 127 Adult social activities 45.6% 15.0% 52.1% 14.4% 88 104 Involvement in social causes 42.8% 15.7% 47.4% 13.6% 90 116 Social justice advocacy work 45.2% 12.8% 40.5% 11.5% 112 112 Opportunities for volunteering in the community 47.7% 16.9% 50.8% 15.8% 94 107 Community Activities or Cultural Programs 46.8% 14.4% 43.3% 12.9% 108 112 Cultural programs (music, drama, art) 38.1% 18.8% 46.5% 11.3% 82 166 Holiday programs/activities 47.5% 16.6% 49.8% 14.5% 95 114 Seniors/retiree activities 38.1% 17.7% 41.9% 13.4% 91 132 Youth social activities 35.0% 16.9% 35.1% 12.3% 100 137 Religious/Spiritual Programs 31.7% 24.1% 37.4% 18.1% 85 134 Bible or Scripture study/prayer groups 34.9% 21.2% 32.6% 15.9% 107 134 Christian education for children 30.4% 18.8% 29.5% 14.9% 103 126 Contemporary worship experiences 40.1% 12.0% 39.1% 11.5% 103 104 Spiritual discussion groups 37.6% 19.8% 39.0% 11.6% 96 170 Traditional worship experiences 39.5% 25.9% 38.9% 20.7% 102 125 Warm and friendly encounters 45.2% 34.6% 45.3% 33.8% 100 102 The quality of sermons 16.9% 16.5% 36.9% 28.5% 46 58
- 16. Sources: US Census Bureau, Synergos Technologies Inc., Experian, DecisionInsite/MissionInsite Page 16 Supporting Information Interpreting the Report The ExecutiveInsite report is designed for easy reading. But there are several tools provided in the tables that make this easier. Indexes: Some variables will have a column called "Comparative Index." An index is an easy way to compare a study area with a larger area. For this report, all comparisons are with the state or states within which the study area falls. The indexes can be interpreted as follows.Change over time: Several trend tables have a column indicating a change over time. Generally these tables begin with the last census, include the current year estimate, a five year projection and if available, a 10 year forecast. The data in each cell represents a percentage change up or down. • Indexes of 100 mean the study area variable is the same as its base area. • Indexes greater than 100 mean the study area variable is above the base area. The higher the number, the greater it is above the base. Color Coding: Both the "Change over Time" and "Comparative Indexes" columns are color coded to easily spot any change and the direction of that change. • Indexes less than 100 mean the study area variable is below the base area. The lower the number, the greater it is below the base. Change: Increasing Stable Declining Index: Above Ave Ave Below Ave. Variable Definitions Support Full variable definitions can be found in the MI Demographic Reference Guide. Download it free from the Help/Documents menu located on the map screen of your study area on the MissionInsite website. If you need support with this report, please email MissionInsite at misupport@missioninsite.com.