1. retail Trends Report
Greater Columbus Region
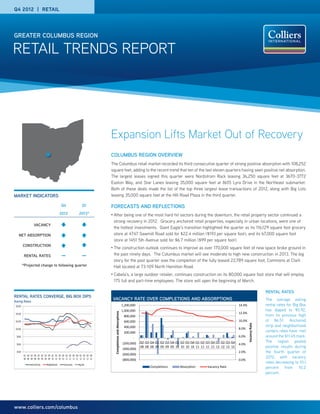
www.colliers.com/columbus
Expansion Lifts Market Out of Recovery
Columbus Region OverView
The Columbus retail market recorded its third consecutive quarter of strong positive absorption with 108,252
square feet, adding to the recent trend that ten of the last eleven quarters having seen positive net absorption.
The largest leases signed this quarter were Nordstrom Rack leasing 36,250 square feet at 3670-3772
Easton Way, and Star Lanes leasing 35,000 square feet at 8655 Lyra Drive in the Northeast submarket.
Both of these deals made the list of the top three largest lease transactions of 2012, along with Big Lots
leasing 35,000 square feet at the Hill Road Plaza in the third quarter.
Forecasts and Reflections
• After being one of the most hard hit sectors during the downturn, the retail property sector continued a
strong recovery in 2012. Grocery anchored retail properties, especially in urban locations, were one of
the hottest investments. Giant Eagle’s transition highlighted the quarter as its 116,129 square foot grocery
store at 4747 Sawmill Road sold for $22.4 million ($193 per square foot), and its 67,000 square foot
store at 1451 5th Avenue sold for $6.7 million ($99 per square foot).
• The construction outlook continues to improve as over 170,000 square feet of new space broke ground in
the past ninety days. The Columbus market will see moderate to high new construction in 2013. The big
story for the past quarter was the completion of the fully leased 22,789 square foot, Commons at Clark
Hall located at 73-109 North Hamilton Road.
• Cabela’s, a large outdoor retailer, continues construction on its 80,000 square foot store that will employ
175 full and part-time employees. The store will open the beginning of March.
Market indicators
Rental Rates Converge, BiG Box Dips
Asking Rates
Q4
2012
Q1
2013*
Vacancy
Net absorption
construction
Rental Rates — —
*Projected change to following quarter
Q4 2012 | Retail
$4.00
$6.00
$8.00
$10.00
$12.00
$14.00
$16.00
Q1
08
Q2
08
Q3
08
Q4
08
Q1
09
Q2
09
Q3
09
Q4
09
Q1
10
Q2
10
Q3
10
Q4
10
Q1
11
Q2
11
Q3
11
Q4
11
Q1
12
Q2
12
Q3
12
Q4
12
AnchoredStrip Neighborhood Community Big Box
0.0%
2.0%
4.0%
6.0%
8.0%
10.0%
12.0%
14.0%
(800,000)
(600,000)
(400,000)
(200,000)
-
200,000
400,000
600,000
800,000
1,000,000
1,200,000
Q2
08
Q3
08
Q4
08
Q1
09
Q2
09
Q3
09
Q4
09
Q1
10
Q2
10
Q3
10
Q4
10
Q1
11
Q2
11
Q3
11
Q4
11
Q1
12
Q2
12
Q3
12
Q4
12
VacancyRate
CompletionsandAbsorptions
Completions Absorption Vacancy Rate
Vacancy Rate over completions and absorptions
Rental Rates
The average asking
rental rates for Big Box
has dipped to $5.92,
from its previous high
of $6.51. Anchored
strip and neighborhood
centers rates have met
around the $11.45 mark.
The region posted
positive results during
the fourth quarter of
2012, with vacancy
rates decreasing to 10.1
percent from 10.2
percent.
2. Fundamentals
Three sources are helpful when gauging retail consumer
activity: the consumer confidence index, a weekly poll
conducted by Gallup, and the Beige Book produced by
the Federal Reserve Bank semi-quarterly.
The consumer confidence index is produced by The
Conference Board and is a survey of how confident
consumers are in the current economic conditions by
their spending and saving habits. The Conference
Board Consumer Confidence Index, which had declined
slightly in November, posted another decrease in
December. The Index now stands at 65.1, down from
71.5 in November. The Expectations Index declined
sharply to 66.5 from 80.9. The Present Situation Index
increased to 62.8 from 57.4 last month. The sudden
turnaround in expectations was most likely caused by
uncertainty surrounding the oncoming fiscal cliff.
Gallup’s consumer spending measure tracks the
average dollar amount Americans report spending or
charging on a daily basis, not counting the purchase of
a home, motor vehicle, or normal household bills. Over
the three month period between October and December,
the 14-day rolling average rose from $76 to $83 with a
high of $90 during the week leading up to Christmas.
That is up from $73 in November and the highest
monthly figure Gallup has reported since December
2008. It is also the first reading above the $80 mark
since the 2008-2009 recession.
The Cleveland Federal Reserve reports on consumer
spending twice a quarter in the Beige Book, and data
comes from qualitative surveys of retailers in the fourth
district, which includes Columbus. Total retail sales
increased 0.5 percent in December, following a 0.4
percent increase in November. A significant chunk of
that growth over the past two months has been driven
by autos sales. Excluding autos, retail sales increased
0.3 percent in December and fell 0.1 percent in
November. Still, over the past 12 months, the growth
rate in overall sales (up 4.7 percent) is outpacing the
ex-autos trend (4.1 percent).
The Federal Reserve Bank of Cleveland reports at least
once a quarter in the Federal Reserve’s Beige Book
about the construction activity in the fourth district,
which includes the Columbus Metropolitan Statistical
Area (MSA). At the beginning of December, the Beige
Book reported new multi-family construction spending
increased 0.5 percent, and is up 45.9 percent year-
over-year. Private nonresidential construction spending
decreased 0.7 percent over the month to $294.5 billion
and is up 8.2 percent year-over-year. The only positive
sectors were transportation and communication, with
monthly gains of 3.4 and 2.8 percent, respectively.
The Columbus retail market includes 11
suburban submarkets and the Central
Business District. This includes a total
inventory of 60 million square feet of
space with only 1 million of that space in
the CBD.
update New Supply, Absorption and Vacancy Rates
sales activity
Property Address sales date sale price size SF Grantor Grantee
Price
/ Sf type submarket
4747 Sawmill Rd 11/6/12 $22,400,000 116,129 Echo Continental Hilliard LLC Retail Properties of America $193 Big Box Northwest
1451 W. 5th Ave 12/13/12 $6,650,000 67,000 Broadview Company LLC Kohr Royer Griffith Inc. $99 Big Box Southwest
4889 Chatterton Road 11/28/2012 $1,234,468 48,856 GD C Associates Dembena LLC $25 Neighborhood Center Southeast
5662 Broad Street 10/24/2012 $3,300,000 28,538 Viking Partners Galloway LLC FIDC XX LLC $116 Neighborhood Center Northwest
5536 Hamilton Road 10/04/2012 $1,605,000 19,546 Retail Properties Ltd Gosula Estates Ltd $82 Conv/Strip Center Northeast
5236-72 Cleveland Avenue 10/09/2012 $670,000 17,000 Retail Properties Ltd Marion Investment Company $40 Conv/Strip Center Northeast
6320 E. Main Street 10/26/2012 $4,800,000 14,668 Reynoldsburg W Investment LLC Reynoldsburg Wag LLC $327 Freestanding Southeast
1144 Norton Road 11/06/2012 $730,000 13,344 Anchor L Investment I Ltd Potts Land Investments LLC $55 Conv/Strip Center Southwest
4345 Cleveland Avenue 11/20/2012 $400,000 11,500 Cityvilla Investments LLC Mt Sinai Church of God $35 General Northeast
4784 N. High Street 10/24/2012 $635,000 10,933 GNWLAAC Real Estate Holding LLC Saha Properties LLC $58 Freestanding Northwest
Delaware County
Pickaway County
Union
County
Madison
County
Licking
County
Fairfield
County
North /
Northeast
Southeast
Southwest
Northwest
CBD
Lease activity
Property Address Lease Sf Total Size Lessee Asking price Type Submarket
3670-3772 Easton Way 36,250 506,911 Nordstrom Rack - Power Center Northeast
8655-8669 Lyra Drive 35,074 41,889 Polaris Entertainment Partners - Anchored Strip Center Northeast
10-128 Dillmont Drive 18,900 106,832 Planet Fitness $14 Neighborhood Center Northwest
1627-1735 N. Memorial Drive 8,598 179,487 Veterans Administration $12 Power Center Fairfield
3670-3772 Easton Way 8,000 506,911 Tilly's - Power Center Northeast
3596-3694 E. Main Street 7,153 12,000 Deals and Steals $10 Neighborhood Center Northeast
7107 E. Main Street 6,560 6,560 Buyback Entertainment $10 Freestanding Southeast
8269-8333 Lazelle Road 6,400 28,000 Royalty Child Care Center $13 Conv/Strip Center Northeast
p. 2 | Colliers International
research & forecast report | Q4 2012 | Retail | Greater Columbus Region
3. Employment
Unemployment is a reasonably low
5.5 percent in Columbus, and the
private sector is gaining momentum.
Unemployment dropped from 7.3
percent to 5.5 percent, 180 basis
points, in 2012
update Market Comparisons
Retail market
Net Absorption Construction Asking Rental Rates
Submarket Total SF Vacant SF Vacancy % Current Quarter Year-to-date Current Completions Neighborhood Power
CBD 1,102,826 51,399 4.7% - 1,200 71,735 11,000 $12.00 -
Fairfield 3,960,854 396,341 10.0% (182) 73,082 - - $14.31 $11.67
LICKING 3,960,108 291,895 7.4% 15,083 75,040 - - $13.00 $11.81
mADISON 214,406 18,772 8.8% 6,340 (15,827) - - - -
NORTH DELAWARE 2,190,769 139,920 6.4% (2,638) (37) - - - $13.00
nORTHEAST 16,909,033 868,116 5.1% 67,095 80,065 25,640 22,789 $14.02 $14.11
nORTHWEST 13,185,712 1,200,784 9.1% 18,052 (42,060) 147,500 - $11.05 $15.27
pICKAWAY 656,177 6,150 1.0% - - - - $8.50 -
SOUTHEAST 10,036,965 1,482,722 14.8% 6,625 (52,756) - - $8.90 $11.42
sOUTHWEST 7,092,147 1,547,148 21.9% 10,557 66,034 92,000 - $10.12 $7.78
UNION 1,161,503 79,725 6.9% - (33,786) - - - $16.00
TOTALS 60,494,500 6,082,972 10.1% 108,252 150,955 336,875 33,789 $11.40 $12.21
Net Absorption Construction Asking Rental Rates
Property Type Total SF Vacant SF Vacancy % Current Quarter Year-to-date Current Completions (NNN)
Anchored Strip Center 11,984,834 1,398,078 11.7% 38,097 74,029 83,140 - $11.49
Big Box 7,635,821 813,021 10.6% 1,200 69,105 172,000 - $5.92
Community 4,140,660 577,099 13.9% 4,310 (37,287) - - $10.58
Conv/Strip Ctr 3,553,440 301,380 8.5% 11,304 31,097 - 22,789 $12.01
Freestanding 4,019,270 275,680 6.9% 36,761 57,811 71,735 - $10.51
Neighborhood 5,469,160 751,538 13.7% 8,204 22,739 10,000 - $11.40
Power 15,943,693 1,205,906 7.6% 14,716 (34,419) - - $12.21
Regional Ctr 663,236 136,200 20.5% - - - - $10.22
Strip 133,012 33,320 25.1% - (33,320) - - $12.35
Supr Reg Ctr 6,431,125 590,750 9.2% - - - - $12.03
Urban Retail 520,249 - 0.0% - 1,200 - 11,000 -
TotalS 60,494,500 6,082,972 10.1% 108,252 150,955 336,875 33,789 $11.10
quarterly comparison and totals
Net Absorption Construction Asking Rental Rates
Quarter, year Total SF Vacant SF Vacancy % Current Quarter Year-to-date Current Completions Neighborhood Power
Q3, 2012 60,494,500 6,198,833 10.2 41,157 39,054 231,000 180,000 $11.82 $11.68
Q2, 2012 60,288,465 6,522,146 10.8 110,275 (4,478) 352,789 - $12.35 $12.03
Q1, 2012 60,288,465 6,632,421 11.0 (112,378) (112,378) 280,000 - $10.80 $11.07
Q4, 2011 60,288,465 6,523,775 10.8 187,621 489,194 70,000 27,000 $11.66 $12.93
research & forecast report | Q4 2012 | Retail | Greater Columbus Region
Colliers International | p. 3
4. CBD
The Central Business District (CBD) absorption
remains flat, but activity is sure to increase in the
coming quarters as more multi-family construction
projects begin and are completed, opening the way for
new retail opportunities. Construction continues on
nearly 1,500 new units: Flats on Vine II (120), The
Goodale (174), Liberty Place Phase II (200), Columbus
Commons (300), Harrison Park (108), Aston Place
(59), Liberty Crossing II (200), and Neighborhood
Launch Apartments (260).
North
The north submarkets include Northwest, Northeast,
and North Delaware. The Northwest submarket saw
18,052 square feet of positive absorption from a large
vacancy filled at 64 Wilson Bridge Road in the
Worthington Square. The following retailers signed
leases in the revitalized mall this past quarter: Pies and
Pints (4,500 square feet), Farmers Market (4,071),
Learning Express (2,731), Simply Baby (2,065), Face
Forward (1,908), Modealise (1,791), Montero Native Art
(1,788), Nattie Cakes (1,089), and Big Shot Sportswear
(907). Planet Fitness signed an 18,900 square foot
lease at 10 Dillmont Drive.
North-Delaware saw 2,638 square feet of negative
absorption this past quarter; however Golf ETC signed
3,232 square feet of space at 1400 Gemini Place in
The Gemini Place Town Center.
The Northeast submarket led the market in 2012, with
80,065 square feet of positive absorption, and lost no
momentum this quarter after posting another 67,095
square feet of positive absorption. Star Lanes signed
a 35,000 square foot lease to occupy the old Circuit
City freestanding building at 8655 Lyra Drive. The
Commons at Clark Hall development on the corner of
North Hamilton Road and Granville Street was
completed this quarter, adding over 22,789 square feet
of positive absorption. The Rusty Bucket, Smash
Burger, Panera, Chiptole, AT&T, Gahanna Vision,
Menchies Frozen Yogurt, and Supercuts occupy the
convenience strip center that recently open.
South
The southern submarkets are Southeast and
Southwest. The Southeast saw insignificant positive
absorption of 6,625 square feet as five suites totaling
18,500 square feet were occupied at 6300 E.
Livingston Avenue. The Southwest submarket saw
limited activity in the fourth quarter, as three deals
(Shihab Law, QT Nails, and Infinity Staffing Solutions)
totaling 5,000 square feet filled vacancies in the West
Broad Plaza.
Vacancy in the southwest submarket remains the
highest in the region at 22 percent. (See Page 2 for
more Investment Sales Activity information)
East
The eastern submarkets are Licking and Fairfield
counties. Fairfield counties absorption remained flat as
a notable 8,598 square foot deal transpired at 1627-
1735 North Memorial Drive. The Licking submarket
gained 15,083 square feet of positive absorption as
Pink Poodle Consignment Boutique and Tan Pro leased
1,190 square feet and 3,900 square feet respectively at
Southgate Shopping Center in Hebron.
West
The western submarkets include Union and Madison
counties. The Union submarket showed marginal
change, while Madison recorded positive 6,340 square
feet of absorption which is fully attributed to two deals
signed in the Eagleton Retail Center.
Market Activity
Market Activity Volume is the sum of the absolute
value of each absorption change in the market and it
tells us a little more about what exactly happened to
the market behind the absorption number. The Market
Activity Volume was more than 272,752 square feet.
This is slightly below the average level of migration
(302,768 square feet), meaning that retailers
generally held steady with few closings.
The typical tenants seen most frequently entering the
market are restaurants and food operators by a
significant percentage. Fast food or fast casual
restaurants are being aggressive. Other types in the
market include discount oriented tenants, auto parts,
frozen yogurt, cell phone providers, and fitness
concepts. There are currently 48 tenants looking for
space between (1,000 and 10,000 square feet), and
nine tenants looking for space 10,000 square feet or
more.
Tenants are finding operating expenses and real
estate taxes continue to escalate, and TI allowance to
be the biggest hurdles. With the retail leasing
environment so competitive, landlords are seeing
concessions to tenants as the biggest hurdle. Class A
opportunities are especially competitive. Another
challenge is the gap in asking rates and rates sought
for lease opportunities in Class B and C shopping
centers. Landlords are having difficultly finding good
credit tenants in Class B and C centers.
Greater Columbus Region
Richard B. Schuen SIOR CCIM
CEO | Principal | Columbus
Two Miranova Place
Suite 900
Columbus, Ohio, 43215
tel +1 614 410 5612
Leslie Hobbs
Director of Marketing Ohio
Two Miranova Place
Suite 900
Columbus, Ohio, 43215
tel +1 614 410 5640
Jonathan Schuen
Research Analyst
Two Miranova Place
Suite 900
Columbus, Ohio, 43215
tel +1 614 437 4495
522 offices in
62 countries on
6 continents
United States: 147
Canada: 37
Latin America: 19
Asia Pacific: 201
EMEA: 118
• $1.8 billion in annual revenue
• 1.25 billion square feet under
management
• Over 12,300 professionals
This document/email has been prepared by Colliers
International for advertising purposes. Colliers
International statistics and data are audited annually and
may result in revisions to previously reported quarterly
and final year-end figures. Sources include Columbus
Dispatch, Business First, Xceligent, CoStar, Chain Store
Age, Wall Street Journal, Bureau of Labor Statistics,
Bureau of Economic Analysis, Gallup and the Cleveland
Federal Reserve.
www.colliers.com/columbus
Accelerating success.
research & forecast report | Q4 2012 | Retail | Greater Columbus Region