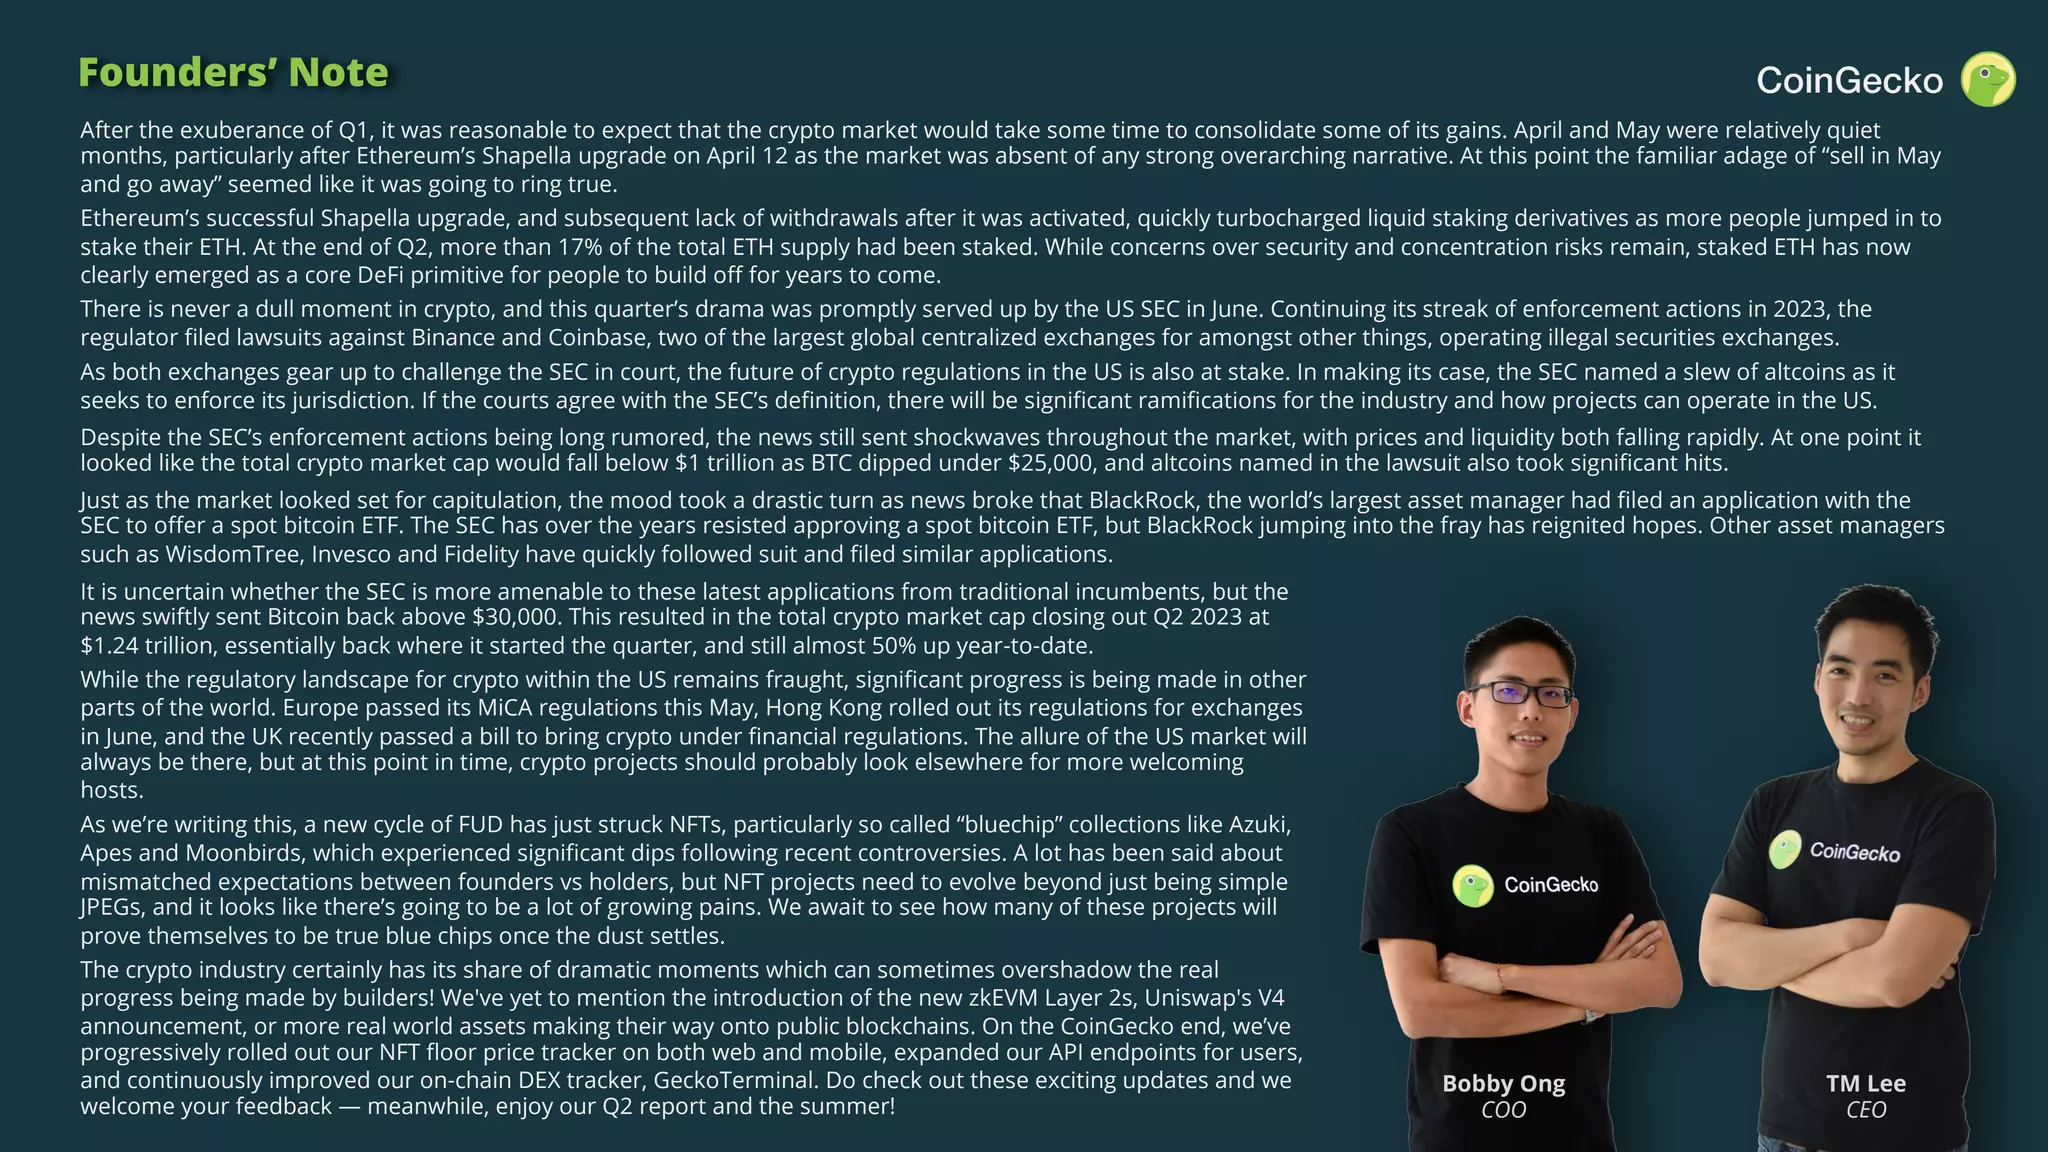
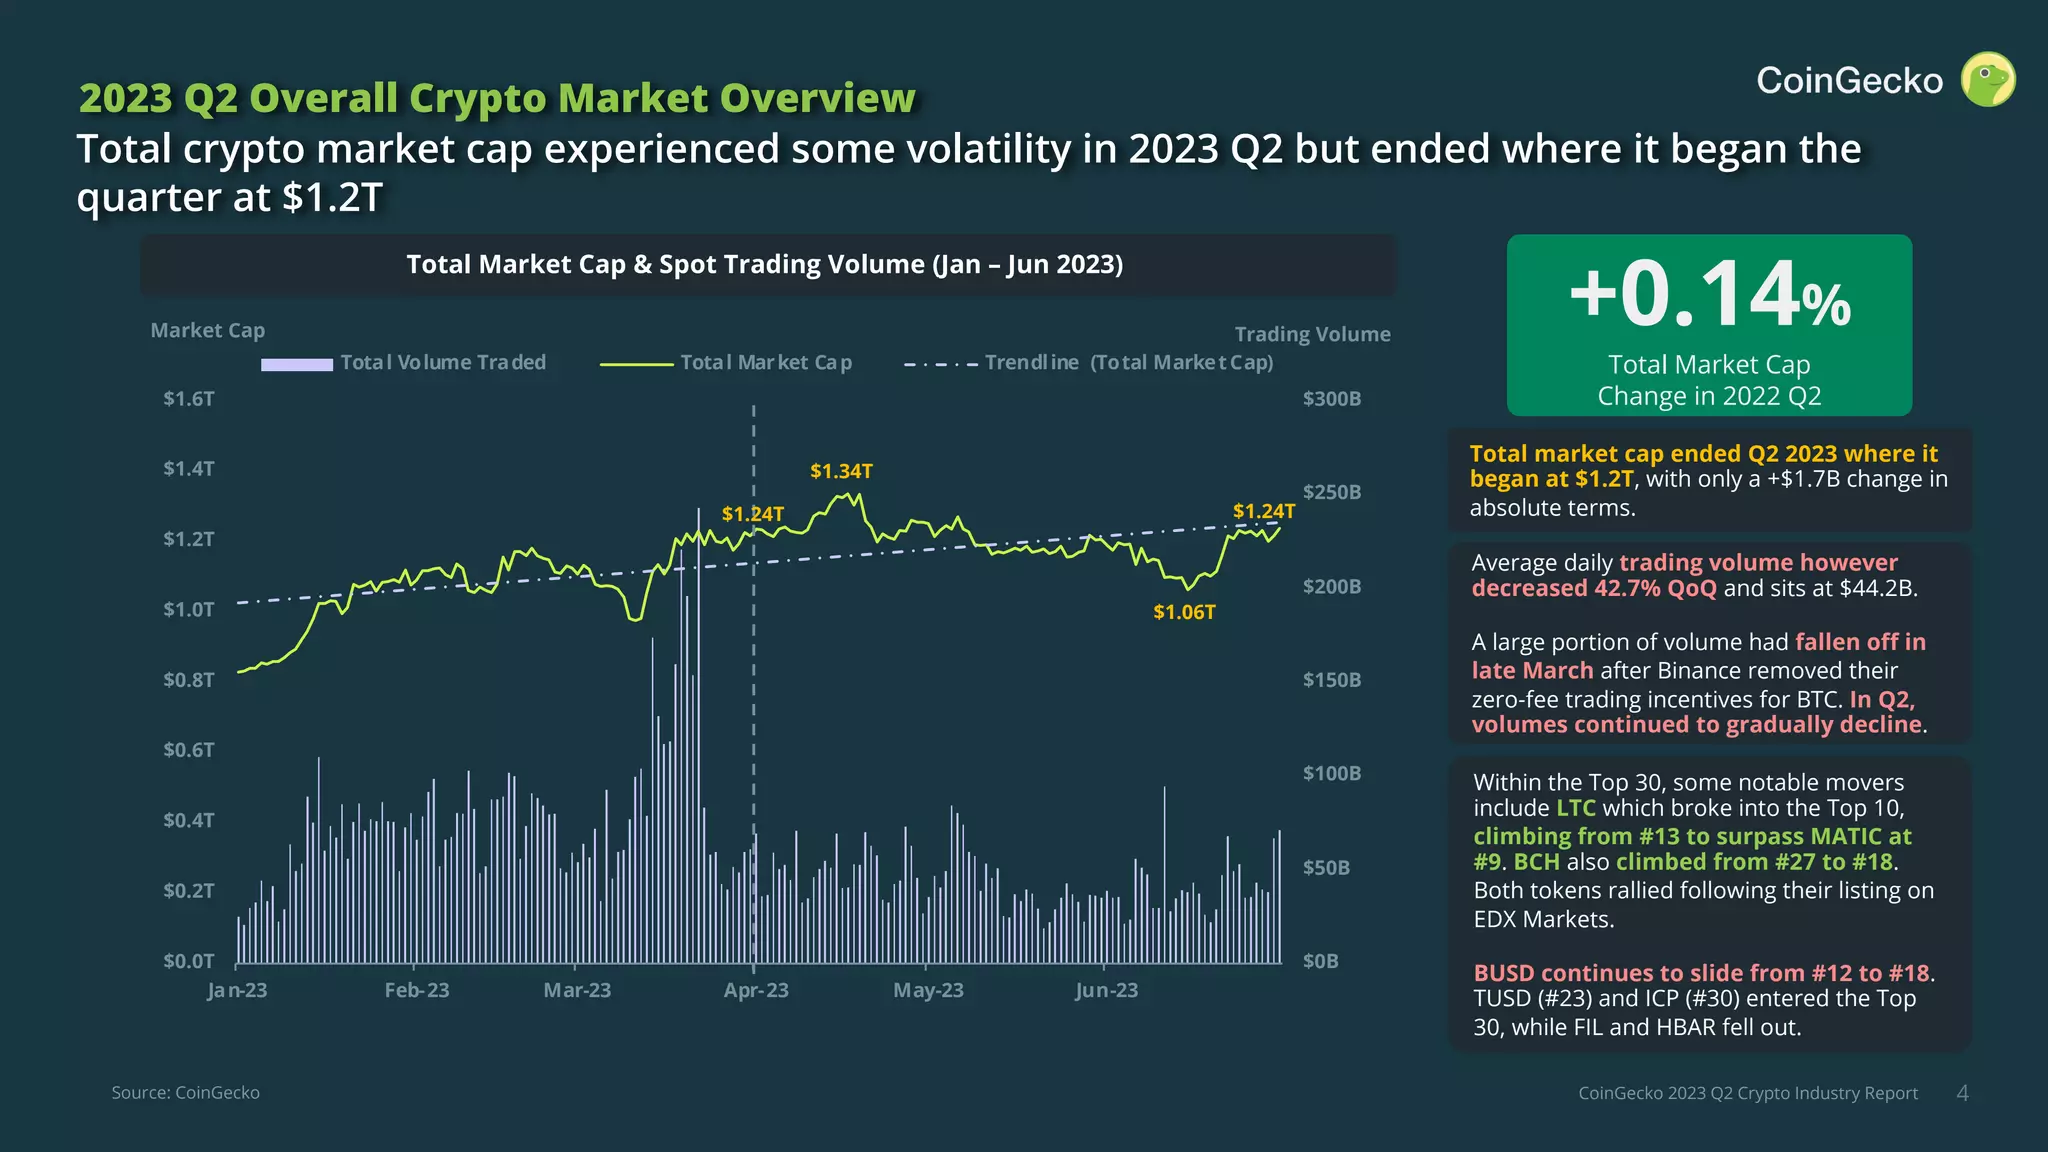
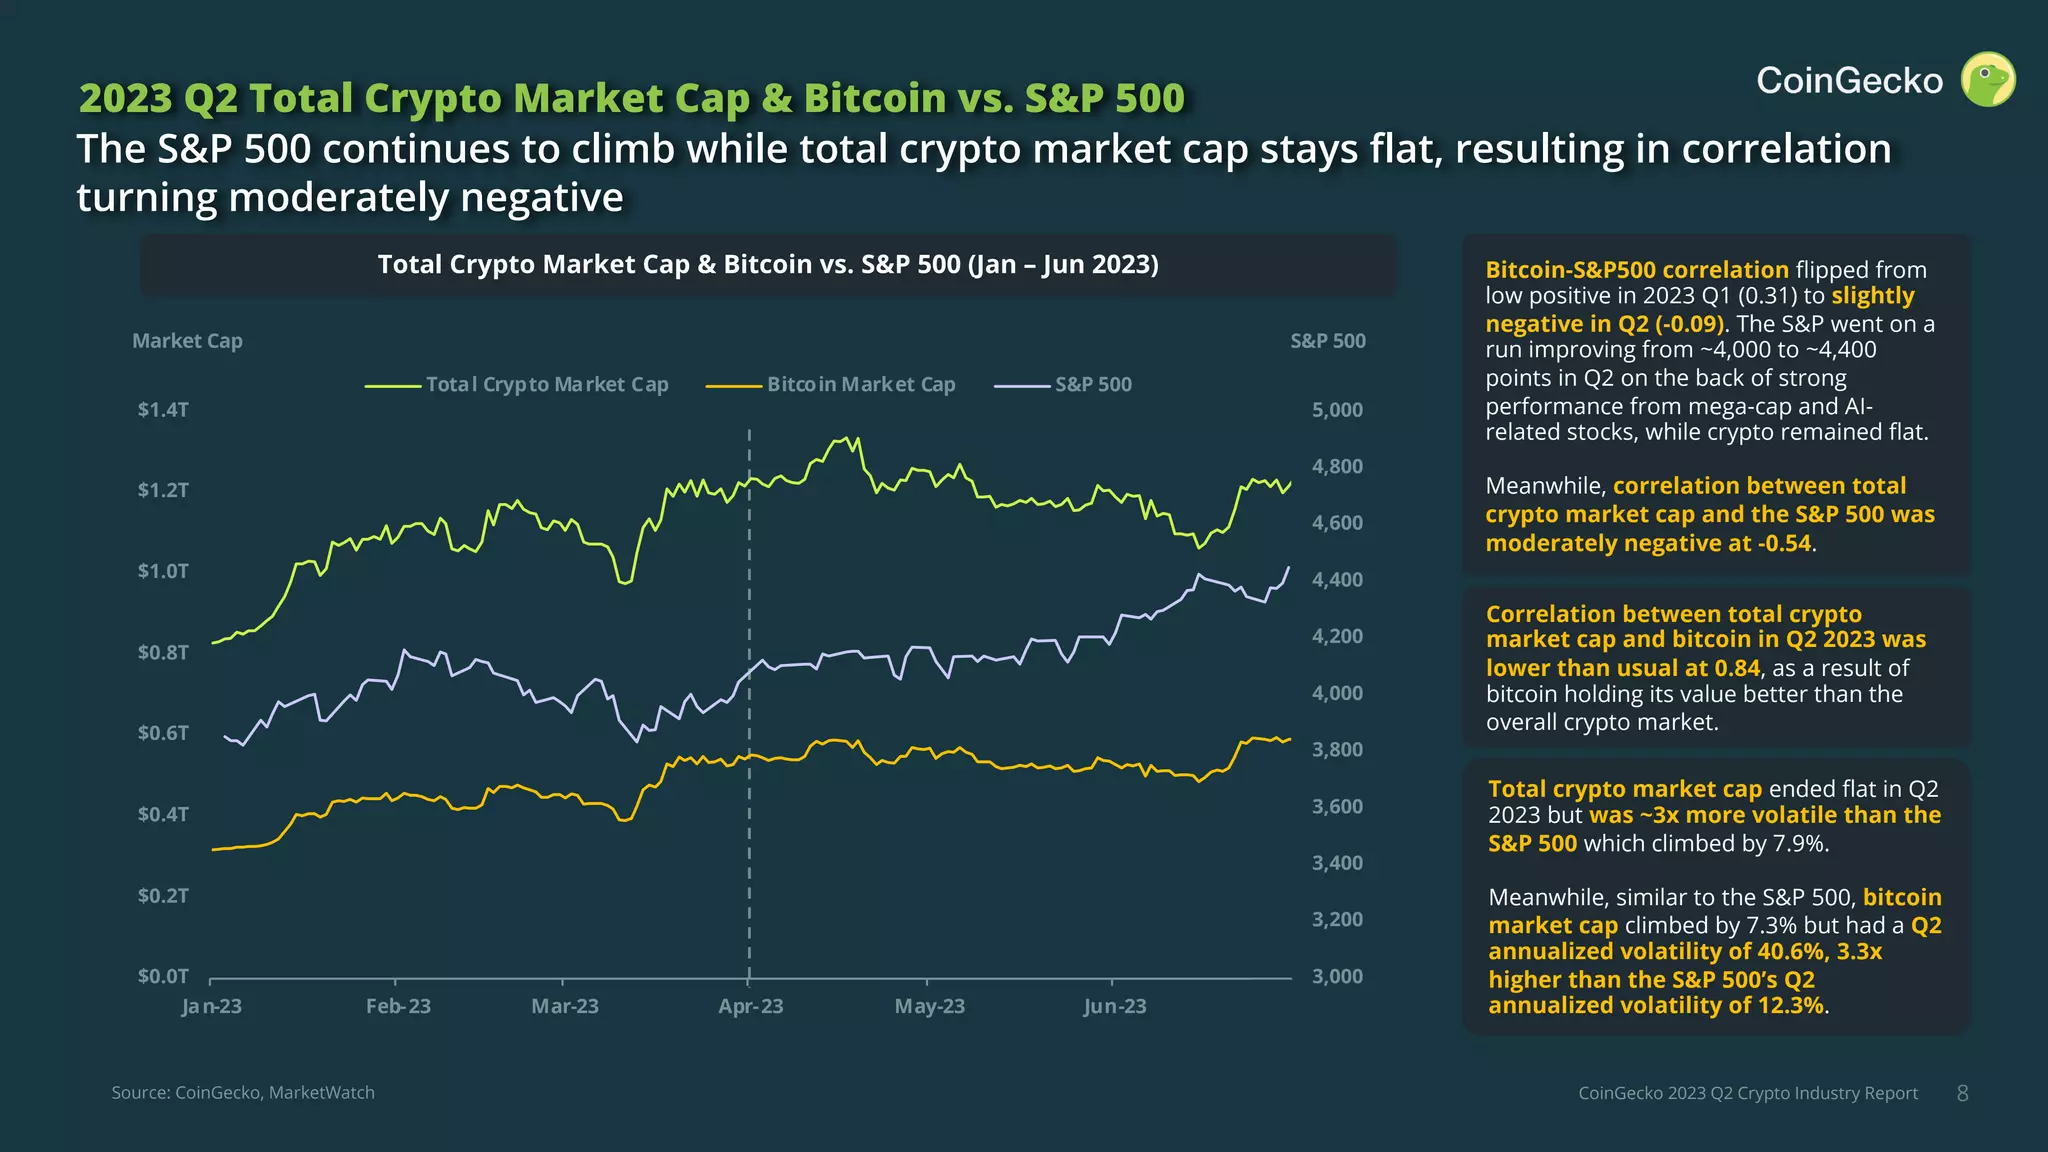
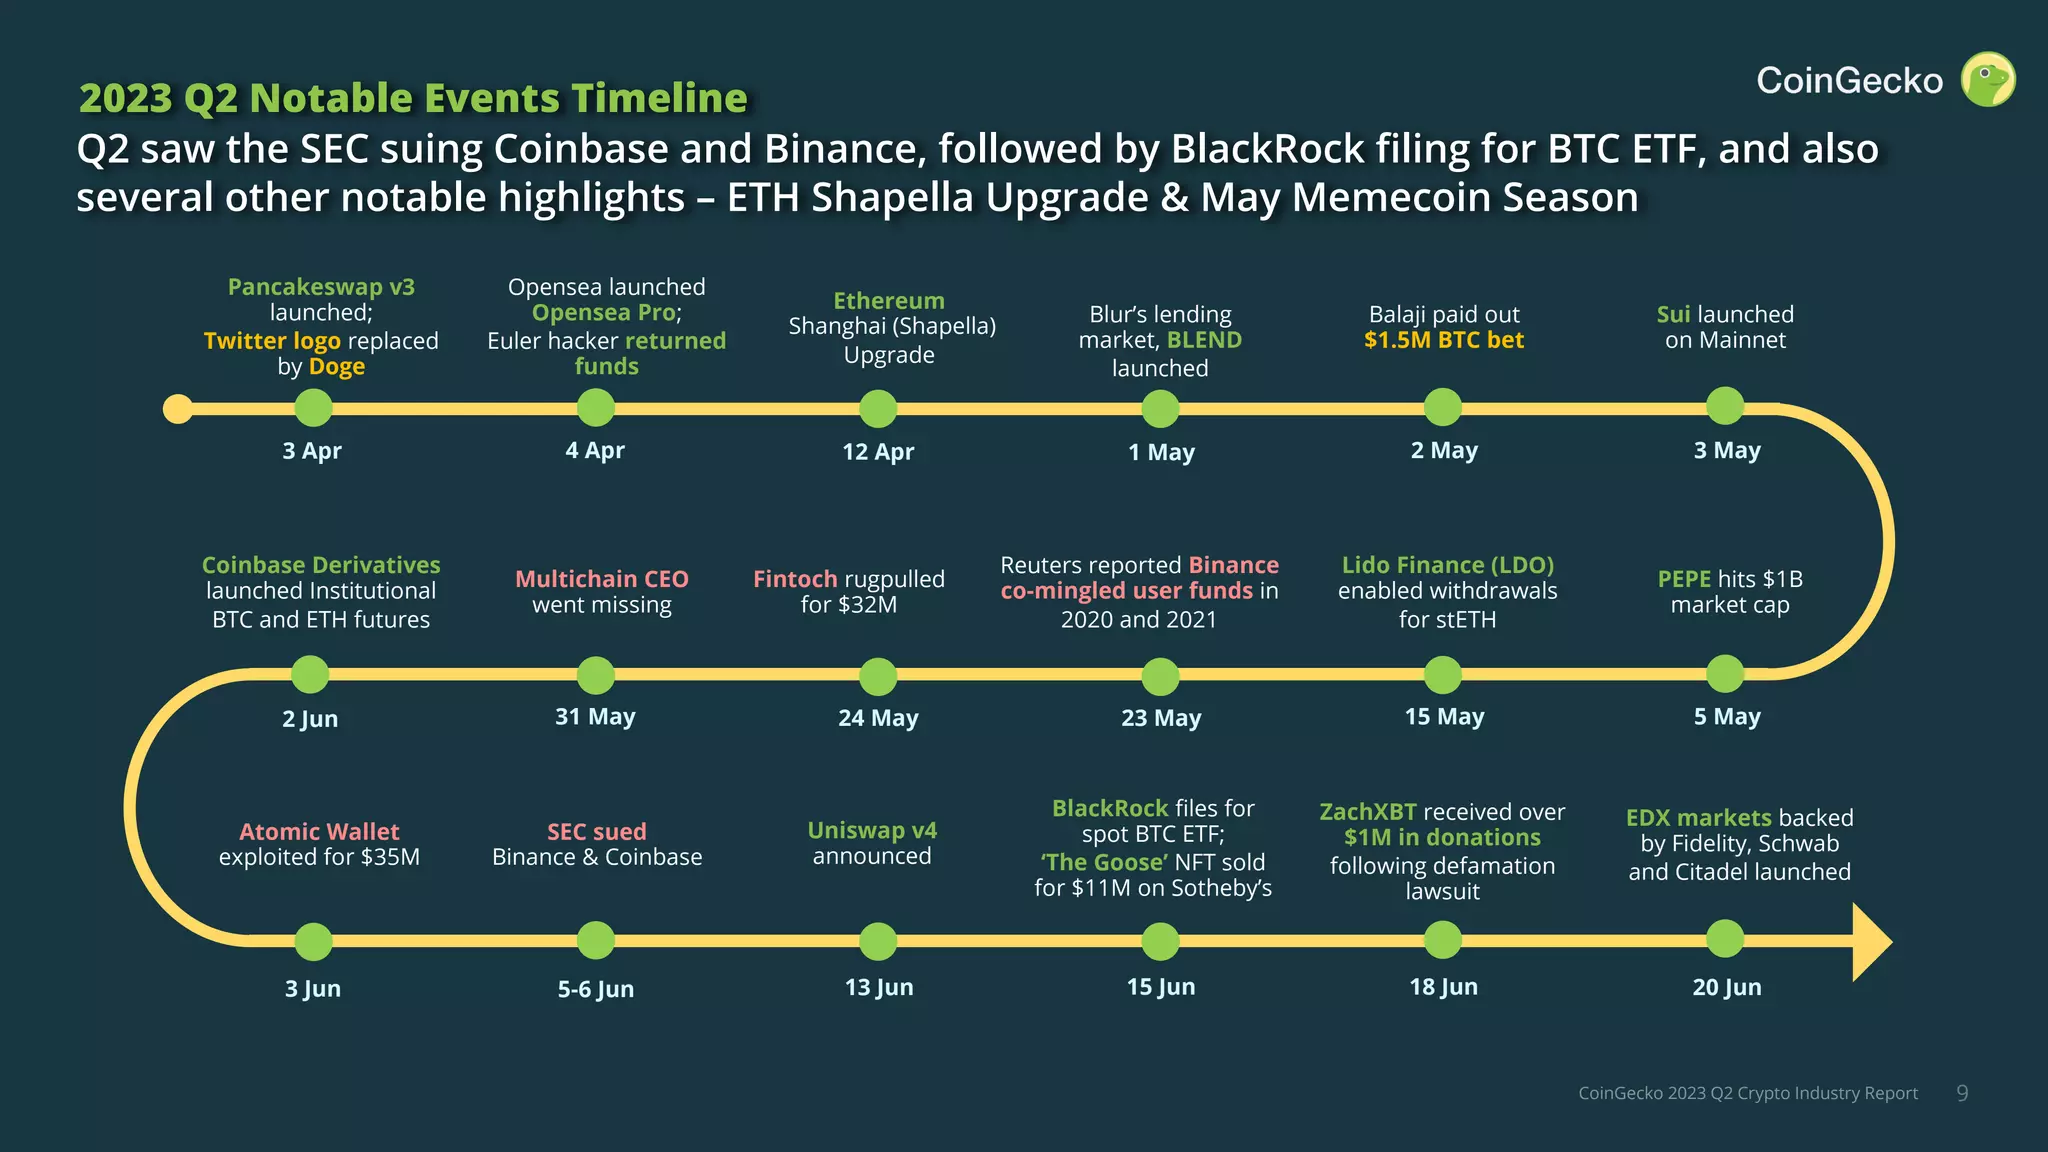
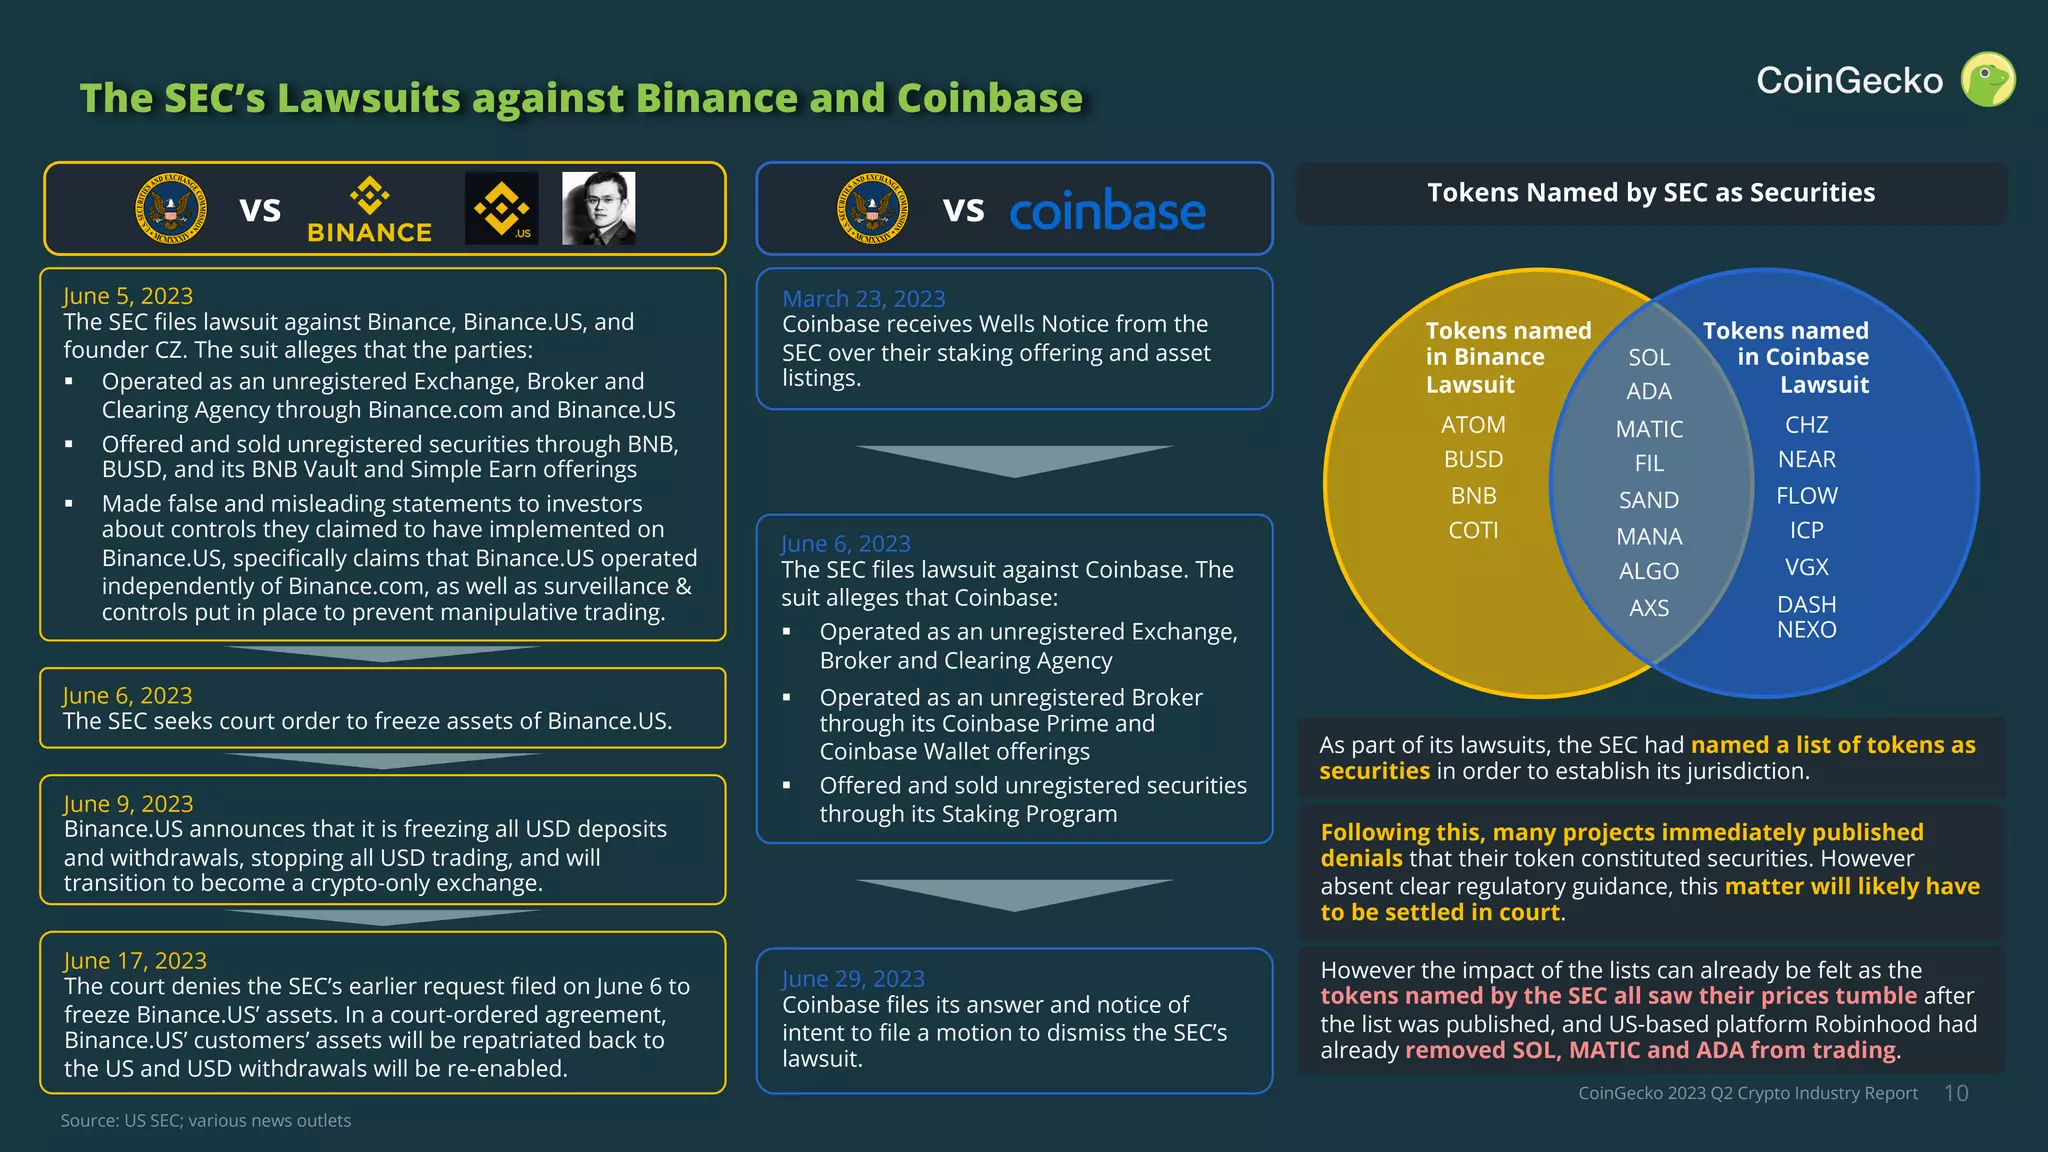
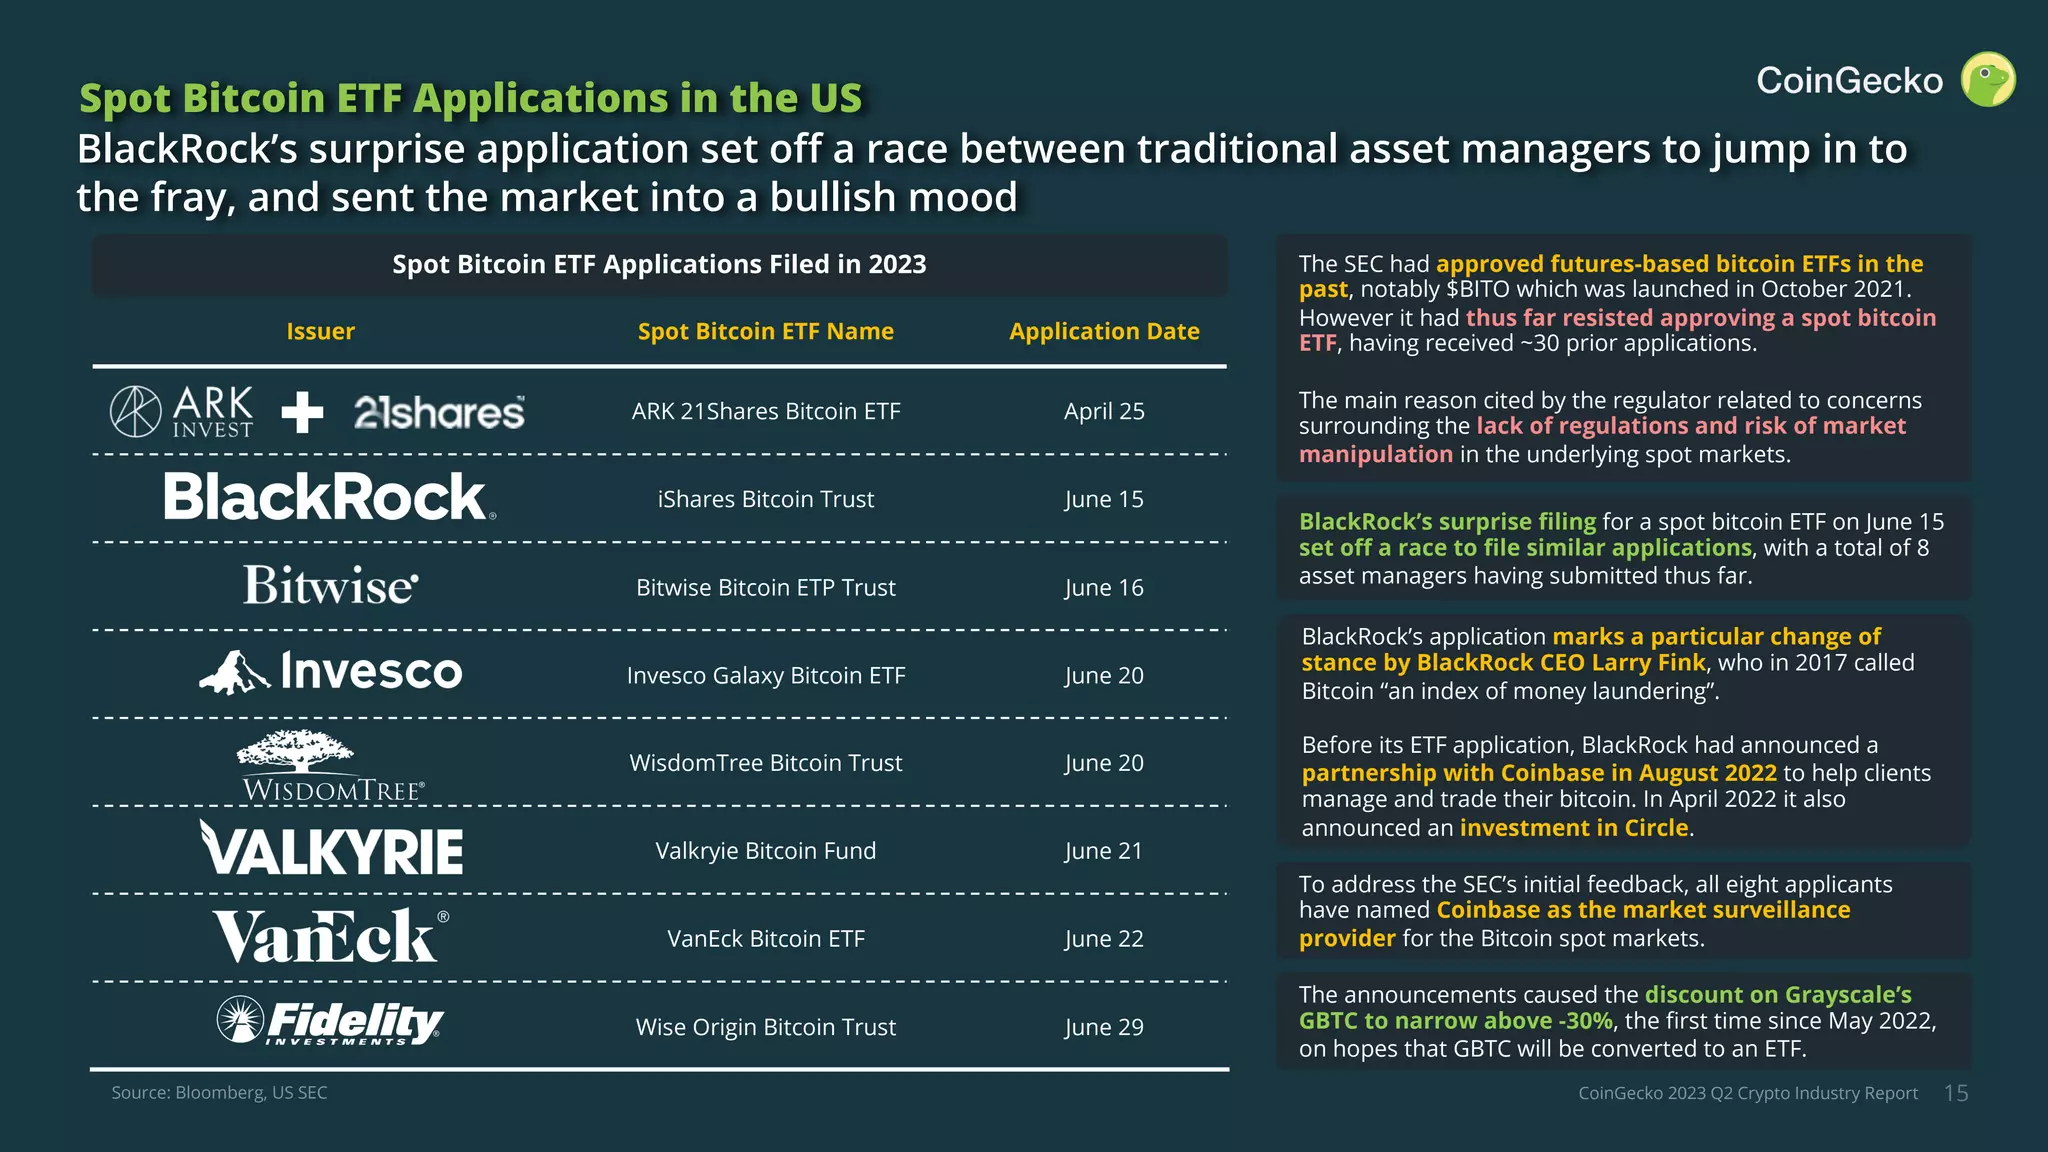
SlideShare a Scribd company logo
1 of 48
CoinGecko 2023 Q2 Crypto Industry Report
DeFi Analysis
- 2023 Q2 DeFi Overview
- 2023 Q2 DeFi Multichain Market Share
- 2023 Q2 DeFi Ecosystem Overview
- 2023 Q2 Cross-chain Bridge Liquidity
- LSDFi
23
1
Table of Contents
Analysts:
Market Landscape
- 2023 Q2 Overall Crypto Market Overview
- 2023 Q2 Crypto Dominance
- 2023 Q2 Cryptocurrency Price Returns
- 2023 Q2 Top 15 Stablecoins Overview
- 2023 Q2 Total Crypto Market Cap & Bitcoin vs. S&P 500
- 2023 Q2 Notable Events Timeline
- The SEC’s Lawsuits against Binance and Coinbase
3
Founders’ Note 2
Non-Fungible Tokens (NFTs)
- 2023 Q2 NFT Trading Volume across Top 8 Chains
- 2023 Q2 NFT Platform Trading Volumes
- 2023 Q2 Notable NFT Collections
- NFT Lending
30
Bitcoin Analysis
- 2023 Q2 Bitcoin Price vs. Trading Volume
- 2023 Q2 Bitcoin Mining Hash Rate
- 2023 Q2 Bitcoin vs. Major Asset Classes Price Returns
- Spot Bitcoin ETF Applications in the US
11
Win Win
Exchanges
- 2023 Q2 Total Crypto Exchange Volumes
- 2023 Q2 Top 10 Spot Centralized Exchanges (CEX) Trading Volume
- 2023 Q2 Top 10 Spot Decentralized Exchanges (DEX) Trading Volume
- 2023 Q2 Spot DEX Trading Volume Breakdown by Chain
- 2023 Q2 Top 10 Centralized Perpetual Exchanges Trading Volume
- 2023 Q2 Top 10 Centralized Perpetual Exchanges Open Interest
- 2023 Q2 Decentralized Perpetual Protocols Trading Volume
- 2023 Q2 Decentralized Perpetual Protocols Open Interest
36
Shaun Lee
Ethereum Analysis
- 2023 Q2 Ethereum Price vs. Trading Volume
- 2023 Q2 Ethereum Consensus Layer Staking
- 2023 Q2 Ethereum Burn Rate
- 2023 Q2 Maximal Extractable Value (MEV)
- May 2023 Memecoin Season
16
Zhong
Weng Dee Nicholas Boey
CoinGecko 2023 Q2 Crypto Industry Report 2
Founders’ Note
Bobby Ong
COO
TM Lee
CEO
After the exuberance of Q1, it was reasonable to expect that the crypto market would take some time to consolidate some of its gains. April and May were relatively quiet
months, particularly after Ethereum’s Shapella upgrade on April 12 as the market was absent of any strong overarching narrative. At this point the familiar adage of “sell in May
and go away” seemed like it was going to ring true.
Ethereum’s successful Shapella upgrade, and subsequent lack of withdrawals after it was activated, quickly turbocharged liquid staking derivatives as more people jumped in to
stake their ETH. At the end of Q2, more than 17% of the total ETH supply had been staked. While concerns over security and concentration risks remain, staked ETH has now
clearly emerged as a core DeFi primitive for people to build off for years to come.
There is never a dull moment in crypto, and this quarter’s drama was promptly served up by the US SEC in June. Continuing its streak of enforcement actions in 2023, the
regulator filed lawsuits against Binance and Coinbase, two of the largest global centralized exchanges for amongst other things, operating illegal securities exchanges.
As both exchanges gear up to challenge the SEC in court, the future of crypto regulations in the US is also at stake. In making its case, the SEC named a slew of altcoins as it
seeks to enforce its jurisdiction. If the courts agree with the SEC’s definition, there will be significant ramifications for the industry and how projects can operate in the US.
Despite the SEC’s enforcement actions being long rumored, the news still sent shockwaves throughout the market, with prices and liquidity both falling rapidly. At one point it
looked like the total crypto market cap would fall below $1 trillion as BTC dipped under $25,000, and altcoins named in the lawsuit also took significant hits.
Just as the market looked set for capitulation, the mood took a drastic turn as news broke that BlackRock, the world’s largest asset manager had filed an application with the
SEC to offer a spot bitcoin ETF. The SEC has over the years resisted approving a spot bitcoin ETF, but BlackRock jumping into the fray has reignited hopes. Other asset managers
such as WisdomTree, Invesco and Fidelity have quickly followed suit and filed similar applications.
It is uncertain whether the SEC is more amenable to these latest applications from traditional incumbents, but the
news swiftly sent Bitcoin back above $30,000. This resulted in the total crypto market cap closing out Q2 2023 at
$1.24 trillion, essentially back where it started the quarter, and still almost 50% up year-to-date.
While the regulatory landscape for crypto within the US remains fraught, significant progress is being made in other
parts of the world. Europe passed its MiCA regulations this May, Hong Kong rolled out its regulations for exchanges
in June, and the UK recently passed a bill to bring crypto under financial regulations. The allure of the US market will
always be there, but at this point in time, crypto projects should probably look elsewhere for more welcoming
hosts.
As we’re writing this, a new cycle of FUD has just struck NFTs, particularly so called “bluechip” collections like Azuki,
Apes and Moonbirds, which experienced significant dips following recent controversies. A lot has been said about
mismatched expectations between founders vs holders, but NFT projects need to evolve beyond just being simple
JPEGs, and it looks like there’s going to be a lot of growing pains. We await to see how many of these projects will
prove themselves to be true blue chips once the dust settles.
The crypto industry certainly has its share of dramatic moments which can sometimes overshadow the real
progress being made by builders! We've yet to mention the introduction of the new zkEVM Layer 2s, Uniswap's V4
announcement, or more real world assets making their way onto public blockchains. On the CoinGecko end, we’ve
progressively rolled out our NFT floor price tracker on both web and mobile, expanded our API endpoints for users,
and continuously improved our on-chain DEX tracker, GeckoTerminal. Do check out these exciting updates and we
welcome your feedback — meanwhile, enjoy our Q2 report and the summer!
CoinGecko 2023 Q2 Crypto Industry Report
MARKET LANDSCAPE
3
CoinGecko 2023 Q2 Crypto Industry Report
$0B
$50B
$100B
$150B
$200B
$250B
$300B
$0.0T
$0.2T
$0.4T
$0.6T
$0.8T
$1.0T
$1.2T
$1.4T
$1.6T
Jan-23 Feb-23 Mar-23 Apr-23 May-23 Jun-23 Jul-23
Total Volume Traded Total Market Cap Trendline (Total MarketCap)
$1.06T
$1.34T
4
2023 Q2 Overall Crypto Market Overview
Total crypto market cap experienced some volatility in 2023 Q2 but ended where it began the
quarter at $1.2T
Market Cap
Total Market Cap & Spot Trading Volume (Jan – Jun 2023)
Trading Volume
Total market cap ended Q2 2023 where it
began at $1.2T, with only a +$1.7B change in
absolute terms.
Average daily trading volume however
decreased 42.7% QoQ and sits at $44.2B.
A large portion of volume had fallen off in
late March after Binance removed their
zero-fee trading incentives for BTC. In Q2,
volumes continued to gradually decline.
+0.14%
Total Market Cap
Change in 2022 Q2
Within the Top 30, some notable movers
include LTC which broke into the Top 10,
climbing from #13 to surpass MATIC at
#9. BCH also climbed from #27 to #18.
Both tokens rallied following their listing on
EDX Markets.
BUSD continues to slide from #12 to #18.
TUSD (#23) and ICP (#30) entered the Top
30, while FIL and HBAR fell out.
$1.24T $1.24T
Source: CoinGecko
CoinGecko 2023 Q2 Crypto Industry Report
0%
10%
20%
30%
40%
50%
60%
70%
80%
90%
100%
Jan-23 Feb-23 Mar-23 Apr-23 May-23 Jun-23
BTC ETH USDT BNB USDC XRP ADA Others
5
2023 Q2 Crypto Dominance
Bitcoin dominance continues to climb as investors rotated out of altcoins into ‘majors’, despite a
shortlived memecoin season in May
Bitcoin continues its climb with a 3.2% increase
in dominance to 47.9%, levels it has not reached
since 2021 Q2. ETH also climbed slightly by
1.0% in 2023 Q2. USDT, USDC, XRP and ADA
held on to their share of market, while BNB
recorded a slight decline of 1.0%.
Source: CoinGecko
18.8%
1.0%
6.7%
0.3%
3.0%
1.0%
2.2%
0.4%
0.8%
0.3%
2.0%
0.3%
18.6%
2.4%
47.9%
3.2%
‘Others’ recorded the largest fall of -2.4% in
dominance, indicating a rotation of capital from
lower cap altcoins into ‘majors’ like Bitcoin and
Ethereum.
Crypto Dominance (Jan – Jun 2023)
CoinGecko 2023 Q2 Crypto Industry Report 6
2023 Q2 Cryptocurrency Price Returns
With the exception of some CEX tokens, altcoins bled against BTC and ETH
After a rather strong recovery in 2023 Q1, the play-to-earn sector has been hit
the hardest, where the Top 5 P2E tokens fell by 30-40%. WEMIX which
entered the Top 5 in 2023 Q1 has fallen out again, with GALA taking its place.
Within the Top 5 cryptos, BTC (+7%) and ETH (+6%) continued their Q1 climb
and still ended 2023 Q2 in the green, while BNB (-24%), XRP (-12%) and
ADA (-28%) saw double digit losses, returning some of their gains from last
quarter.
ADA and BNB saw the largest losses, after both were listed as securities in the
SEC’s lawsuits against Binance and Coinbase.
Top exchange tokens took less damage compared to other sectors, with BNB
(-24%) taking the largest loss likely as a result of Binance being sued by the
SEC.
LEO (+13%) and OKB (+6%) saw some gains, while WhiteBit exchange
token WBT took KCS’s place at #5 following its listing on Bitfinex and the
launch of its own blockchain testnet.
With the exception of AAVE (-5%), DeFi tokens UNI (-13%), LINK (-17%), LDO (-
16%), and GRT (-28%) have all dipped by double digits, fading some of their
2023 Q1 recovery. Their declines started around mid-February which coincided
with BTC pullback.
Source: CoinGecko
CoinGecko 2023 Q2 Crypto Industry Report
$0B
$20B
$40B
$60B
$80B
$100B
$120B
$140B
$160B
Jan-23 Feb-23 Mar-23 Apr-23 May-23 Jun-23
USDT USDC DAI BUSD TUSD Others (6-15)
$126.3B
Market Cap
7
2023 Q2 Top 15 Stablecoins Overview
USDT continues its dominant run and now has 66% of market share, however overall stablecoin
market saw net outflows
$83.3B
+$3.48B (+4.4%)
$27.4B
-$5.18B (-15.9%)
$4.3B
-$0.76B (-14.9%)
$4.1B
-$3.43b (-45.4%)
$3.1B
+$1.02B (+50.0%)
Top 15 Stablecoins Market Cap Breakdown (Jan – Jun 2023)
Source: CoinGecko
Top 15 Stablecoins shed ~3.5% or $4.6B in
market cap in 2023 Q2 and now sits at
$126.3B.
USDT gained the most in absolute terms
during Q2, while BUSD continued its slide
after Paxos announced its wind-down with
$3.4B removed from circulation (-45%).
DAI saw losses in Q2 but still took BUSD’s
place as the third largest stablecoin.
-3.5%
Top 15 Stablecoins Market
Cap Change in 2023 Q2
Outside the Top 5, GUSD (+44.4%), flexUSD
(+33.4%) and USDP (+30.0%) were the
biggest gainers while USTC was the
biggest loser (-43.2%).
TUSD spiked 50% in market cap after
Binance minted ~$1B worth on the Tron
network and implemented zero-fee trading
on TUSD pairs. However, near the end of Q2
there was FUD due to one of its custodians,
Prime Trust, as well as its auditor.
$130.8B
USDT: 61%
USDC: 25%
DAI: 4%
BUSD: 6%
TUSD: 2%
Others: 3%
USDT: 66%
USDC: 22%
DAI: 3%
BUSD: 3%
TUSD: 2%
Others: 3%
CoinGecko 2023 Q2 Crypto Industry Report
Market Cap
8
2023 Q2 Total Crypto Market Cap & Bitcoin vs. S&P 500
The S&P 500 continues to climb while total crypto market cap stays flat, resulting in correlation
turning moderately negative
S&P 500
Correlation between total crypto
market cap and bitcoin in Q2 2023 was
lower than usual at 0.84, as a result of
bitcoin holding its value better than the
overall crypto market.
Bitcoin-S&P500 correlation flipped from
low positive in 2023 Q1 (0.31) to slightly
negative in Q2 (-0.09). The S&P went on a
run improving from ~4,000 to ~4,400
points in Q2 on the back of strong
performance from mega-cap and AI-
related stocks, while crypto remained flat.
Meanwhile, correlation between total
crypto market cap and the S&P 500 was
moderately negative at -0.54.
Total crypto market cap ended flat in Q2
2023 but was ~3x more volatile than the
S&P 500 which climbed by 7.9%.
Meanwhile, similar to the S&P 500, bitcoin
market cap climbed by 7.3% but had a Q2
annualized volatility of 40.6%, 3.3x
higher than the S&P 500’s Q2
annualized volatility of 12.3%.
Total Crypto Market Cap & Bitcoin vs. S&P 500 (Jan – Jun 2023)
Source: CoinGecko, MarketWatch
3,000
3,200
3,400
3,600
3,800
4,000
4,200
4,400
4,600
4,800
5,000
$0.0T
$0.2T
$0.4T
$0.6T
$0.8T
$1.0T
$1.2T
$1.4T
Jan-23 Feb-23 Mar-23 Apr-23 May-23 Jun-23
Total Crypto Market Cap Bitcoin Market Cap S&P 500
CoinGecko 2023 Q2 Crypto Industry Report 9
2023 Q2 Notable Events Timeline
Q2 saw the SEC suing Coinbase and Binance, followed by BlackRock filing for BTC ETF, and also
several other notable highlights – ETH Shapella Upgrade & May Memecoin Season
3 Apr 4 Apr 12 Apr 1 May 2 May 3 May
31 May 24 May 23 May 15 May 5 May
2 Jun
3 Jun 5-6 Jun 13 Jun 20 Jun
15 Jun 18 Jun
Coinbase Derivatives
launched Institutional
BTC and ETH futures
Atomic Wallet
exploited for $35M
SEC sued
Binance & Coinbase
Uniswap v4
announced
EDX markets backed
by Fidelity, Schwab
and Citadel launched
BlackRock files for
spot BTC ETF;
‘The Goose’ NFT sold
for $11M on Sotheby’s
ZachXBT received over
$1M in donations
following defamation
lawsuit
Multichain CEO
went missing
Lido Finance (LDO)
enabled withdrawals
for stETH
PEPE hits $1B
market cap
Fintoch rugpulled
for $32M
Reuters reported Binance
co-mingled user funds in
2020 and 2021
Sui launched
on Mainnet
Blur’s lending
market, BLEND
launched
Balaji paid out
$1.5M BTC bet
Pancakeswap v3
launched;
Twitter logo replaced
by Doge
Opensea launched
Opensea Pro;
Euler hacker returned
funds
Ethereum
Shanghai (Shapella)
Upgrade
CoinGecko 2023 Q2 Crypto Industry Report 10
The SEC’s Lawsuits against Binance and Coinbase
Tokens Named by SEC as Securities
SOL
ADA
MATIC
FIL
SAND
MANA
ALGO
AXS
ATOM
BUSD
BNB
COTI
CHZ
NEAR
FLOW
ICP
VGX
DASH
NEXO
Tokens named
in Binance
Lawsuit
Tokens named
in Coinbase
Lawsuit
As part of its lawsuits, the SEC had named a list of tokens as
securities in order to establish its jurisdiction.
However the impact of the lists can already be felt as the
tokens named by the SEC all saw their prices tumble after
the list was published, and US-based platform Robinhood had
already removed SOL, MATIC and ADA from trading.
March 23, 2023
Coinbase receives Wells Notice from the
SEC over their staking offering and asset
listings.
June 5, 2023
The SEC files lawsuit against Binance, Binance.US, and
founder CZ. The suit alleges that the parties:
§ Operated as an unregistered Exchange, Broker and
Clearing Agency through Binance.com and Binance.US
§ Offered and sold unregistered securities through BNB,
BUSD, and its BNB Vault and Simple Earn offerings
§ Made false and misleading statements to investors
about controls they claimed to have implemented on
Binance.US, specifically claims that Binance.US operated
independently of Binance.com, as well as surveillance &
controls put in place to prevent manipulative trading.
June 6, 2023
The SEC files lawsuit against Coinbase. The
suit alleges that Coinbase:
§ Operated as an unregistered Exchange,
Broker and Clearing Agency
§ Operated as an unregistered Broker
through its Coinbase Prime and
Coinbase Wallet offerings
§ Offered and sold unregistered securities
through its Staking Program
June 9, 2023
Binance.US announces that it is freezing all USD deposits
and withdrawals, stopping all USD trading, and will
transition to become a crypto-only exchange.
June 6, 2023
The SEC seeks court order to freeze assets of Binance.US.
June 17, 2023
The court denies the SEC’s earlier request filed on June 6 to
freeze Binance.US’ assets. In a court-ordered agreement,
Binance.US’ customers’ assets will be repatriated back to
the US and USD withdrawals will be re-enabled.
June 29, 2023
Coinbase files its answer and notice of
intent to file a motion to dismiss the SEC’s
lawsuit.
vs vs
Following this, many projects immediately published
denials that their token constituted securities. However
absent clear regulatory guidance, this matter will likely have
to be settled in court.
Source: US SEC; various news outlets
CoinGecko 2023 Q2 Crypto Industry Report
BITCOIN ANALYSIS
11
CoinGecko 2023 Q2 Crypto Industry Report
$0B
$10B
$20B
$30B
$40B
$50B
$60B
$70B
$80B
$90B
$100B
$0
$5,000
$10,000
$15,000
$20,000
$25,000
$30,000
$35,000
Jan-23 Feb-23 Mar-23 Apr-23 May-23 Jun-23
Volume Price
$30,481
Q2 low
$25,107
Yearly high
$30,694
12
2023 Q2 Bitcoin Price vs. Trading Volume
BTC saw some volatility in 2023 Q2 but ends the quarter with a 6.9% gain, outperforming the
overall crypto market
BTC Price Trading Vol
Bitcoin Price and Spot Trading Volume Apr ‘21 - Oct '21
Bitcoin Price and Spot Trading Volume (Jan – Jun 2023)
$28,517
In 2023 Q2, BTC outperformed the overall
crypto market cap with a +6.9% return.
After a strong rally in Q1 up until mid-April,
BTC retraced almost ~18% to $25,107. It
then rebounded to reach a new 2023 high at
$30,694 following the announcement of
BlackRock’s spot bitcoin ETF filing.
While prices continue trending up, average
daily trading volume for 2023 Q2 sits at
$13.8B, a 58.7% decline QoQ.
+6.9%
Bitcoin price return in
2023 Q2
Notable developments for Bitcoin this
quarter include the continued rise of
Ordinals with the introduction of BRC-20
tokens, as well as a slew of spot bitcoin
ETF filings following Blackrock’s surprise
filing (see slide 15).
Source: CoinGecko
CoinGecko 2023 Q2 Crypto Industry Report
100m
150m
200m
250m
300m
350m
400m
450m
500m
Jan-23 Feb-23 Mar-23 Apr-23 May-23 Jun-23
13
2023 Q2 Bitcoin Mining Hash Rate
Bitcoin’s total hashrate and mining difficulty continues to trend upwards in 2023 Q2, hitting all-
time highs; meanwhile surge in transaction fees from Ordinals delivers boon for miners
Hash Rate TH/s
Bitcoin's Total Hash Rate (Jan – Jun 2023)
All-time High
441m TH/s
326m TH/s
Mining hash rate continues to climb,
increasing by 22% QoQ and hitting
another ATH of 441m TH/s on 1 May.
Mining difficulty exceeded the 50 trillion
mark for the first time ever on June 13.
+22.0%
Bitcoin’s hash rate increase
in 2023 Q2
The mining industry continues to develop:
• Miners continue to expand - Riot
purchased 33,280 ASIC miners;
CleanSpark continued its Q1 buying
spree with another 57,000 miners in Q2.
• The proposed “anti-mining” US bill
which calls for a 10% tax on electricity
used by miners has fell through in May,
while favorable bitcoin mining bills
have passed in Texas and Arkansas.
• Jack Dorsey’s open-source, 5nm bitcoin
mining chip prototype completed.
Source: Blockchain.com
398m TH/s
For only the fifth time in history, average fee
paid per block surpassed the block
subsidy for a few hours on May 8 due to
Ordinals boon
CoinGecko 2023 Q2 Crypto Industry Report 14
After a stellar 2023 Q1, Bitcoin still outperforms most major asset classes in Q2, only lagging
behind the NASDAQ and S&P500
Bitcoin vs. Major Asset Classes (Apr – Jun 2023)
Courtesy of the rally on mega-cap tech stocks, the
NASDAQ (+14%) and S&P 500 (+8%) were the top two
performers of 2023 Q2. BTC (+7%) came in third place.
2023 Q2 Bitcoin vs. Major Asset Classes Price Returns
Price
Return
Crude oil (-12%) saw the largest decline due to a
combination of factors, including fears of a US recession,
China’s declining economic growth, as well as higher-
than-expected oil supply from Russia. Concerns
surrounding China’s economy also contributed to CNY’s
(-5%) fall.
JPY (-8%) saw the second-largest loss, as the Bank of
Japan is expected to keep interest rates low despite the
opposite action taken by other central banks.
Source: MarketWatch
-20.0%
-15.0%
-10.0%
-5.0%
0.0%
5.0%
10.0%
15.0%
Apr-23 May-23 Jun-23
BTC Crude Oil Gold TLT DXY NASDAQ CNY JPY
CoinGecko 2023 Q2 Crypto Industry Report
Issuer Spot Bitcoin ETF Name Application Date
ARK 21Shares Bitcoin ETF April 25
iShares Bitcoin Trust June 15
Bitwise Bitcoin ETP Trust June 16
Invesco Galaxy Bitcoin ETF June 20
WisdomTree Bitcoin Trust June 20
Valkryie Bitcoin Fund June 21
VanEck Bitcoin ETF June 22
Wise Origin Bitcoin Trust June 29
15
Spot Bitcoin ETF Applications in the US
BlackRock’s surprise application set off a race between traditional asset managers to jump in to
the fray, and sent the market into a bullish mood
BlackRock’s application marks a particular change of
stance by BlackRock CEO Larry Fink, who in 2017 called
Bitcoin “an index of money laundering”.
Before its ETF application, BlackRock had announced a
partnership with Coinbase in August 2022 to help clients
manage and trade their bitcoin. In April 2022 it also
announced an investment in Circle.
The SEC had approved futures-based bitcoin ETFs in the
past, notably $BITO which was launched in October 2021.
However it had thus far resisted approving a spot bitcoin
ETF, having received ~30 prior applications.
The main reason cited by the regulator related to concerns
surrounding the lack of regulations and risk of market
manipulation in the underlying spot markets.
The announcements caused the discount on Grayscale’s
GBTC to narrow above -30%, the first time since May 2022,
on hopes that GBTC will be converted to an ETF.
To address the SEC’s initial feedback, all eight applicants
have named Coinbase as the market surveillance
provider for the Bitcoin spot markets.
BlackRock’s surprise filing for a spot bitcoin ETF on June 15
set off a race to file similar applications, with a total of 8
asset managers having submitted thus far.
Source: Bloomberg, US SEC
Spot Bitcoin ETF Applications Filed in 2023
CoinGecko 2023 Q2 Crypto Industry Report
ETHEREUM ANALYSIS
16
CoinGecko 2023 Q2 Crypto Industry Report 17
2023 Q2 Ethereum Price vs. Trading Volume
Price of ETH gained by 6% in 2023 Q2, slightly less than Bitcoin but still outperforming the
overall crypto market
Source: CoinGecko
Ethereum Price and Spot Trading Volume (Jan – Jun 2023)
ETH Price Trading Vol.
2023 Q1 Price Return
+49.8%
2023 Q2 Price Return
+6.0%
ETH closed 2023 Q2 at $1,934, representing
a 6.0% increase during the quarter.
It started the quarter at $1,792 before
hitting a yearly high of $2,118 in mid-April.
This coincided with the Shapella upgrade on
April 12. Despite fears that early stakers
would withdraw and sell their staked ETH,
the price of ETH rose above $2,000 for the
first time in 2023, before dipping back
below those levels.
It had been a busy quarter for Ethereum’s
zero-knowledge projects:
• zkSync unveiled plans for Hyperchains, a
series of custom blockchains.
• Starknet is preparing to launch a testnet
zkEVM in the form of Kakarot in its path
to becoming EVM-compatible.
• Polygon proposed to upgrade its PoS
network to a zkEVM validium
Yearly High
$2,118
$1,934
+6.0%
ETH Price Return in 2023 Q2
$0B
$20B
$40B
$60B
$80B
$100B
$120B
$0
$200
$400
$600
$800
$1,000
$1,200
$1,400
$1,600
$1,800
$2,000
$2,200
Jan-23 Feb-23 Mar-23 Apr-23 May-23 Jun-23 Jul-23
Volume Price
$1,792
CoinGecko 2023 Q2 Crypto Industry Report 18
2023 Q2 Ethereum Consensus Layer Staking
ETH staking sees strong growth (+30.3%) in 2023 Q2 after withdrawals were enabled; Lido is still
leading the way while Kraken loses market share
Kraken had a 36.2% drop in staked ETH as
it winds down its staking product in the US
following a settlement with the SEC.
Total staked ETH hit 23.6 mil by the end
of 2023 Q2, a gain of 5.6 mil QoQ. Total
staked ETH climbed at a faster rate
compared to 2023 Q1, where 2.2 mil were
staked.
This is a clear signal that holders now have
more confidence in staking ETH after
withdrawals were enabled post-Shapella.
Lido remained the dominant staking
provider, with 31.9% of all staked ETH, a
slight increase from 31.4% in Q1.
Source: Glassnode
Total Staked ETH in Validators (Jan – Jun 2023) 9.6%
5.2% 3.4%
2.8%
1.2%
1.9%
34.2%
31.9%
Staked ETH 2023 Q2
Total Staked ETH +30.3%
2023 Q1
Total Staked ETH +13.6%
0M
2M
4M
6M
8M
10M
12M
14M
16M
18M
20M
22M
24M
Jan-23 Feb-23 Mar-23 Apr-23 May-23 Jun-23 Jul-23
Lido Coinbase Kraken Binance
Staked.us Bitcoinsuisse Stakefish Figment
Rocket Pool Huobi Abyss Finance Stakewise
Frax Others
18,006,199
23,596,678
CoinGecko 2023 Q2 Crypto Industry Report 19
2023 Q2 Ethereum Burn Rate
ETH experienced its second net-burn quarter, largely thanks to the mid-May memecoin season;
The Ethereum network experienced a net burn of 203k ETH in 2023 Q2
ETH
Top 6 Burn Leaderboard Q2
2023 Q2 saw over 381k ETH burned, while
179k were emitted. This resulted in 203k
ETH being taken out of circulation this
quarter, another ATH in terms of net burn.
Most of the ETH burned this quarter
occurred in May. The largest one-day burn
occurred on 5 May, where 14.6k ETH was
burned at the peak of memecoin season.
Notably, during the week of 5 – 11 May,
81,553 ETH was burned, representing 21.4%
of all ETH burned in Q2.
Uniswap remained the dominant ETH
burner in Q2, burning 97.5k ETH.
Meanwhile, NFT exchanges Blur and
OpenSea were edged out by XEN and
MetaMask. This coincides with the slump in
NFT trading volumes.
4
XEN Projects
10.0k ETH
2
ETH Transfers
23.7k ETH
3
USDT
15.6k ETH
1
Uniswap
97.5k ETH
5
Arbitrum
9.9k ETH
6
MetaMask
8.9k ETH
Source: Dune Analytics
0
2,000
4,000
6,000
8,000
10,000
12,000
14,000
Jan-23 Feb-23 Mar-23 Apr-23 May-23 Jun-23
Emissions Burned
Peak of
memecoin
season
381K
ETH Burned in 2023 Q2
ETH Burn vs. Emission Rate (Jan – Jun 2023)
CoinGecko 2023 Q2 Crypto Industry Report
$1M $2M
$7M $5M
$9M
$3M
$2M
$3M
$11M
$2M
$3M
$2M
$2M
$0M
$5M
$10M
$15M
$20M
Jan-23 Feb-23 Mar-23 Apr-23 May-23 Jun-23
Sandwich Profits Arbitrage Profits Liquidation Profits
20
2023 Q2 Maximal Extractable Value (MEV)
Even though MEV transaction volumes have fallen by 87%, MEV bots still increased their profits
by 11% in 2023 Q2, with the majority going to sandwich attackers
Volume
Profits
Source: EigenPhi
As transaction volumes on DEXs have fallen
off significantly in 2023 Q2, MEV bots also
were noticeably less active, as MEV
transaction volumes shrank by 87.0%
from $44B in March to $6B in June 2023.
Although sandwich attacks are still the most
active form of MEV, quarterly volumes have
plunged by 69.4% from $59B to $18B.
Yet, sandwich attackers have increased
their profits in 2023 Q2 by 80.1%, In other
words, sandwich bots are making more
on average with each “attack”.
Be that as it may, MEV searchers are still
raking in the cash, increasing their
earnings by 11.0% from $24.5M to $27.2M
this quarter. MEV bots achieved their most
profitable month of Q2 in May during the
height of the recent memecoin season.
$10B $14B
$36B
$7B $7B $4B
$8B
$0B
$10B
$20B
$30B
$40B
$50B
Jan-23 Feb-23 Mar-23 Apr-23 May-23 Jun-23
Sandwich Attack Arbitrage Liquidation
$27.2M
Profits Generated by MEV
Transactions in 2023 Q2
MEV Monthly Transaction Volume and Profits (Jan – Jun 2023)
CoinGecko 2023 Q2 Crypto Industry Report
1589x
183x
142x
96x
59x
24x
1x
51x
101x
151x
201x
251x
1x
2x
4x
8x
16x
32x
64x
128x
256x
512x
1024x
2048x
0 2 4 6 8 10 12 14 16 18 20 22 24 26 28 30 32 34 36 38 40 42 44 46 48 50
PEPE AIDOGE LADYS BOB WOJAK BITCOIN
21
21
21
May 2023 Memecoin Season
May 2023 Memecoin Season gave rise to PEPE and a new batch of memecoins, including BRC-20
tokens on Bitcoin
AIDOGE claimed second spot in terms of
returns, with returns of up to 235x** at its
peak. AIDOGE distinguished itself by
launching on Arbitrum, and tokens were
distributed to those eligible for ARB airdrop.
The Introduction of BRC-20 tokens through
Bitcoin Ordinals brought memecoins to the
Bitcoin network, driving a surge in trading
volume in May 2023. $ORDI emerging as
the most popular one, reaching a peak
market cap of $600 million.
Source: GeckoTerminal
*Comparison of Returns is based on the coins' performance after they first reached a market capitalization of $1M. The price of the token at that point is used as a
benchmark for calculating returns. Day 0 represents the day the market cap of the token first hits $1M.
**Peak return is calculated based on the intraday high price. Price returns on chart are calculated based on the daily closing price and will not match the peak price.
Memecoin Season arrived in 2023 Q2,
capturing the attention of traders. PEPE
emerged as the frontrunner, offering early
investors returns of ~1813x** at its peak.
Its “appeal” stem from the use of Pepe the
Frog as its imagery.
At peak, PEPE achieved a market cap of
$1.8 billion following its Binance listing
announcement. However, the price dipped
after its actual listing.
Returns (PEPE)
Days
Returns (Others)
1813x
Peak returns from PEPE**
May 2023 Memecoin Season Price Returns
CoinGecko 2023 Q2 Crypto Industry Report 22
Track DEXes and real-time cryptocurrency prices.
GeckoTerminal
Now tracking:
• 100 Blockchain Networks
• 600+ DEXes
• 1.7 million+ Pools
• 1.5 million+ Tokens
Discover the next big opportunity in the
decentralized exchange (DEX) and DeFi
space with GeckoTerminal. 📈
What’s new:
• Explore the hottest crypto trends via
the Trending Pools Page.
• Compare DEXes across all networks
using DEX Rankings.
• Builder? Explore the market data via
GeckoTerminal API.
Chart the hottest tokens now!
Stay updated with GeckoTerminal:
from
CoinGecko 2023 Q2 Crypto Industry Report
DEFI ANALYSIS
23
CoinGecko 2023 Q2 Crypto Industry Report
3.7%
3.8%
3.9%
4.0%
4.1%
4.2%
4.3%
4.4%
4.5%
4.6%
4.7%
$30B
$35B
$40B
$45B
$50B
$55B
$60B
Jan-23 Feb-23 Mar-23 Apr-23 May-23 Jun-23
Total DeFi Market Cap DeFi Share of Market (DeFi/Global Market Cap)
24
2023 Q2 DeFi Overview
While the DeFi sector saw a temporary spike in market cap following Ethereum’s Shapella
upgrade, it has only been downhill since before seeing a slight rebound at the end of June
Market Cap % of Market
Source: CoinGecko
2023 Q1
$51B
Total DeFi Market Cap and DeFi Share of Overall Market (Jan – Jun 2023)
TradFi
banking
turmoil
2023 Q2
$48B
Even though the DeFi market cap fell
slightly by 5.2% from $51B in 2023 Q1 to
$48B in 2023 Q2, it still underperformed
the overall crypto market, shrinking its
market share.
The success of the Shapella upgrade in
April brought DeFi’s market cap to a
quarterly high of $56B, yet DeFi’s
dominance only saw a minor increase from
4.0% to 4.2%.
-5.2%
DeFi Market Cap Decrease in
2023 Q2
After the SEC charged Binance and
Coinbase in June, DeFi’s market cap saw an
impressive recovery, bouncing 16.4% from
$42B on 15 June to on $48B by the end of
June.
Unfortunately, the rest of the crypto
markets also moved higher, causing DeFi’s
dominance to fall further below to 3.9%.
Ethereum
Shapella
upgrade
SEC
charges
Binance &
Coinbase
CoinGecko 2023 Q2 Crypto Industry Report 25
2023 Q2 DeFi Multichain Market Share
Ethereum continues to strengthen its dominance and now controls nearly 70% of multichain
TVL, while Tron breaks ahead of the pack to #2 as BSC falls off
$54B $62B $62B $67B $65B
Source: DefiLlama
*Monthly TVL is calculated by taking the average TVL daily for each month.
Market
Share $63B
Total TVL
Multi-chain Total Value Locked (TVL) Breakdown (Jan – Jun 2023)
Despite fears of massive withdrawals of
staked ETH after the Shapella upgrade, it
did not come to pass and instead Ethereum
has continued to increase its dominance,
increasing its TVL share from 67% to 69% in
2023 Q2, attracting an additional $1.6B.
While 2022 saw Tron going neck-and-neck
with BNB Smart Chain (BSC) for the second
spot, the former has pulled further ahead in
TVL due to net outflows from BSC. While
Tron increased its TVL by 6.8% from $5.4B
to $5.7B in 2023 Q2, TVL on BSC fell by
30.9%, from $5.0B to $3.5B in the same
period.
+1.9%
Multi-chain DeFi TVL Increase
in 2023 Q2
In the past quarter, TVL on zero-knowledge
rollups such as zkSync Era and Polygon
zkEVM have risen exponentially. As the next
potential targets for airdrop hunters, TVL on
zkSync Era has grown from $27M on March
31 to $180M at the end of June.
65% 65% 67% 68% 68% 69%
9% 8% 8% 8% 8% 9%
8% 8% 7% 7% 7% 6%
10% 9% 8% 7% 7% 6%
0%
10%
20%
30%
40%
50%
60%
70%
80%
90%
100%
Jan-23 Feb-23 Mar-23 Apr-23 May-23 Jun-23
Ethereum Tron Others BSC Arbitrum Polygon
Optimism Avalanche Solana Mixin Cronos Kava
CoinGecko 2023 Q2 Crypto Industry Report 26
2023 Q2 DeFi Ecosystem Overview
While overall DeFi tokens market cap declined by $5.2B (-17.6%), liquid staking governance
tokens and lending tokens increased their market share relative to other DeFi segments
Asset
Management
$0.12B
Fixed Interest
$0.13B
After a +65.2% increase in 2023 Q1, the overall DeFi market cap fell by
17.6%, dropping $5.2B from $29.6B to $24.4B in 2023 Q2. Asset
management protocols declined the most in percentage terms, plunging
34.5% from $181M to $118M.
The Ethereum Shapella upgrade enabled withdrawals for staked Ether but
turbocharged liquid staking protocols, cementing their position in the
current DeFi landscape. Even though liquid staking protocols lost 17.4% of
their market cap from $4.2B to $3.7B, the segment has increased its
market share compared to 2023 Q1.
Fixed interest protocols were the only gainer of 2023 Q2, rising by 19.6%
from $110M to $131M, largely driven by the popularity of Pendle. The
success of Pendle also contributed to the creation of the LSDFi segment in
DeFi (see slide 27).
Market Cap of Each DeFi Category* (2023 Q2)
*Market cap includes only governance and utility tokens (excluding stablecoins and wrapped tokens
Source: CoinGecko
CoinGecko 2023 Q2 Crypto Industry Report 27
LSDFi
The attention surrounding liquid staking derivatives have allowed protocols to build on top of
this new core primitive, resulting in a new DeFi segment known as ‘LSDFi’
Fixed Yield
§ Fixed interest protocols such as Pendle and Flashstake
separate the staking yield from liquid staking tokens,
allowing users to hedge their yield at current rates.
§ Pendle allows users to purchase ETH at a discount and
receive a fixed amount of ETH upon a chosen maturity
date.
§ Flashstake lets users lock in their ETH or LSDs for a chosen
duration to receive yield tokens from a selection of various
assets.
Flashstake
Collateralized Stablecoins
§ Similar to MakerDAO’s Maker Vaults, protocols such as
Lybra, Gravita and Raft allow users to deposit their LSDs as
collateral to borrow/mint the protocol’s native stablecoin.
§ These protocols typically maintain a collateralization ratio
above 150%, along with other stablecoin mechanisms such
as stability pools and redemptions.
§ Lybra distributes the generated yield from the underlying
LSDs to stablecoin holders, creating a yield-bearing
stablecoin.
Lybra
Raft
Gravita
Restaking
§ EigenLayer introduced the concept of restaking, where
users could reuse their LSDs to provide security to other
dApps on the network and earn additional rewards in the
process.
§ Tenet expands on this concept, utilizing LSDs as collateral
for securing its own Layer-1 network. Holders can stake
their existing LSDs with the network’s validators, as well as
earn fees and rewards from the network’s ecosystem of
protocols.
LSD Indices
§ LSD indices offer a diversified basket of staked assets,
allowing holders to gain exposure to varying yield rates
from different LSD protocols, through a single token.
§ The index tokens can be minted using ETH or the
underlying LSDs. On Asymmetry Finance, the deposited
ETH will be separated across supported LSD protocols.
§ These diversified asset baskets can also function as
liquidity pools, where users can swap between different
LSDs.
Tenet
EigenLayer
unshETH
LSDx
Asymmetry
Finance
Pendle
CoinGecko 2023 Q2 Crypto Industry Report
Bridges 2023 Q2 2023 Q1 QoQ % Change
WBTC $4.8B $4.3B 12.9%
JustCryptos $3.6B $3.3B 8.1%
Multichain $1.3B $1.5B 10.4%
Stargate $402M $369M 9.0%
Portal $371M $281M 31.2%
hBTC $272M $253M 7.5%
Poly Network $272M $338M 19.4%
Synapse $179M $188M 5.1%
Orbit Bridge $125M $187M 33.1%
Celer cBridge $110M $142M 22.6%
Thorchain $93M $118M 21.0%
Axelar $87M $89M 2.8%
28
2023 Q2 Cross-chain Bridge Liquidity
The launch of new networks and rumors of potential airdrops drove TVL on bridges higher by
4.4%
The top 3 cross-chain bridges have remained largely unchanged in 2023
Q2, with WBTC experiencing net inflows, in line with the 6.9% price
appreciation of Bitcoin. However, most of these inflows only came
after June 15th, just after the SEC sued Binance and Coinbase. On the
other hand, Multichain lost 10.4% of its TVL, dropping from $1.5B to
$1.3B. The protocol has yet to fully recover after temporarily halting
cross-chain activities in June due to ‘unforeseen circumstances,’
Wormhole’s Portal token bridge was the top gainer of 2023 Q2, its
liquidity surging by 31.2%, from $281M to $371M. The rise of Portal’s
TVL was largely contributed by the launch of the Sui mainnet in May,
where it has become the official bridge.
Stargate also saw a TVL increase of 9% from $369M to $402M,
perhaps due to rumors of an impending airdrop of LayerZero’s
governance token, ZRO. Historically, providing liquidity for cross-chain
protocols has been a criteria in determining airdrop eligibility.
Top 12 Bridges with Highest Liquidity (as of July 1, 2023)
Source: DeFiLlama
Total Cross-chain Bridge Liquidity
as of July 1, 2023
$11.61B
(+4.4%)
Making its way into the top 12, Axelar fell slightly by 2.8% from $89M
to $87M. Compared to other cross-chain protocols, Axelar provides
more bridging avenues for the Cosmos ecosystem, supporting
networks such as Juno, Kava and Kujira.
CoinGecko 2023 Q2 Crypto Industry Report 29
Bitget Ad Slide
CoinGecko 2023 Q2 Crypto Industry Report 30
NON-FUNGIBLE TOKENS (NFTs)
CoinGecko 2023 Q2 Crypto Industry Report
$0.9B
$1.9B
$1.5B
$1.1B
$0.7B
$0.8B
$0.1B
$0.2B
$0.1B
$0.1B
$0.1B
$0.0B
$0.5B
$1.0B
$1.5B
$2.0B
$2.5B
Jan-23 Feb-23 Mar-23 Apr-23 May-23 Jun-23
Ethereum Bitcoin ImmutableX Polygon Solana Flow Arbitrum BNB Chain
31
2023 Q2 NFT Trading Volume across Top 8 Chains
NFT Trading Volume decreased by 35.0% in Q2 compared to Q1, despite Bitcoin Ordinals quickly
gaining popularity; meanwhile Solana NFT trading volumes decrease significantly
$4.84B
Source: FootPrint Analytics; Cryptoslam
*Wash trades on LooksRare , X2Y2 and Blur are excluded
**Cardano has been excluded due to irregular trading behavior
Volume
$3.15B
Top 8 Chains for NFT Trading Volume (Jan – Jun 2023)
-35.0%
Trading Volume Decrease
in 2023 Q2
$1.07B
$2.08B
$1.69B
$0.97B $1.00B
$1.18B
NFT trading volumes have decreased by
35.0% from $4.84B in 2023 Q1 to $3.15B in
2023 Q2.
While Ethereum maintained its dominance
of 83.0% in the NFT market in Q2, its
dominance did temporarily decline to
73.3% in May 2023, as Bitcoin Ordinals
gained popularity and captured nearly
20.3% of the NFT trading volume.
In contrast, trading volume for Solana NFTs
experienced a significant decline of 78.6%,
dropping from $184.91 million in Q1 to
$39.66 million in Q2. Part of the decline can
be attributable to the migration of DeGods
and y00ts, which were significant
contributors to Solana sales volume.
After its migration, y00ts has become one of
the top 10 traded NFT collections on
Polygon on all-time sales volume.
CoinGecko 2023 Q2 Crypto Industry Report
$0.4B
$1.1B $1.1B
$0.7B
$0.5B
$0.7B
$0.4B
$0.7B
$0.3B
$0.3B
$0.2B
$0.2B
$0.1B
$0.1B
$0.1B
$0.0B
$0.5B
$1.0B
$1.5B
$2.0B
$2.5B
Jan-23 Feb-23 Mar-23 Apr-23 May-23 Jun-23
Blur Opensea Magic Eden X2Y2 Unisat OKX Cryptopunks Ordinals Wallet LooksRare
$0.92B
$1.04B
$1.10B
$0.87B
$2.02B
$1.53B
71.2%
18.8%
4.6%
32
2023 Q2 NFT Platform Trading Volumes
Blur maintains its position as the dominant NFT marketplace, controlling 71.2% of trading
volume in June 2023
In Q2, Blur maintained its position as the
leading NFT marketplace, bolstered by the
introduction of Blend, a lending platform
for NFTs, as well as the promise of BLUR
token rewards. Their share of trading
volume increased from 56% in 2023 Q1 to
65% in 2023 Q2. Meanwhile, Opensea's
share continued to decline, falling from
33% in 2023 Q1 to 23% in 2023 Q2.
-37.0%
NFT Marketplace Trading
Volume Decrease in 2023 Q2
The emergence of Bitcoin Ordinals also led
to new NFT marketplaces which support
these NFTs, including UniSat, OKX and
Ordinals Wallet. On the back of this hype
Unisat and OKX have now become the
fifth and sixth largest marketplace in
June, pulling ahead of more established
players CryptoPunks and LooksRare.
Magic Eden, which previously focused on
Solana, also added support for Ordinals
in a bid to recapture market share.
Source: FootPrint Analytics, Dune (@domo)
*OpenSea volumes include Ethereum, Polygon and Solana; Magic Eden volumes include Solana, Ethereum and Bitcoin
***Wash trades on Blur, LooksRare and X2Y2 are excluded
$4.59B $2.89B
Top 9 NFT Marketplaces (Jan – Jun 2023)
Volume
CoinGecko 2023 Q2 Crypto Industry Report 33
2023 Q2 Notable NFT Collections
It was an eventful Q2 for the NFT space: NFT Prices Experience Roller Coaster Ride, PFP
Sentiment Hits All-Time Low as bluechips seem to implode against holder expectations
Its All Fun and Games at Memeland
§ Memeland has garnered significant attention in the NFT ecosystem
as it one of the rare NFT projects that is backed by a profitable
web2 company, 9GAG. The platform boasts three notable
collections, namely "You The Real MVP," "The Potatoz," and "The
Captainz."
§ During Q2 2023, Memeland marked several milestones. They
successfully launched their first GM show, introduced both
season 0 and season 1 of their raids, and revealed their
Captainz collection.
§ However, floor price of Captainz dumped post-reveal due to
having similarities in the NFT’s base models, which allows
customization of traits based on the NFT holder’s preference.
Azuki Fumbles
§ Azuki has established itself as a prominent NFT collection, with its
community demonstrating resilience and overcoming challenges in
the past year.
§ The announcement of their "Follow the Rabbit" event in Las Vegas
generated substantial interest in the space. During this event,
Azuki unveiled a new collection, Azuki Elementals. The collection
garnered immense attention and demand, resulting in a quick sell-
out within less than 10 minutes at 2 ETH.
§ Despite the successful sale, Azuki faced backlash as the revealed art
for the Azuki Elementals collection disappointed the community.
Floor prices dropped below the initial mint price of 2 ETH due to
perceived similarities with the original collection.
Milady Maker Making Its Way Up
§ Milady Maker gained significant attention in the NFT space as it
experienced a remarkable surge in value, rising from 1.1 ETH in
April to a peak of 5.5 ETH in May, before dipping back to 3.0 ETH
at the end of Q2.
§ The surge in price was further fueled by the announcement from
Blur's Blend platform that Milady Maker would be one of the
three featured NFT collections, alongside Azuki and Cryptopunks,
supported by the platform upon its launch on May 1.
§ The momentum for Milady Maker continued to grow when Elon
Musk tweeted a picture of a Milady NFT with the caption “There Is
No Meme, I Love You”.
Yuga Labs Under Fire
§ Yuga Labs have been getting the heat, as the floor prices of their
NFT collections experienced a downward trend in Q2 2023. The
exact reasons behind this decline are uncertain, and it remains
unclear whether it can be attributed to Blur points farmers
creating artificial buyers who subsequently dumped the floor, or if
the ApeCoin DAO’s extensive treasury burning occurred without
bringing significant results.
§ Despite floor price trending downwards, Yuga Labs have continued
to roll out parts of its gaming ecosystem in Q2, including the
introduction of Otherside: Legends of Mara and HV-MTL forge.
§ Additionally, they have upgraded Meebits, transforming them from
static profile pictures (PFP) into dynamic ones.
CoinGecko 2023 Q2 Crypto Industry Report 34
NFT Lending
The launch of Blend pushed NFT lending volumes higher by 453%, but some high-profile
collections crumbled under the massive demand for loans
Although NFT lending platforms were already recording millions in
monthly volume in the early part of 2023, the launch of Blur Lending
(Blend) , took the space by storm, increasing NFT lending volumes by
453% from $74M to $411M in May 2023.
Blend featured innovative mechanisms such as fixed interest rates and
perpetual loans, but its success can also be attributed to Blur’s
incentive model, which allows lenders to earn Blur points to receive
future BLUR token drops.
Azukis and Bored Apes made up 57.9% of all loans on Blend thus far,
equating to $655M in borrowed funds. Ironically despite their “blue chip”
status, the ETH floor prices for Azukis and Bored Apes have plunged by
36.6% and 41.9% respectively in 2023 Q2, resulting in 317 liquidations
across both collections.
$346M
$786M
$26M $23M $25M $24M
$27M
$21M
$38M $40M $29M
$0M
$100M
$200M
$300M
$400M
$500M
$600M
$700M
$800M
$900M
Jan-23 Feb-23 Mar-23 Apr-23 May-23 Jun-23
Blend NFTFi Arcade BendDAO X2Y2 Pine
Source: Dune Analytics (@ahkek, @beetle)
Top 6 NFT Lending Platform Volume (Jan – Jun 2023)
Volume
$84M $87M $84M $74M
$411M
$826M 29.4%
28.5%
12.7%
9.7%
7.8%
Azuki
BAYC
MAYC
Wrapped CryptoPunks
DeGods
Milady
Pudgy Penguins
BEANZ Official
Others
Loan Origination Volume on Blend (by Collection)
$1.1B
CoinGecko 2023 Q2 Crypto Industry Report
Track ‘em all with the new
CoinGecko mobile app
100+
Crypto Categories Trending Coins
Hottest NFTs
Download Now
CoinGecko 2023 Q2 Crypto Industry Report 36
EXCHANGES
CoinGecko 2023 Q2 Crypto Industry Report 37
2023 Q2 Top Crypto Exchanges Trading Volume
Trading volume fell by 19.5% from 2023 Q1; majority of losses coming from spot markets, with
CEXes particularly badly hit
-19.5%
Top Crypto Exchanges Trading
Volume Decrease in 2023 Q2
Trading
Volume
Source: CoinGecko
Total Trading Volume ($ Trillion)
$3.1T $2.6T $2.8T
$3.1T $3.2T $4.2T
The ratio of CEX : DEX spot trading volume
dropped to 89.1% in Q2. This is the first
time since 2022 Q2 in which CEX:DEX ratio
has dropped below 90%.
CEX:DEX derivatives trading volume ratio
stayed at 97.9%, with traders still
preferring to trade on CEX’s.
Top crypto exchanges closed out 2023 Q2
with an -19.5% decrease in total trading
volume from 2023 Q1 to 2023 Q2. Total
trading volume stands at $8.5T for the
entire quarter. Spot DEXes declined less
than spot CEXes, and perpetual markets
held up better than spot markets.
Derivatives trading volume still made up
the bulk of total trading volume with a
77.3% share.
Top Cryptocurrency Exchanges Trading Volume (Jan - Jun 2023)
$2.24T $2.29T
$3.15T
$2.43T
$2.07T
$2.28T
$0.74T
$0.84T
$0.92T
$0.56T
$0.40T
$0.46T
$0.00T
$0.50T
$1.00T
$1.50T
$2.00T
$2.50T
$3.00T
$3.50T
$4.00T
$4.50T
Jan-23 Feb-23 Mar-23 Apr-23 May-23 Jun-23
Top 10Perpetual CEX Top 6Perpetual DEX Top 10Spot CEX Top 10Spot DEX
CoinGecko 2023 Q2 Crypto Industry Report
63% 65%
61%
53% 54% 52%
9% 9%
7%
10% 6% 8%
5% 5%
6%
6%
7% 7%
7% 5%
5%
6%
6% 6%
3%
3% 4% 5%
5% 3% 5%
3% 5%
5%
5% 5%
5% 6% 6% 4%
5% 5% 5% 4%
0%
10%
20%
30%
40%
50%
60%
70%
80%
90%
100%
Jan-23 Feb-23 Mar-23 Apr-23 May-23 Jun-23
Binance Upbit OKX Coinbase Bybit Kucoin Bitget MEXC Gate Kraken
38
2023 Q2 Top 10 Spot Centralized Exchanges (CEX) Trading Volume
Binance continued as the dominant spot CEX with 52.0% market share in June 2023, but is
progressively losing market share to its competitors
Total Trading Volume ($ Trillion) -43.2%
Top 10 CEX Total Trading
Volume Decrease in 2023 Q2
Source: CoinGecko
Top 10 Spot CEX Trading Volume Breakdown (Jan – Jun 2023)
Market
Share
Top-10 CEXes recorded $1.42T in spot
trading volume in 2023 Q2. Despite
showing signs of recovery in Q1, trading
volume has since plummeted 43.2% QoQ.
With pressure mounting from regulators,
Binance has seen its dominance slide.
However, it managed to maintain a 52%
market share in June, down from 61% in
March.
Huobi and Crypto.com have been edged
out of the top 10, with Bybit and Bitget
taking their places.
Both exchanges saw an increase in Q2
trading volume of $13.1B and $1.5B
respectively, the only exchanges in the
top 10 to see gains.
$0.6T $0.4T $0.5T
$0.7T $0.8T $0.9T
CoinGecko 2023 Q2 Crypto Industry Report
62% 65%
72%
64%
70%
65%
14% 8%
9%
10%
6%
11%
5%
7%
5%
11%
13% 9%
5% 6%
4% 5%
4%
7%
7% 4%
3% 3%
2% 2%
3%
0%
10%
20%
30%
40%
50%
60%
70%
80%
90%
100%
Jan-23 Feb-23 Mar-23 Apr-23 May-23 Jun-23
Uniswap Curve Pancakeswap Dodo Balancer Quickswap Jupiter THORChain Sushi TraderJoe
39
2023 Q2 Top 10 Spot Decentralized Exchanges (DEX) Trading Volume
DEX trading volumes decreased by -28.1% in 2023 Q2, as Uniswap solidified its dominance over
the sector
Curve saw volumes plummet in May
despite the release of its crvUSD
stablecoin. The stableswap ended June
with 11% of market share.
Meanwhile, Trader Joe which managed to
break into the top 10 in 2023 Q1, has seen
a drop in volume. The exchange ended Q2
with just 0.3% of market share.
Top 10 DEXs recorded a total of $155
billion in spot trading volume in 2023
Q2, representing a 30.8% drop QoQ.
-30.8%
Top 10 DEXs Total Trading
Volume Decrease in 2023 Q2
Despite memecoin season in full swing
(majority launched on DEXs), volumes on
DEXs didn’t experience a noticeable uptick.
However, their volumes saw less decline
compared to spot CEXes.
Source: CoinGecko
Top 10 Spot DEX Trading Volume Breakdown (Jan – Jun 2023)
Total Trading Volume ($ Billion)
Market
Share $57B $47B $46B
$60B $61B $95B
CoinGecko 2023 Q2 Crypto Industry Report
79%
71% 71%
47%
63% 63%
4%
8%
13%
24%
15% 17%
6%
7%
5%
11%
13% 10%
6% 8%
6%
5%
5% 6%
11%
0%
10%
20%
30%
40%
50%
60%
70%
80%
90%
100%
Jan-23 Feb-23 Mar-23 Apr-23 May-23 Jun-23
Ethereum Arbitrum BSC Polygon Solana Optimism THORChain Avalanche Fantom
40
2023 Q2 Spot DEX Trading Volume Breakdown by Chain
Ethereum remained the most popular chain for DEX trading with 57% market share, though its
dominance have been waning
Ethereum captured $87.8 billion of DEX
trading volume in 2023 Q2, representing
57% amongst all chains.
This is a drop of -44.7% from 2023 Q1,
where Ethereum had $158.8 billion in
trading volume and 74% market share .
In terms of market share, Arbitrum has
pulled ahead to be the clear #2 in terms
of DEX trading volume ahead of BSC,
thanks to Uniswap and Trader Joe.
Source: CoinGecko
Spot DEX Trading Volume Breakdown by Chain (Jan – Jun 2023)
Market
Share
Having lost ground in Q1, BSC bounced
back in Q2 to capture 10% market share in
June and keep its #3 position. However, it
may continue to struggle as the FUD piles
up against Binance.
Polygon consistently has the fourth highest
trading volume with ~6.0% market share.
As of June the Top 4 Chains control >95%
of volume.
Total Trading Volume ($ Billion)
$57B $47B $46B
$60B $61B $95B
CoinGecko 2023 Q2 Crypto Industry Report
56% 57% 56% 54% 53% 53%
14% 15% 16% 17% 17% 18%
12% 12% 12% 13% 12% 12%
10% 9% 8% 9% 10% 9%
0%
10%
20%
30%
40%
50%
60%
70%
80%
90%
100%
Jan-23 Feb-23 Mar-23 Apr-23 May-23 Jun-23
Binance OKX Bybit Bitget KuCoin Gate Huobi BitMEX Deribit Crypto.com
41
2023 Q2 Top 10 Centralized Perpetual Exchanges Trading Volume
While the top 10 centralized perpetual exchanges experienced a slight decline in trading
volume in 2023 Q2, the relative market share of the exchanges remained largely the same
Between 2023 Q1 to Q2, volume across
top 10 centralized perpetual exchanges
declined slightly by 11.6% from $7.7T to
$6.8T. However, this is still 4.5x larger than
the Top 10 centralized spot exchanges.
Relative share of trading volume
between centralized perpetual
exchanges remained largely the same
across the Top 10, with Binance, OKX, Bybit
and Bitget holding the Top 4 spots.
The Top 4 exchanges together control
>90% of the trading volume. Binance
remains the top centralized perpetual
exchange with >50% of the trading volume
alone.
Source: CoinGecko
-11.6%
Top 10 Centralized Perpetual
Exchanges Trading Volume
Decrease in 2023 Q2
Top 10 Centralized Perpetual Exchanges Trading Volume (Jan – Jun 2023)
Total Trading Volume ($ Trillion)
$2.4T $2.1T $2.3T
$2.2T $2.3T $3.2T
Market
Share
CoinGecko 2023 Q2 Crypto Industry Report
$0B
$5B
$10B
$15B
$20B
$25B
$30B
Jan-23 Feb-23 Mar-23 Apr-23 May-23 Jun-23
Binance Bybit Bitget OKX Gate KuCoin Deribit BitMEX Huobi Crypto.com
42
2023 Q2 Top 10 Centralized Perpetual Exchanges Open Interest
Besides a short-lived spike in mid-April, OI across Top 10 centralized perpetual exchanges only
saw a modest increase in Q2
Other than a short-lived spike in mid-
April during Ethereum’s Shapella upgrade,
OI across Top 10 centralized perpetual
exchanges only showed a modest
increase from $23.2B to $24.4B (+5.1%) in
2023 Q2.
Source: CoinGecko
+5.1%
Top 10 Centralized Perpetual
Exchanges OI Increase from
1 Apr 2023 to 30 Jun 2023
Centralized perpetual exchanges still
dwarf decentralized perpetual protocols
in terms of OI, with ~40x larger in size.
Top 10 Centralized Perpetual Exchanges Open Interest (Jan – Jun 2023)
Binance: 35%
Bybit: 19%
Bitget: 13%
OKX; 12%
Gate: 7%
KuCoin: 7%
Deribit: 4%
BitMEX: 1%
Huobi: 1%
Crypto.com: 1%
Open
Interest
Share of OI between exchanges also
largely stayed the same, with Binance
still leading with ~35% of OI, followed by
Bybit at ~19%.
Despite the Top 4 contributing only ~80%
of OI, they managed to capture >90% of
volume. The next two exchanges KuCoin
and Gate contribute ~7% of OI each but
only captured ~2-3% of volume.
CoinGecko 2023 Q2 Crypto Industry Report
77%
69% 66%
59% 57%
72%
13%
15%
15%
17%
12%
9%
14%
8%
8%
9% 7%
7%
8%
7%
5% 6%
10% 7%
0%
10%
20%
30%
40%
50%
60%
70%
80%
90%
100%
Jan-23 Feb-23 Mar-23 Apr-23 May-23 Jun-23
dYdX GMX Kwenta Gains Network Level Finance Perpetual Protocol
43
2023 Q2 Decentralized Perpetual Protocols Trading Volume
While trading volume on decentralized perpetuals fell by $20.4B (-12.7%), dYdX regains its
market share, while newer protocols continue to challenge GMX
In 2023 Q2, the top 6 decentralized
perpetual protocols recorded $139.7B in
trading volume, a $20.4B decrease from
$160B in 2023 Q1. Compared to CEXes,
decentralized perpetuals represent just
2.1% of the $6.8 trillion in trading
volume on CEX perpetuals.
As volumes on decentralized perpetuals
rebounded towards the later part of 2023
Q2, dYdX regained some of its market
share from 66% in March to 72% in June.
While GMX was the top contender against
dYdX, its position is now threatened by
newer entrants such as Kwenta and
Gains Network. While GMX is still slightly
ahead with a 9% share of the market,
Kwenta and Gains Network are catching
up as they expand across to other
altchains / rollups.
Top 6 Decentralized Perpetual Protocols Trading Volume (Jan – Jun 2023)
Total Trading Volume ($ Billion)
$52B $36B $51B
$47B $48B $65B
Market
Share
Source: Dune Analytics, GMX Analytics, Token Terminal
-12.7%
Top 6 Decentralized Perpetual
Protocols Trading Volume
Decrease in 2023 Q2
CoinGecko 2023 Q2 Crypto Industry Report
$0M
$100M
$200M
$300M
$400M
$500M
$600M
$700M
$800M
$900M
Jan-23 Feb-23 Mar-23 Apr-23 May-23 Jun-23 Jul-23
dYdX GMX Kwenta Gains Network Perpetual Protocol Level Finance
44
2023 Q2 Decentralized Perpetual Protocols Open Interest
Open Interest on decentralized perpetual exchanges saw a minor 3.2% decrease in 2023 Q2,
while dYdX continues to increase its dominance
Total open interest across the top 6
decentralized perpetual protocols fell
slightly from $629M to $609M, a sign that
on-chain traders are still maintaining
their positions despite BTC and ETH’s
tumultuous price action in the past
quarter.
dYdX still controls the majority of open
interest between these protocols,
increasing its market share from 43%
to 52% in 2023 Q2, with $317M of open
interest currently on its platform.
Together, the top 3 decentralized
perpetual platforms – dYdX, GMX, and
Kwenta – currently dominate 90% of
total open interest among the 6
protocols.
Top 6 Decentralized Perpetual Protocols Open Interest (Jan 2023 – Jun 2023)
Open
Interest
Source: CoinGecko, Dune Analytics, GMX Analytics, Level Finance Analytics
dYdX: 52%
GMX: 22%
Kwenta: 16%
Gains: 9%
Perpetual: 1.4%
Level: 0.2%
-3.2%
Top 6 Decentralized Perpetual
Protocols OI Decrease from
1 Apr 2023 to 30 Jun 2023
CoinGecko 2023 Q2 Crypto Industry Report
The Most Comprehensive Cryptocurrency Data API
for Traders and Developers
CoinGecko’s enterprise-grade API is built upon the same infrastructure
that powers our industry-leading platform - CoinGecko.com.
Our REST APIs provide you access to historical and real-time data from
our extensive and ever-expanding list of exchanges and crypto assets.
Trusted by hundreds of the world’s leading cryptocurrency exchanges
and products, our API enables your project with reliable and accurate
data.
API for Business
750+
Exchanges
10,000+
Coins
3,000+
NFTs
50
Endpoints
10B+
Calls per Month
10 Years
Historical Data
and many more endpoint improvements shipped…
SIGN UP
FREE ONE MONTH for you!
Analyst API Subscription for Geckos
*
Promotion valid till 30 September 2023. Promo code only applicable for new subscription and
entitles the subscriber to a $129 discount for Analyst API Monthly or Yearly subscription.
SIGN UP
Subscribe now with this promo code:
WELCOME2023
CoinGecko 2023 Q2 Crypto Industry Report
FOLLOW US
46
CoinGecko 2023 Q2 Crypto Industry Report
THAT’S ALL! THANK YOU FOR READING :)
47

More Related Content

What's hot

Microsoft to Acquire LinkedIn: Overview for Investors
Microsoft to Acquire LinkedIn: Overview for InvestorsMicrosoft to Acquire LinkedIn: Overview for Investors
Microsoft to Acquire LinkedIn: Overview for InvestorsMicrosoft
 
Pitch Deck Teardown: Netmaker's $2.3M Seed deck
Pitch Deck Teardown: Netmaker's $2.3M Seed deckPitch Deck Teardown: Netmaker's $2.3M Seed deck
Pitch Deck Teardown: Netmaker's $2.3M Seed deckHajeJanKamps
 
2022 Annual Crypto Industry Report
2022 Annual Crypto Industry Report2022 Annual Crypto Industry Report
2022 Annual Crypto Industry ReportCoinGecko
 
Q4 2022 DBX Investor Presentation.pdf
Q4 2022 DBX Investor Presentation.pdfQ4 2022 DBX Investor Presentation.pdf
Q4 2022 DBX Investor Presentation.pdfDropbox
 
GTX's $25M pitch deck: new crypto exchange by 3AC & CoinFLEX founders
GTX's $25M pitch deck: new crypto exchange by 3AC & CoinFLEX foundersGTX's $25M pitch deck: new crypto exchange by 3AC & CoinFLEX founders
GTX's $25M pitch deck: new crypto exchange by 3AC & CoinFLEX foundersPitch Decks
 
Pitch Deck Teardown: Wilco's $7 million Seed deck
Pitch Deck Teardown: Wilco's $7 million Seed deckPitch Deck Teardown: Wilco's $7 million Seed deck
Pitch Deck Teardown: Wilco's $7 million Seed deckHajeJanKamps
 
Tracxn - Southeast Asia Tech - Top Business Model - Apr 2022
Tracxn - Southeast Asia Tech - Top Business Model - Apr 2022Tracxn - Southeast Asia Tech - Top Business Model - Apr 2022
Tracxn - Southeast Asia Tech - Top Business Model - Apr 2022Tracxn
 
Front Series D Investor Deck
Front Series D Investor DeckFront Series D Investor Deck
Front Series D Investor DeckFront
 
Pitch Deck Teardown: Honeycomb 's $50M Series D deck
Pitch Deck Teardown: Honeycomb 's $50M Series D deckPitch Deck Teardown: Honeycomb 's $50M Series D deck
Pitch Deck Teardown: Honeycomb 's $50M Series D deckHajeJanKamps
 
Inside Google's Numbers in 2017
Inside Google's Numbers in 2017Inside Google's Numbers in 2017
Inside Google's Numbers in 2017Rand Fishkin
 
2016 Digital predictions for marketing, tech, pop culture and everything in b...
2016 Digital predictions for marketing, tech, pop culture and everything in b...2016 Digital predictions for marketing, tech, pop culture and everything in b...
2016 Digital predictions for marketing, tech, pop culture and everything in b...Soap Creative
 
2023 Barclays Global Consumer Staples Conference.pdf
2023 Barclays Global Consumer Staples Conference.pdf2023 Barclays Global Consumer Staples Conference.pdf
2023 Barclays Global Consumer Staples Conference.pdfSYYIR
 
Kandola pitch deck
Kandola pitch deckKandola pitch deck
Kandola pitch deckTech in Asia
 
2023 Q3 Crypto Industry Report | CoinGecko
2023 Q3 Crypto Industry Report | CoinGecko2023 Q3 Crypto Industry Report | CoinGecko
2023 Q3 Crypto Industry Report | CoinGeckoCoinGecko
 
USDC issuer Circle's $9B SPAC pitch deck
USDC issuer Circle's $9B SPAC pitch deckUSDC issuer Circle's $9B SPAC pitch deck
USDC issuer Circle's $9B SPAC pitch deckPitch Decks
 
2023 Annual Crypto Industry Report | CoinGecko
2023 Annual Crypto Industry Report | CoinGecko2023 Annual Crypto Industry Report | CoinGecko
2023 Annual Crypto Industry Report | CoinGeckoCoinGecko
 
Pitch Deck Teardown: Scrintal's $1M Seed deck
Pitch Deck Teardown: Scrintal's $1M Seed deckPitch Deck Teardown: Scrintal's $1M Seed deck
Pitch Deck Teardown: Scrintal's $1M Seed deckHajeJanKamps
 
Mattermark 2nd (Final) Series A Deck
Mattermark 2nd (Final) Series A DeckMattermark 2nd (Final) Series A Deck
Mattermark 2nd (Final) Series A DeckDanielle Morrill
 

What's hot (20)

Microsoft to Acquire LinkedIn: Overview for Investors
Microsoft to Acquire LinkedIn: Overview for InvestorsMicrosoft to Acquire LinkedIn: Overview for Investors
Microsoft to Acquire LinkedIn: Overview for Investors
 
Anfin pitch deck
Anfin pitch deckAnfin pitch deck
Anfin pitch deck
 
Pitch Deck Teardown: Netmaker's $2.3M Seed deck
Pitch Deck Teardown: Netmaker's $2.3M Seed deckPitch Deck Teardown: Netmaker's $2.3M Seed deck
Pitch Deck Teardown: Netmaker's $2.3M Seed deck
 
2022 Annual Crypto Industry Report
2022 Annual Crypto Industry Report2022 Annual Crypto Industry Report
2022 Annual Crypto Industry Report
 
Q4 2022 DBX Investor Presentation.pdf
Q4 2022 DBX Investor Presentation.pdfQ4 2022 DBX Investor Presentation.pdf
Q4 2022 DBX Investor Presentation.pdf
 
GTX's $25M pitch deck: new crypto exchange by 3AC & CoinFLEX founders
GTX's $25M pitch deck: new crypto exchange by 3AC & CoinFLEX foundersGTX's $25M pitch deck: new crypto exchange by 3AC & CoinFLEX founders
GTX's $25M pitch deck: new crypto exchange by 3AC & CoinFLEX founders
 
Pitch Deck Teardown: Wilco's $7 million Seed deck
Pitch Deck Teardown: Wilco's $7 million Seed deckPitch Deck Teardown: Wilco's $7 million Seed deck
Pitch Deck Teardown: Wilco's $7 million Seed deck
 
Tracxn - Southeast Asia Tech - Top Business Model - Apr 2022
Tracxn - Southeast Asia Tech - Top Business Model - Apr 2022Tracxn - Southeast Asia Tech - Top Business Model - Apr 2022
Tracxn - Southeast Asia Tech - Top Business Model - Apr 2022
 
Front Series D Investor Deck
Front Series D Investor DeckFront Series D Investor Deck
Front Series D Investor Deck
 
Pitch Deck Teardown: Honeycomb 's $50M Series D deck
Pitch Deck Teardown: Honeycomb 's $50M Series D deckPitch Deck Teardown: Honeycomb 's $50M Series D deck
Pitch Deck Teardown: Honeycomb 's $50M Series D deck
 
Inside Google's Numbers in 2017
Inside Google's Numbers in 2017Inside Google's Numbers in 2017
Inside Google's Numbers in 2017
 
2016 Digital predictions for marketing, tech, pop culture and everything in b...
2016 Digital predictions for marketing, tech, pop culture and everything in b...2016 Digital predictions for marketing, tech, pop culture and everything in b...
2016 Digital predictions for marketing, tech, pop culture and everything in b...
 
2023 Barclays Global Consumer Staples Conference.pdf
2023 Barclays Global Consumer Staples Conference.pdf2023 Barclays Global Consumer Staples Conference.pdf
2023 Barclays Global Consumer Staples Conference.pdf
 
Kandola pitch deck
Kandola pitch deckKandola pitch deck
Kandola pitch deck
 
2023 Q3 Crypto Industry Report | CoinGecko
2023 Q3 Crypto Industry Report | CoinGecko2023 Q3 Crypto Industry Report | CoinGecko
2023 Q3 Crypto Industry Report | CoinGecko
 
USDC issuer Circle's $9B SPAC pitch deck
USDC issuer Circle's $9B SPAC pitch deckUSDC issuer Circle's $9B SPAC pitch deck
USDC issuer Circle's $9B SPAC pitch deck
 
2023 Annual Crypto Industry Report | CoinGecko
2023 Annual Crypto Industry Report | CoinGecko2023 Annual Crypto Industry Report | CoinGecko
2023 Annual Crypto Industry Report | CoinGecko
 
Pitch Deck Teardown: Scrintal's $1M Seed deck
Pitch Deck Teardown: Scrintal's $1M Seed deckPitch Deck Teardown: Scrintal's $1M Seed deck
Pitch Deck Teardown: Scrintal's $1M Seed deck
 
task.ly pitch deck
task.ly pitch decktask.ly pitch deck
task.ly pitch deck
 
Mattermark 2nd (Final) Series A Deck
Mattermark 2nd (Final) Series A DeckMattermark 2nd (Final) Series A Deck
Mattermark 2nd (Final) Series A Deck
 

Similar to 2023 Q2 Crypto Industry Report | CoinGecko

2023 Q1 Crypto Industry Report | CoinGecko
2023 Q1 Crypto Industry Report | CoinGecko2023 Q1 Crypto Industry Report | CoinGecko
2023 Q1 Crypto Industry Report | CoinGeckoCoinGecko
 
CoinGecko Q2 2022 Quarterly Report
CoinGecko Q2 2022 Quarterly ReportCoinGecko Q2 2022 Quarterly Report
CoinGecko Q2 2022 Quarterly ReportCoinGecko
 
CoinGecko Q2 2022 Quarterly Report
CoinGecko Q2 2022 Quarterly ReportCoinGecko Q2 2022 Quarterly Report
CoinGecko Q2 2022 Quarterly ReportCoinGecko
 
CoinGecko Q2 2022 Quarterly Report
CoinGecko Q2 2022 Quarterly ReportCoinGecko Q2 2022 Quarterly Report
CoinGecko Q2 2022 Quarterly ReportCoinGecko
 
CoinGecko Q2 2022 Quarterly Report
CoinGecko Q2 2022 Quarterly ReportCoinGecko Q2 2022 Quarterly Report
CoinGecko Q2 2022 Quarterly ReportCoinGecko
 
2022 Q3 Quarterly Report.pdf
2022 Q3 Quarterly Report.pdf2022 Q3 Quarterly Report.pdf
2022 Q3 Quarterly Report.pdfCoinGecko
 
CoinGecko Q3 2022 Quarterly Report
CoinGecko Q3 2022 Quarterly ReportCoinGecko Q3 2022 Quarterly Report
CoinGecko Q3 2022 Quarterly ReportCoinGecko
 
COINBASE - 2023 Crypto Market Outlook.pdf
COINBASE - 2023 Crypto Market Outlook.pdfCOINBASE - 2023 Crypto Market Outlook.pdf
COINBASE - 2023 Crypto Market Outlook.pdfdigitalinasia
 
Crypto Outlook Report 2024 by TradeDOG Group
Crypto Outlook Report 2024 by TradeDOG GroupCrypto Outlook Report 2024 by TradeDOG Group
Crypto Outlook Report 2024 by TradeDOG Grouptdtradedog
 
2022 Annual Review.pdf
2022 Annual Review.pdf2022 Annual Review.pdf
2022 Annual Review.pdfBrettMunster1
 
2024 Q1 Crypto Industry Report | CoinGecko
2024 Q1 Crypto Industry Report | CoinGecko2024 Q1 Crypto Industry Report | CoinGecko
2024 Q1 Crypto Industry Report | CoinGeckoCoinGecko
 
Bloomberg Crypto Outlook - May 2021
Bloomberg Crypto Outlook  - May 2021Bloomberg Crypto Outlook  - May 2021
Bloomberg Crypto Outlook - May 2021Peter Wises
 
CoinGecko 2019 Year End Cryptocurrency Report
CoinGecko 2019 Year End Cryptocurrency ReportCoinGecko 2019 Year End Cryptocurrency Report
CoinGecko 2019 Year End Cryptocurrency ReportCoinGecko
 
Overview of Digital Assets and Blockchain - Goldman Sachs (Asia) 2021.pdf
Overview of Digital Assets and Blockchain - Goldman Sachs (Asia) 2021.pdfOverview of Digital Assets and Blockchain - Goldman Sachs (Asia) 2021.pdf
Overview of Digital Assets and Blockchain - Goldman Sachs (Asia) 2021.pdfDavidYao28
 
The Overall Web3, Crypto & Blockchain Report 2023
The Overall Web3, Crypto & Blockchain Report 2023The Overall Web3, Crypto & Blockchain Report 2023
The Overall Web3, Crypto & Blockchain Report 2023Crypto Monk
 
droomdroom-com-a-guide-to-bitcoin-dominance-.pdf
droomdroom-com-a-guide-to-bitcoin-dominance-.pdfdroomdroom-com-a-guide-to-bitcoin-dominance-.pdf
droomdroom-com-a-guide-to-bitcoin-dominance-.pdfDroom Droom
 
Authors Anna, Alisa, David & PreslavaThis article is desi.docx
Authors Anna, Alisa, David & PreslavaThis article is desi.docxAuthors Anna, Alisa, David & PreslavaThis article is desi.docx
Authors Anna, Alisa, David & PreslavaThis article is desi.docxjesuslightbody
 
Crypto Market Report: Bitcoin Outlook 2021
Crypto Market Report: Bitcoin Outlook 2021Crypto Market Report: Bitcoin Outlook 2021
Crypto Market Report: Bitcoin Outlook 2021Interdax
 
Why Invest in Cryptocurrencies?
Why Invest in Cryptocurrencies?Why Invest in Cryptocurrencies?
Why Invest in Cryptocurrencies?InvestingTips
 

Similar to 2023 Q2 Crypto Industry Report | CoinGecko (20)

2023 Q1 Crypto Industry Report | CoinGecko
2023 Q1 Crypto Industry Report | CoinGecko2023 Q1 Crypto Industry Report | CoinGecko
2023 Q1 Crypto Industry Report | CoinGecko
 
CoinGecko Q2 2022 Quarterly Report
CoinGecko Q2 2022 Quarterly ReportCoinGecko Q2 2022 Quarterly Report
CoinGecko Q2 2022 Quarterly Report
 
CoinGecko Q2 2022 Quarterly Report
CoinGecko Q2 2022 Quarterly ReportCoinGecko Q2 2022 Quarterly Report
CoinGecko Q2 2022 Quarterly Report
 
CoinGecko Q2 2022 Quarterly Report
CoinGecko Q2 2022 Quarterly ReportCoinGecko Q2 2022 Quarterly Report
CoinGecko Q2 2022 Quarterly Report
 
CoinGecko Q2 2022 Quarterly Report
CoinGecko Q2 2022 Quarterly ReportCoinGecko Q2 2022 Quarterly Report
CoinGecko Q2 2022 Quarterly Report
 
2022 Q3 Quarterly Report.pdf
2022 Q3 Quarterly Report.pdf2022 Q3 Quarterly Report.pdf
2022 Q3 Quarterly Report.pdf
 
CoinGecko Q3 2022 Quarterly Report
CoinGecko Q3 2022 Quarterly ReportCoinGecko Q3 2022 Quarterly Report
CoinGecko Q3 2022 Quarterly Report
 
COINBASE - 2023 Crypto Market Outlook.pdf
COINBASE - 2023 Crypto Market Outlook.pdfCOINBASE - 2023 Crypto Market Outlook.pdf
COINBASE - 2023 Crypto Market Outlook.pdf
 
Crypto Outlook Report 2024 by TradeDOG Group
Crypto Outlook Report 2024 by TradeDOG GroupCrypto Outlook Report 2024 by TradeDOG Group
Crypto Outlook Report 2024 by TradeDOG Group
 
2022 Annual Review.pdf
2022 Annual Review.pdf2022 Annual Review.pdf
2022 Annual Review.pdf
 
2024 Q1 Crypto Industry Report | CoinGecko
2024 Q1 Crypto Industry Report | CoinGecko2024 Q1 Crypto Industry Report | CoinGecko
2024 Q1 Crypto Industry Report | CoinGecko
 
Bloomberg Crypto Outlook - May 2021
Bloomberg Crypto Outlook  - May 2021Bloomberg Crypto Outlook  - May 2021
Bloomberg Crypto Outlook - May 2021
 
Year End Review.pdf
Year End Review.pdfYear End Review.pdf
Year End Review.pdf
 
CoinGecko 2019 Year End Cryptocurrency Report
CoinGecko 2019 Year End Cryptocurrency ReportCoinGecko 2019 Year End Cryptocurrency Report
CoinGecko 2019 Year End Cryptocurrency Report
 
Overview of Digital Assets and Blockchain - Goldman Sachs (Asia) 2021.pdf
Overview of Digital Assets and Blockchain - Goldman Sachs (Asia) 2021.pdfOverview of Digital Assets and Blockchain - Goldman Sachs (Asia) 2021.pdf
Overview of Digital Assets and Blockchain - Goldman Sachs (Asia) 2021.pdf
 
The Overall Web3, Crypto & Blockchain Report 2023
The Overall Web3, Crypto & Blockchain Report 2023The Overall Web3, Crypto & Blockchain Report 2023
The Overall Web3, Crypto & Blockchain Report 2023
 
droomdroom-com-a-guide-to-bitcoin-dominance-.pdf
droomdroom-com-a-guide-to-bitcoin-dominance-.pdfdroomdroom-com-a-guide-to-bitcoin-dominance-.pdf
droomdroom-com-a-guide-to-bitcoin-dominance-.pdf
 
Authors Anna, Alisa, David & PreslavaThis article is desi.docx
Authors Anna, Alisa, David & PreslavaThis article is desi.docxAuthors Anna, Alisa, David & PreslavaThis article is desi.docx
Authors Anna, Alisa, David & PreslavaThis article is desi.docx
 
Crypto Market Report: Bitcoin Outlook 2021
Crypto Market Report: Bitcoin Outlook 2021Crypto Market Report: Bitcoin Outlook 2021
Crypto Market Report: Bitcoin Outlook 2021
 
Why Invest in Cryptocurrencies?
Why Invest in Cryptocurrencies?Why Invest in Cryptocurrencies?
Why Invest in Cryptocurrencies?
 

More from CoinGecko

RWA Report 2024: Rise of Real-World Assets in Crypto | CoinGecko
RWA Report 2024: Rise of Real-World Assets in Crypto | CoinGeckoRWA Report 2024: Rise of Real-World Assets in Crypto | CoinGecko
RWA Report 2024: Rise of Real-World Assets in Crypto | CoinGeckoCoinGecko
 
RWA Report 2024: Rise of Real-World Assets in Crypto | CoinGecko
RWA Report 2024: Rise of Real-World Assets in Crypto | CoinGeckoRWA Report 2024: Rise of Real-World Assets in Crypto | CoinGecko
RWA Report 2024: Rise of Real-World Assets in Crypto | CoinGeckoCoinGecko
 
GameFi Report 2023: GameFi Levels Up | CoinGecko
GameFi Report 2023: GameFi Levels Up | CoinGeckoGameFi Report 2023: GameFi Levels Up | CoinGecko
GameFi Report 2023: GameFi Levels Up | CoinGeckoCoinGecko
 
Deep Diving Into ETH Liquid Staking | CoinGecko
Deep Diving Into ETH Liquid Staking | CoinGeckoDeep Diving Into ETH Liquid Staking | CoinGecko
Deep Diving Into ETH Liquid Staking | CoinGeckoCoinGecko
 
The State of Decentralized Perpetual Protocols | CoinGecko
The State of Decentralized Perpetual Protocols | CoinGeckoThe State of Decentralized Perpetual Protocols | CoinGecko
The State of Decentralized Perpetual Protocols | CoinGeckoCoinGecko
 
The Global Crypto Classification Standard by 21Shares & CoinGecko
The Global Crypto Classification Standard by 21Shares & CoinGeckoThe Global Crypto Classification Standard by 21Shares & CoinGecko
The Global Crypto Classification Standard by 21Shares & CoinGeckoCoinGecko
 
The State of Decentralized Storage
The State of Decentralized StorageThe State of Decentralized Storage
The State of Decentralized StorageCoinGecko
 
Steem 2018 Report by CoinGecko
Steem 2018 Report by CoinGeckoSteem 2018 Report by CoinGecko
Steem 2018 Report by CoinGeckoCoinGecko
 
CoinGecko 2018 Full Year Cryptocurrency Report
CoinGecko 2018 Full Year Cryptocurrency ReportCoinGecko 2018 Full Year Cryptocurrency Report
CoinGecko 2018 Full Year Cryptocurrency ReportCoinGecko
 
CoinGecko 2018 Q2 Cryptocurrency Report
CoinGecko 2018 Q2 Cryptocurrency ReportCoinGecko 2018 Q2 Cryptocurrency Report
CoinGecko 2018 Q2 Cryptocurrency ReportCoinGecko
 
CoinGecko 2018 Q1 Cryptocurrency Report
CoinGecko 2018 Q1 Cryptocurrency ReportCoinGecko 2018 Q1 Cryptocurrency Report
CoinGecko 2018 Q1 Cryptocurrency ReportCoinGecko
 
2017 Year in Review Cryptocurrency Report by CoinGecko
2017 Year in Review Cryptocurrency Report by CoinGecko2017 Year in Review Cryptocurrency Report by CoinGecko
2017 Year in Review Cryptocurrency Report by CoinGeckoCoinGecko
 
Q3 2017 Cryptocurrency Report by CoinGecko
Q3 2017 Cryptocurrency Report by CoinGeckoQ3 2017 Cryptocurrency Report by CoinGecko
Q3 2017 Cryptocurrency Report by CoinGeckoCoinGecko
 

More from CoinGecko (13)

RWA Report 2024: Rise of Real-World Assets in Crypto | CoinGecko
RWA Report 2024: Rise of Real-World Assets in Crypto | CoinGeckoRWA Report 2024: Rise of Real-World Assets in Crypto | CoinGecko
RWA Report 2024: Rise of Real-World Assets in Crypto | CoinGecko
 
RWA Report 2024: Rise of Real-World Assets in Crypto | CoinGecko
RWA Report 2024: Rise of Real-World Assets in Crypto | CoinGeckoRWA Report 2024: Rise of Real-World Assets in Crypto | CoinGecko
RWA Report 2024: Rise of Real-World Assets in Crypto | CoinGecko
 
GameFi Report 2023: GameFi Levels Up | CoinGecko
GameFi Report 2023: GameFi Levels Up | CoinGeckoGameFi Report 2023: GameFi Levels Up | CoinGecko
GameFi Report 2023: GameFi Levels Up | CoinGecko
 
Deep Diving Into ETH Liquid Staking | CoinGecko
Deep Diving Into ETH Liquid Staking | CoinGeckoDeep Diving Into ETH Liquid Staking | CoinGecko
Deep Diving Into ETH Liquid Staking | CoinGecko
 
The State of Decentralized Perpetual Protocols | CoinGecko
The State of Decentralized Perpetual Protocols | CoinGeckoThe State of Decentralized Perpetual Protocols | CoinGecko
The State of Decentralized Perpetual Protocols | CoinGecko
 
The Global Crypto Classification Standard by 21Shares & CoinGecko
The Global Crypto Classification Standard by 21Shares & CoinGeckoThe Global Crypto Classification Standard by 21Shares & CoinGecko
The Global Crypto Classification Standard by 21Shares & CoinGecko
 
The State of Decentralized Storage
The State of Decentralized StorageThe State of Decentralized Storage
The State of Decentralized Storage
 
Steem 2018 Report by CoinGecko
Steem 2018 Report by CoinGeckoSteem 2018 Report by CoinGecko
Steem 2018 Report by CoinGecko
 
CoinGecko 2018 Full Year Cryptocurrency Report
CoinGecko 2018 Full Year Cryptocurrency ReportCoinGecko 2018 Full Year Cryptocurrency Report
CoinGecko 2018 Full Year Cryptocurrency Report
 
CoinGecko 2018 Q2 Cryptocurrency Report
CoinGecko 2018 Q2 Cryptocurrency ReportCoinGecko 2018 Q2 Cryptocurrency Report
CoinGecko 2018 Q2 Cryptocurrency Report
 
CoinGecko 2018 Q1 Cryptocurrency Report
CoinGecko 2018 Q1 Cryptocurrency ReportCoinGecko 2018 Q1 Cryptocurrency Report
CoinGecko 2018 Q1 Cryptocurrency Report
 
2017 Year in Review Cryptocurrency Report by CoinGecko
2017 Year in Review Cryptocurrency Report by CoinGecko2017 Year in Review Cryptocurrency Report by CoinGecko
2017 Year in Review Cryptocurrency Report by CoinGecko
 
Q3 2017 Cryptocurrency Report by CoinGecko
Q3 2017 Cryptocurrency Report by CoinGeckoQ3 2017 Cryptocurrency Report by CoinGecko
Q3 2017 Cryptocurrency Report by CoinGecko
 

Recently uploaded

Ch 4 investment Intermediate financial Accounting
Ch 4 investment Intermediate financial AccountingCh 4 investment Intermediate financial Accounting
Ch 4 investment Intermediate financial AccountingAbdi118682
 
NO1 WorldWide Genuine vashikaran specialist Vashikaran baba near Lahore Vashi...
NO1 WorldWide Genuine vashikaran specialist Vashikaran baba near Lahore Vashi...NO1 WorldWide Genuine vashikaran specialist Vashikaran baba near Lahore Vashi...
NO1 WorldWide Genuine vashikaran specialist Vashikaran baba near Lahore Vashi...Amil baba
 
fca-bsps-decision-letter-redacted (1).pdf
fca-bsps-decision-letter-redacted (1).pdffca-bsps-decision-letter-redacted (1).pdf
fca-bsps-decision-letter-redacted (1).pdfHenry Tapper
 
Bladex 1Q24 Earning Results Presentation
Bladex 1Q24 Earning Results PresentationBladex 1Q24 Earning Results Presentation
Bladex 1Q24 Earning Results PresentationBladex
 
Classical Theory of Macroeconomics by Adam Smith
Classical Theory of Macroeconomics by Adam SmithClassical Theory of Macroeconomics by Adam Smith
Classical Theory of Macroeconomics by Adam SmithAdamYassin2
 
SBP-Market-Operations and market managment
SBP-Market-Operations and market managmentSBP-Market-Operations and market managment
SBP-Market-Operations and market managmentfactical
 
AfRESFullPaper22018EmpiricalPerformanceofRealEstateInvestmentTrustsandShareho...
AfRESFullPaper22018EmpiricalPerformanceofRealEstateInvestmentTrustsandShareho...AfRESFullPaper22018EmpiricalPerformanceofRealEstateInvestmentTrustsandShareho...
AfRESFullPaper22018EmpiricalPerformanceofRealEstateInvestmentTrustsandShareho...yordanosyohannes2
 
Stock Market Brief Deck for "this does not happen often".pdf
Stock Market Brief Deck for "this does not happen often".pdfStock Market Brief Deck for "this does not happen often".pdf
Stock Market Brief Deck for "this does not happen often".pdfMichael Silva
 
《加拿大本地办假证-寻找办理Dalhousie毕业证和达尔豪斯大学毕业证书的中介代理》
《加拿大本地办假证-寻找办理Dalhousie毕业证和达尔豪斯大学毕业证书的中介代理》《加拿大本地办假证-寻找办理Dalhousie毕业证和达尔豪斯大学毕业证书的中介代理》
《加拿大本地办假证-寻找办理Dalhousie毕业证和达尔豪斯大学毕业证书的中介代理》rnrncn29
 
(办理学位证)加拿大萨省大学毕业证成绩单原版一比一
(办理学位证)加拿大萨省大学毕业证成绩单原版一比一(办理学位证)加拿大萨省大学毕业证成绩单原版一比一
(办理学位证)加拿大萨省大学毕业证成绩单原版一比一S SDS
 
Authentic No 1 Amil Baba In Pakistan Authentic No 1 Amil Baba In Karachi No 1...
Authentic No 1 Amil Baba In Pakistan Authentic No 1 Amil Baba In Karachi No 1...Authentic No 1 Amil Baba In Pakistan Authentic No 1 Amil Baba In Karachi No 1...
Authentic No 1 Amil Baba In Pakistan Authentic No 1 Amil Baba In Karachi No 1...First NO1 World Amil baba in Faisalabad
 
Call Girls Near Me WhatsApp:+91-9833363713
Call Girls Near Me WhatsApp:+91-9833363713Call Girls Near Me WhatsApp:+91-9833363713
Call Girls Near Me WhatsApp:+91-9833363713Sonam Pathan
 
Stock Market Brief Deck for 4/24/24 .pdf
Stock Market Brief Deck for 4/24/24 .pdfStock Market Brief Deck for 4/24/24 .pdf
Stock Market Brief Deck for 4/24/24 .pdfMichael Silva
 
Stock Market Brief Deck FOR 4/17 video.pdf
Stock Market Brief Deck FOR 4/17 video.pdfStock Market Brief Deck FOR 4/17 video.pdf
Stock Market Brief Deck FOR 4/17 video.pdfMichael Silva
 
chapter_2.ppt The labour market definitions and trends
chapter_2.ppt The labour market definitions and trendschapter_2.ppt The labour market definitions and trends
chapter_2.ppt The labour market definitions and trendslemlemtesfaye192
 
(中央兰开夏大学毕业证学位证成绩单-案例)
(中央兰开夏大学毕业证学位证成绩单-案例)(中央兰开夏大学毕业证学位证成绩单-案例)
(中央兰开夏大学毕业证学位证成绩单-案例)twfkn8xj
 
Call Girls Near Golden Tulip Essential Hotel, New Delhi 9873777170
Call Girls Near Golden Tulip Essential Hotel, New Delhi 9873777170Call Girls Near Golden Tulip Essential Hotel, New Delhi 9873777170
Call Girls Near Golden Tulip Essential Hotel, New Delhi 9873777170Sonam Pathan
 
The Triple Threat | Article on Global Resession | Harsh Kumar
The Triple Threat | Article on Global Resession | Harsh KumarThe Triple Threat | Article on Global Resession | Harsh Kumar
The Triple Threat | Article on Global Resession | Harsh KumarHarsh Kumar
 
How Automation is Driving Efficiency Through the Last Mile of Reporting
How Automation is Driving Efficiency Through the Last Mile of ReportingHow Automation is Driving Efficiency Through the Last Mile of Reporting
How Automation is Driving Efficiency Through the Last Mile of ReportingAggregage
 

Recently uploaded (20)

Ch 4 investment Intermediate financial Accounting
Ch 4 investment Intermediate financial AccountingCh 4 investment Intermediate financial Accounting
Ch 4 investment Intermediate financial Accounting
 
NO1 WorldWide Genuine vashikaran specialist Vashikaran baba near Lahore Vashi...
NO1 WorldWide Genuine vashikaran specialist Vashikaran baba near Lahore Vashi...NO1 WorldWide Genuine vashikaran specialist Vashikaran baba near Lahore Vashi...
NO1 WorldWide Genuine vashikaran specialist Vashikaran baba near Lahore Vashi...
 
fca-bsps-decision-letter-redacted (1).pdf
fca-bsps-decision-letter-redacted (1).pdffca-bsps-decision-letter-redacted (1).pdf
fca-bsps-decision-letter-redacted (1).pdf
 
Bladex 1Q24 Earning Results Presentation
Bladex 1Q24 Earning Results PresentationBladex 1Q24 Earning Results Presentation
Bladex 1Q24 Earning Results Presentation
 
Classical Theory of Macroeconomics by Adam Smith
Classical Theory of Macroeconomics by Adam SmithClassical Theory of Macroeconomics by Adam Smith
Classical Theory of Macroeconomics by Adam Smith
 
SBP-Market-Operations and market managment
SBP-Market-Operations and market managmentSBP-Market-Operations and market managment
SBP-Market-Operations and market managment
 
AfRESFullPaper22018EmpiricalPerformanceofRealEstateInvestmentTrustsandShareho...
AfRESFullPaper22018EmpiricalPerformanceofRealEstateInvestmentTrustsandShareho...AfRESFullPaper22018EmpiricalPerformanceofRealEstateInvestmentTrustsandShareho...
AfRESFullPaper22018EmpiricalPerformanceofRealEstateInvestmentTrustsandShareho...
 
Stock Market Brief Deck for "this does not happen often".pdf
Stock Market Brief Deck for "this does not happen often".pdfStock Market Brief Deck for "this does not happen often".pdf
Stock Market Brief Deck for "this does not happen often".pdf
 
《加拿大本地办假证-寻找办理Dalhousie毕业证和达尔豪斯大学毕业证书的中介代理》
《加拿大本地办假证-寻找办理Dalhousie毕业证和达尔豪斯大学毕业证书的中介代理》《加拿大本地办假证-寻找办理Dalhousie毕业证和达尔豪斯大学毕业证书的中介代理》
《加拿大本地办假证-寻找办理Dalhousie毕业证和达尔豪斯大学毕业证书的中介代理》
 
(办理学位证)加拿大萨省大学毕业证成绩单原版一比一
(办理学位证)加拿大萨省大学毕业证成绩单原版一比一(办理学位证)加拿大萨省大学毕业证成绩单原版一比一
(办理学位证)加拿大萨省大学毕业证成绩单原版一比一
 
Authentic No 1 Amil Baba In Pakistan Authentic No 1 Amil Baba In Karachi No 1...
Authentic No 1 Amil Baba In Pakistan Authentic No 1 Amil Baba In Karachi No 1...Authentic No 1 Amil Baba In Pakistan Authentic No 1 Amil Baba In Karachi No 1...
Authentic No 1 Amil Baba In Pakistan Authentic No 1 Amil Baba In Karachi No 1...
 
Call Girls Near Me WhatsApp:+91-9833363713
Call Girls Near Me WhatsApp:+91-9833363713Call Girls Near Me WhatsApp:+91-9833363713
Call Girls Near Me WhatsApp:+91-9833363713
 
🔝+919953056974 🔝young Delhi Escort service Pusa Road
🔝+919953056974 🔝young Delhi Escort service Pusa Road🔝+919953056974 🔝young Delhi Escort service Pusa Road
🔝+919953056974 🔝young Delhi Escort service Pusa Road
 
Stock Market Brief Deck for 4/24/24 .pdf
Stock Market Brief Deck for 4/24/24 .pdfStock Market Brief Deck for 4/24/24 .pdf
Stock Market Brief Deck for 4/24/24 .pdf
 
Stock Market Brief Deck FOR 4/17 video.pdf
Stock Market Brief Deck FOR 4/17 video.pdfStock Market Brief Deck FOR 4/17 video.pdf
Stock Market Brief Deck FOR 4/17 video.pdf
 
chapter_2.ppt The labour market definitions and trends
chapter_2.ppt The labour market definitions and trendschapter_2.ppt The labour market definitions and trends
chapter_2.ppt The labour market definitions and trends
 
(中央兰开夏大学毕业证学位证成绩单-案例)
(中央兰开夏大学毕业证学位证成绩单-案例)(中央兰开夏大学毕业证学位证成绩单-案例)
(中央兰开夏大学毕业证学位证成绩单-案例)
 
Call Girls Near Golden Tulip Essential Hotel, New Delhi 9873777170
Call Girls Near Golden Tulip Essential Hotel, New Delhi 9873777170Call Girls Near Golden Tulip Essential Hotel, New Delhi 9873777170
Call Girls Near Golden Tulip Essential Hotel, New Delhi 9873777170
 
The Triple Threat | Article on Global Resession | Harsh Kumar
The Triple Threat | Article on Global Resession | Harsh KumarThe Triple Threat | Article on Global Resession | Harsh Kumar
The Triple Threat | Article on Global Resession | Harsh Kumar
 
How Automation is Driving Efficiency Through the Last Mile of Reporting
How Automation is Driving Efficiency Through the Last Mile of ReportingHow Automation is Driving Efficiency Through the Last Mile of Reporting
How Automation is Driving Efficiency Through the Last Mile of Reporting
 

2023 Q2 Crypto Industry Report | CoinGecko

  • 1. CoinGecko 2023 Q2 Crypto Industry Report
  • 2. CoinGecko 2023 Q2 Crypto Industry Report DeFi Analysis - 2023 Q2 DeFi Overview - 2023 Q2 DeFi Multichain Market Share - 2023 Q2 DeFi Ecosystem Overview - 2023 Q2 Cross-chain Bridge Liquidity - LSDFi 23 1 Table of Contents Analysts: Market Landscape - 2023 Q2 Overall Crypto Market Overview - 2023 Q2 Crypto Dominance - 2023 Q2 Cryptocurrency Price Returns - 2023 Q2 Top 15 Stablecoins Overview - 2023 Q2 Total Crypto Market Cap & Bitcoin vs. S&P 500 - 2023 Q2 Notable Events Timeline - The SEC’s Lawsuits against Binance and Coinbase 3 Founders’ Note 2 Non-Fungible Tokens (NFTs) - 2023 Q2 NFT Trading Volume across Top 8 Chains - 2023 Q2 NFT Platform Trading Volumes - 2023 Q2 Notable NFT Collections - NFT Lending 30 Bitcoin Analysis - 2023 Q2 Bitcoin Price vs. Trading Volume - 2023 Q2 Bitcoin Mining Hash Rate - 2023 Q2 Bitcoin vs. Major Asset Classes Price Returns - Spot Bitcoin ETF Applications in the US 11 Win Win Exchanges - 2023 Q2 Total Crypto Exchange Volumes - 2023 Q2 Top 10 Spot Centralized Exchanges (CEX) Trading Volume - 2023 Q2 Top 10 Spot Decentralized Exchanges (DEX) Trading Volume - 2023 Q2 Spot DEX Trading Volume Breakdown by Chain - 2023 Q2 Top 10 Centralized Perpetual Exchanges Trading Volume - 2023 Q2 Top 10 Centralized Perpetual Exchanges Open Interest - 2023 Q2 Decentralized Perpetual Protocols Trading Volume - 2023 Q2 Decentralized Perpetual Protocols Open Interest 36 Shaun Lee Ethereum Analysis - 2023 Q2 Ethereum Price vs. Trading Volume - 2023 Q2 Ethereum Consensus Layer Staking - 2023 Q2 Ethereum Burn Rate - 2023 Q2 Maximal Extractable Value (MEV) - May 2023 Memecoin Season 16 Zhong Weng Dee Nicholas Boey
  • 3. CoinGecko 2023 Q2 Crypto Industry Report 2 Founders’ Note Bobby Ong COO TM Lee CEO After the exuberance of Q1, it was reasonable to expect that the crypto market would take some time to consolidate some of its gains. April and May were relatively quiet months, particularly after Ethereum’s Shapella upgrade on April 12 as the market was absent of any strong overarching narrative. At this point the familiar adage of “sell in May and go away” seemed like it was going to ring true. Ethereum’s successful Shapella upgrade, and subsequent lack of withdrawals after it was activated, quickly turbocharged liquid staking derivatives as more people jumped in to stake their ETH. At the end of Q2, more than 17% of the total ETH supply had been staked. While concerns over security and concentration risks remain, staked ETH has now clearly emerged as a core DeFi primitive for people to build off for years to come. There is never a dull moment in crypto, and this quarter’s drama was promptly served up by the US SEC in June. Continuing its streak of enforcement actions in 2023, the regulator filed lawsuits against Binance and Coinbase, two of the largest global centralized exchanges for amongst other things, operating illegal securities exchanges. As both exchanges gear up to challenge the SEC in court, the future of crypto regulations in the US is also at stake. In making its case, the SEC named a slew of altcoins as it seeks to enforce its jurisdiction. If the courts agree with the SEC’s definition, there will be significant ramifications for the industry and how projects can operate in the US. Despite the SEC’s enforcement actions being long rumored, the news still sent shockwaves throughout the market, with prices and liquidity both falling rapidly. At one point it looked like the total crypto market cap would fall below $1 trillion as BTC dipped under $25,000, and altcoins named in the lawsuit also took significant hits. Just as the market looked set for capitulation, the mood took a drastic turn as news broke that BlackRock, the world’s largest asset manager had filed an application with the SEC to offer a spot bitcoin ETF. The SEC has over the years resisted approving a spot bitcoin ETF, but BlackRock jumping into the fray has reignited hopes. Other asset managers such as WisdomTree, Invesco and Fidelity have quickly followed suit and filed similar applications. It is uncertain whether the SEC is more amenable to these latest applications from traditional incumbents, but the news swiftly sent Bitcoin back above $30,000. This resulted in the total crypto market cap closing out Q2 2023 at $1.24 trillion, essentially back where it started the quarter, and still almost 50% up year-to-date. While the regulatory landscape for crypto within the US remains fraught, significant progress is being made in other parts of the world. Europe passed its MiCA regulations this May, Hong Kong rolled out its regulations for exchanges in June, and the UK recently passed a bill to bring crypto under financial regulations. The allure of the US market will always be there, but at this point in time, crypto projects should probably look elsewhere for more welcoming hosts. As we’re writing this, a new cycle of FUD has just struck NFTs, particularly so called “bluechip” collections like Azuki, Apes and Moonbirds, which experienced significant dips following recent controversies. A lot has been said about mismatched expectations between founders vs holders, but NFT projects need to evolve beyond just being simple JPEGs, and it looks like there’s going to be a lot of growing pains. We await to see how many of these projects will prove themselves to be true blue chips once the dust settles. The crypto industry certainly has its share of dramatic moments which can sometimes overshadow the real progress being made by builders! We've yet to mention the introduction of the new zkEVM Layer 2s, Uniswap's V4 announcement, or more real world assets making their way onto public blockchains. On the CoinGecko end, we’ve progressively rolled out our NFT floor price tracker on both web and mobile, expanded our API endpoints for users, and continuously improved our on-chain DEX tracker, GeckoTerminal. Do check out these exciting updates and we welcome your feedback — meanwhile, enjoy our Q2 report and the summer!
  • 4. CoinGecko 2023 Q2 Crypto Industry Report MARKET LANDSCAPE 3
  • 5. CoinGecko 2023 Q2 Crypto Industry Report $0B $50B $100B $150B $200B $250B $300B $0.0T $0.2T $0.4T $0.6T $0.8T $1.0T $1.2T $1.4T $1.6T Jan-23 Feb-23 Mar-23 Apr-23 May-23 Jun-23 Jul-23 Total Volume Traded Total Market Cap Trendline (Total MarketCap) $1.06T $1.34T 4 2023 Q2 Overall Crypto Market Overview Total crypto market cap experienced some volatility in 2023 Q2 but ended where it began the quarter at $1.2T Market Cap Total Market Cap & Spot Trading Volume (Jan – Jun 2023) Trading Volume Total market cap ended Q2 2023 where it began at $1.2T, with only a +$1.7B change in absolute terms. Average daily trading volume however decreased 42.7% QoQ and sits at $44.2B. A large portion of volume had fallen off in late March after Binance removed their zero-fee trading incentives for BTC. In Q2, volumes continued to gradually decline. +0.14% Total Market Cap Change in 2022 Q2 Within the Top 30, some notable movers include LTC which broke into the Top 10, climbing from #13 to surpass MATIC at #9. BCH also climbed from #27 to #18. Both tokens rallied following their listing on EDX Markets. BUSD continues to slide from #12 to #18. TUSD (#23) and ICP (#30) entered the Top 30, while FIL and HBAR fell out. $1.24T $1.24T Source: CoinGecko
  • 6. CoinGecko 2023 Q2 Crypto Industry Report 0% 10% 20% 30% 40% 50% 60% 70% 80% 90% 100% Jan-23 Feb-23 Mar-23 Apr-23 May-23 Jun-23 BTC ETH USDT BNB USDC XRP ADA Others 5 2023 Q2 Crypto Dominance Bitcoin dominance continues to climb as investors rotated out of altcoins into ‘majors’, despite a shortlived memecoin season in May Bitcoin continues its climb with a 3.2% increase in dominance to 47.9%, levels it has not reached since 2021 Q2. ETH also climbed slightly by 1.0% in 2023 Q2. USDT, USDC, XRP and ADA held on to their share of market, while BNB recorded a slight decline of 1.0%. Source: CoinGecko 18.8% 1.0% 6.7% 0.3% 3.0% 1.0% 2.2% 0.4% 0.8% 0.3% 2.0% 0.3% 18.6% 2.4% 47.9% 3.2% ‘Others’ recorded the largest fall of -2.4% in dominance, indicating a rotation of capital from lower cap altcoins into ‘majors’ like Bitcoin and Ethereum. Crypto Dominance (Jan – Jun 2023)
  • 7. CoinGecko 2023 Q2 Crypto Industry Report 6 2023 Q2 Cryptocurrency Price Returns With the exception of some CEX tokens, altcoins bled against BTC and ETH After a rather strong recovery in 2023 Q1, the play-to-earn sector has been hit the hardest, where the Top 5 P2E tokens fell by 30-40%. WEMIX which entered the Top 5 in 2023 Q1 has fallen out again, with GALA taking its place. Within the Top 5 cryptos, BTC (+7%) and ETH (+6%) continued their Q1 climb and still ended 2023 Q2 in the green, while BNB (-24%), XRP (-12%) and ADA (-28%) saw double digit losses, returning some of their gains from last quarter. ADA and BNB saw the largest losses, after both were listed as securities in the SEC’s lawsuits against Binance and Coinbase. Top exchange tokens took less damage compared to other sectors, with BNB (-24%) taking the largest loss likely as a result of Binance being sued by the SEC. LEO (+13%) and OKB (+6%) saw some gains, while WhiteBit exchange token WBT took KCS’s place at #5 following its listing on Bitfinex and the launch of its own blockchain testnet. With the exception of AAVE (-5%), DeFi tokens UNI (-13%), LINK (-17%), LDO (- 16%), and GRT (-28%) have all dipped by double digits, fading some of their 2023 Q1 recovery. Their declines started around mid-February which coincided with BTC pullback. Source: CoinGecko
  • 8. CoinGecko 2023 Q2 Crypto Industry Report $0B $20B $40B $60B $80B $100B $120B $140B $160B Jan-23 Feb-23 Mar-23 Apr-23 May-23 Jun-23 USDT USDC DAI BUSD TUSD Others (6-15) $126.3B Market Cap 7 2023 Q2 Top 15 Stablecoins Overview USDT continues its dominant run and now has 66% of market share, however overall stablecoin market saw net outflows $83.3B +$3.48B (+4.4%) $27.4B -$5.18B (-15.9%) $4.3B -$0.76B (-14.9%) $4.1B -$3.43b (-45.4%) $3.1B +$1.02B (+50.0%) Top 15 Stablecoins Market Cap Breakdown (Jan – Jun 2023) Source: CoinGecko Top 15 Stablecoins shed ~3.5% or $4.6B in market cap in 2023 Q2 and now sits at $126.3B. USDT gained the most in absolute terms during Q2, while BUSD continued its slide after Paxos announced its wind-down with $3.4B removed from circulation (-45%). DAI saw losses in Q2 but still took BUSD’s place as the third largest stablecoin. -3.5% Top 15 Stablecoins Market Cap Change in 2023 Q2 Outside the Top 5, GUSD (+44.4%), flexUSD (+33.4%) and USDP (+30.0%) were the biggest gainers while USTC was the biggest loser (-43.2%). TUSD spiked 50% in market cap after Binance minted ~$1B worth on the Tron network and implemented zero-fee trading on TUSD pairs. However, near the end of Q2 there was FUD due to one of its custodians, Prime Trust, as well as its auditor. $130.8B USDT: 61% USDC: 25% DAI: 4% BUSD: 6% TUSD: 2% Others: 3% USDT: 66% USDC: 22% DAI: 3% BUSD: 3% TUSD: 2% Others: 3%
  • 9. CoinGecko 2023 Q2 Crypto Industry Report Market Cap 8 2023 Q2 Total Crypto Market Cap & Bitcoin vs. S&P 500 The S&P 500 continues to climb while total crypto market cap stays flat, resulting in correlation turning moderately negative S&P 500 Correlation between total crypto market cap and bitcoin in Q2 2023 was lower than usual at 0.84, as a result of bitcoin holding its value better than the overall crypto market. Bitcoin-S&P500 correlation flipped from low positive in 2023 Q1 (0.31) to slightly negative in Q2 (-0.09). The S&P went on a run improving from ~4,000 to ~4,400 points in Q2 on the back of strong performance from mega-cap and AI- related stocks, while crypto remained flat. Meanwhile, correlation between total crypto market cap and the S&P 500 was moderately negative at -0.54. Total crypto market cap ended flat in Q2 2023 but was ~3x more volatile than the S&P 500 which climbed by 7.9%. Meanwhile, similar to the S&P 500, bitcoin market cap climbed by 7.3% but had a Q2 annualized volatility of 40.6%, 3.3x higher than the S&P 500’s Q2 annualized volatility of 12.3%. Total Crypto Market Cap & Bitcoin vs. S&P 500 (Jan – Jun 2023) Source: CoinGecko, MarketWatch 3,000 3,200 3,400 3,600 3,800 4,000 4,200 4,400 4,600 4,800 5,000 $0.0T $0.2T $0.4T $0.6T $0.8T $1.0T $1.2T $1.4T Jan-23 Feb-23 Mar-23 Apr-23 May-23 Jun-23 Total Crypto Market Cap Bitcoin Market Cap S&P 500
  • 10. CoinGecko 2023 Q2 Crypto Industry Report 9 2023 Q2 Notable Events Timeline Q2 saw the SEC suing Coinbase and Binance, followed by BlackRock filing for BTC ETF, and also several other notable highlights – ETH Shapella Upgrade & May Memecoin Season 3 Apr 4 Apr 12 Apr 1 May 2 May 3 May 31 May 24 May 23 May 15 May 5 May 2 Jun 3 Jun 5-6 Jun 13 Jun 20 Jun 15 Jun 18 Jun Coinbase Derivatives launched Institutional BTC and ETH futures Atomic Wallet exploited for $35M SEC sued Binance & Coinbase Uniswap v4 announced EDX markets backed by Fidelity, Schwab and Citadel launched BlackRock files for spot BTC ETF; ‘The Goose’ NFT sold for $11M on Sotheby’s ZachXBT received over $1M in donations following defamation lawsuit Multichain CEO went missing Lido Finance (LDO) enabled withdrawals for stETH PEPE hits $1B market cap Fintoch rugpulled for $32M Reuters reported Binance co-mingled user funds in 2020 and 2021 Sui launched on Mainnet Blur’s lending market, BLEND launched Balaji paid out $1.5M BTC bet Pancakeswap v3 launched; Twitter logo replaced by Doge Opensea launched Opensea Pro; Euler hacker returned funds Ethereum Shanghai (Shapella) Upgrade
  • 11. CoinGecko 2023 Q2 Crypto Industry Report 10 The SEC’s Lawsuits against Binance and Coinbase Tokens Named by SEC as Securities SOL ADA MATIC FIL SAND MANA ALGO AXS ATOM BUSD BNB COTI CHZ NEAR FLOW ICP VGX DASH NEXO Tokens named in Binance Lawsuit Tokens named in Coinbase Lawsuit As part of its lawsuits, the SEC had named a list of tokens as securities in order to establish its jurisdiction. However the impact of the lists can already be felt as the tokens named by the SEC all saw their prices tumble after the list was published, and US-based platform Robinhood had already removed SOL, MATIC and ADA from trading. March 23, 2023 Coinbase receives Wells Notice from the SEC over their staking offering and asset listings. June 5, 2023 The SEC files lawsuit against Binance, Binance.US, and founder CZ. The suit alleges that the parties: § Operated as an unregistered Exchange, Broker and Clearing Agency through Binance.com and Binance.US § Offered and sold unregistered securities through BNB, BUSD, and its BNB Vault and Simple Earn offerings § Made false and misleading statements to investors about controls they claimed to have implemented on Binance.US, specifically claims that Binance.US operated independently of Binance.com, as well as surveillance & controls put in place to prevent manipulative trading. June 6, 2023 The SEC files lawsuit against Coinbase. The suit alleges that Coinbase: § Operated as an unregistered Exchange, Broker and Clearing Agency § Operated as an unregistered Broker through its Coinbase Prime and Coinbase Wallet offerings § Offered and sold unregistered securities through its Staking Program June 9, 2023 Binance.US announces that it is freezing all USD deposits and withdrawals, stopping all USD trading, and will transition to become a crypto-only exchange. June 6, 2023 The SEC seeks court order to freeze assets of Binance.US. June 17, 2023 The court denies the SEC’s earlier request filed on June 6 to freeze Binance.US’ assets. In a court-ordered agreement, Binance.US’ customers’ assets will be repatriated back to the US and USD withdrawals will be re-enabled. June 29, 2023 Coinbase files its answer and notice of intent to file a motion to dismiss the SEC’s lawsuit. vs vs Following this, many projects immediately published denials that their token constituted securities. However absent clear regulatory guidance, this matter will likely have to be settled in court. Source: US SEC; various news outlets
  • 12. CoinGecko 2023 Q2 Crypto Industry Report BITCOIN ANALYSIS 11
  • 13. CoinGecko 2023 Q2 Crypto Industry Report $0B $10B $20B $30B $40B $50B $60B $70B $80B $90B $100B $0 $5,000 $10,000 $15,000 $20,000 $25,000 $30,000 $35,000 Jan-23 Feb-23 Mar-23 Apr-23 May-23 Jun-23 Volume Price $30,481 Q2 low $25,107 Yearly high $30,694 12 2023 Q2 Bitcoin Price vs. Trading Volume BTC saw some volatility in 2023 Q2 but ends the quarter with a 6.9% gain, outperforming the overall crypto market BTC Price Trading Vol Bitcoin Price and Spot Trading Volume Apr ‘21 - Oct '21 Bitcoin Price and Spot Trading Volume (Jan – Jun 2023) $28,517 In 2023 Q2, BTC outperformed the overall crypto market cap with a +6.9% return. After a strong rally in Q1 up until mid-April, BTC retraced almost ~18% to $25,107. It then rebounded to reach a new 2023 high at $30,694 following the announcement of BlackRock’s spot bitcoin ETF filing. While prices continue trending up, average daily trading volume for 2023 Q2 sits at $13.8B, a 58.7% decline QoQ. +6.9% Bitcoin price return in 2023 Q2 Notable developments for Bitcoin this quarter include the continued rise of Ordinals with the introduction of BRC-20 tokens, as well as a slew of spot bitcoin ETF filings following Blackrock’s surprise filing (see slide 15). Source: CoinGecko
  • 14. CoinGecko 2023 Q2 Crypto Industry Report 100m 150m 200m 250m 300m 350m 400m 450m 500m Jan-23 Feb-23 Mar-23 Apr-23 May-23 Jun-23 13 2023 Q2 Bitcoin Mining Hash Rate Bitcoin’s total hashrate and mining difficulty continues to trend upwards in 2023 Q2, hitting all- time highs; meanwhile surge in transaction fees from Ordinals delivers boon for miners Hash Rate TH/s Bitcoin's Total Hash Rate (Jan – Jun 2023) All-time High 441m TH/s 326m TH/s Mining hash rate continues to climb, increasing by 22% QoQ and hitting another ATH of 441m TH/s on 1 May. Mining difficulty exceeded the 50 trillion mark for the first time ever on June 13. +22.0% Bitcoin’s hash rate increase in 2023 Q2 The mining industry continues to develop: • Miners continue to expand - Riot purchased 33,280 ASIC miners; CleanSpark continued its Q1 buying spree with another 57,000 miners in Q2. • The proposed “anti-mining” US bill which calls for a 10% tax on electricity used by miners has fell through in May, while favorable bitcoin mining bills have passed in Texas and Arkansas. • Jack Dorsey’s open-source, 5nm bitcoin mining chip prototype completed. Source: Blockchain.com 398m TH/s For only the fifth time in history, average fee paid per block surpassed the block subsidy for a few hours on May 8 due to Ordinals boon
  • 15. CoinGecko 2023 Q2 Crypto Industry Report 14 After a stellar 2023 Q1, Bitcoin still outperforms most major asset classes in Q2, only lagging behind the NASDAQ and S&P500 Bitcoin vs. Major Asset Classes (Apr – Jun 2023) Courtesy of the rally on mega-cap tech stocks, the NASDAQ (+14%) and S&P 500 (+8%) were the top two performers of 2023 Q2. BTC (+7%) came in third place. 2023 Q2 Bitcoin vs. Major Asset Classes Price Returns Price Return Crude oil (-12%) saw the largest decline due to a combination of factors, including fears of a US recession, China’s declining economic growth, as well as higher- than-expected oil supply from Russia. Concerns surrounding China’s economy also contributed to CNY’s (-5%) fall. JPY (-8%) saw the second-largest loss, as the Bank of Japan is expected to keep interest rates low despite the opposite action taken by other central banks. Source: MarketWatch -20.0% -15.0% -10.0% -5.0% 0.0% 5.0% 10.0% 15.0% Apr-23 May-23 Jun-23 BTC Crude Oil Gold TLT DXY NASDAQ CNY JPY
  • 16. CoinGecko 2023 Q2 Crypto Industry Report Issuer Spot Bitcoin ETF Name Application Date ARK 21Shares Bitcoin ETF April 25 iShares Bitcoin Trust June 15 Bitwise Bitcoin ETP Trust June 16 Invesco Galaxy Bitcoin ETF June 20 WisdomTree Bitcoin Trust June 20 Valkryie Bitcoin Fund June 21 VanEck Bitcoin ETF June 22 Wise Origin Bitcoin Trust June 29 15 Spot Bitcoin ETF Applications in the US BlackRock’s surprise application set off a race between traditional asset managers to jump in to the fray, and sent the market into a bullish mood BlackRock’s application marks a particular change of stance by BlackRock CEO Larry Fink, who in 2017 called Bitcoin “an index of money laundering”. Before its ETF application, BlackRock had announced a partnership with Coinbase in August 2022 to help clients manage and trade their bitcoin. In April 2022 it also announced an investment in Circle. The SEC had approved futures-based bitcoin ETFs in the past, notably $BITO which was launched in October 2021. However it had thus far resisted approving a spot bitcoin ETF, having received ~30 prior applications. The main reason cited by the regulator related to concerns surrounding the lack of regulations and risk of market manipulation in the underlying spot markets. The announcements caused the discount on Grayscale’s GBTC to narrow above -30%, the first time since May 2022, on hopes that GBTC will be converted to an ETF. To address the SEC’s initial feedback, all eight applicants have named Coinbase as the market surveillance provider for the Bitcoin spot markets. BlackRock’s surprise filing for a spot bitcoin ETF on June 15 set off a race to file similar applications, with a total of 8 asset managers having submitted thus far. Source: Bloomberg, US SEC Spot Bitcoin ETF Applications Filed in 2023
  • 17. CoinGecko 2023 Q2 Crypto Industry Report ETHEREUM ANALYSIS 16
  • 18. CoinGecko 2023 Q2 Crypto Industry Report 17 2023 Q2 Ethereum Price vs. Trading Volume Price of ETH gained by 6% in 2023 Q2, slightly less than Bitcoin but still outperforming the overall crypto market Source: CoinGecko Ethereum Price and Spot Trading Volume (Jan – Jun 2023) ETH Price Trading Vol. 2023 Q1 Price Return +49.8% 2023 Q2 Price Return +6.0% ETH closed 2023 Q2 at $1,934, representing a 6.0% increase during the quarter. It started the quarter at $1,792 before hitting a yearly high of $2,118 in mid-April. This coincided with the Shapella upgrade on April 12. Despite fears that early stakers would withdraw and sell their staked ETH, the price of ETH rose above $2,000 for the first time in 2023, before dipping back below those levels. It had been a busy quarter for Ethereum’s zero-knowledge projects: • zkSync unveiled plans for Hyperchains, a series of custom blockchains. • Starknet is preparing to launch a testnet zkEVM in the form of Kakarot in its path to becoming EVM-compatible. • Polygon proposed to upgrade its PoS network to a zkEVM validium Yearly High $2,118 $1,934 +6.0% ETH Price Return in 2023 Q2 $0B $20B $40B $60B $80B $100B $120B $0 $200 $400 $600 $800 $1,000 $1,200 $1,400 $1,600 $1,800 $2,000 $2,200 Jan-23 Feb-23 Mar-23 Apr-23 May-23 Jun-23 Jul-23 Volume Price $1,792
  • 19. CoinGecko 2023 Q2 Crypto Industry Report 18 2023 Q2 Ethereum Consensus Layer Staking ETH staking sees strong growth (+30.3%) in 2023 Q2 after withdrawals were enabled; Lido is still leading the way while Kraken loses market share Kraken had a 36.2% drop in staked ETH as it winds down its staking product in the US following a settlement with the SEC. Total staked ETH hit 23.6 mil by the end of 2023 Q2, a gain of 5.6 mil QoQ. Total staked ETH climbed at a faster rate compared to 2023 Q1, where 2.2 mil were staked. This is a clear signal that holders now have more confidence in staking ETH after withdrawals were enabled post-Shapella. Lido remained the dominant staking provider, with 31.9% of all staked ETH, a slight increase from 31.4% in Q1. Source: Glassnode Total Staked ETH in Validators (Jan – Jun 2023) 9.6% 5.2% 3.4% 2.8% 1.2% 1.9% 34.2% 31.9% Staked ETH 2023 Q2 Total Staked ETH +30.3% 2023 Q1 Total Staked ETH +13.6% 0M 2M 4M 6M 8M 10M 12M 14M 16M 18M 20M 22M 24M Jan-23 Feb-23 Mar-23 Apr-23 May-23 Jun-23 Jul-23 Lido Coinbase Kraken Binance Staked.us Bitcoinsuisse Stakefish Figment Rocket Pool Huobi Abyss Finance Stakewise Frax Others 18,006,199 23,596,678
  • 20. CoinGecko 2023 Q2 Crypto Industry Report 19 2023 Q2 Ethereum Burn Rate ETH experienced its second net-burn quarter, largely thanks to the mid-May memecoin season; The Ethereum network experienced a net burn of 203k ETH in 2023 Q2 ETH Top 6 Burn Leaderboard Q2 2023 Q2 saw over 381k ETH burned, while 179k were emitted. This resulted in 203k ETH being taken out of circulation this quarter, another ATH in terms of net burn. Most of the ETH burned this quarter occurred in May. The largest one-day burn occurred on 5 May, where 14.6k ETH was burned at the peak of memecoin season. Notably, during the week of 5 – 11 May, 81,553 ETH was burned, representing 21.4% of all ETH burned in Q2. Uniswap remained the dominant ETH burner in Q2, burning 97.5k ETH. Meanwhile, NFT exchanges Blur and OpenSea were edged out by XEN and MetaMask. This coincides with the slump in NFT trading volumes. 4 XEN Projects 10.0k ETH 2 ETH Transfers 23.7k ETH 3 USDT 15.6k ETH 1 Uniswap 97.5k ETH 5 Arbitrum 9.9k ETH 6 MetaMask 8.9k ETH Source: Dune Analytics 0 2,000 4,000 6,000 8,000 10,000 12,000 14,000 Jan-23 Feb-23 Mar-23 Apr-23 May-23 Jun-23 Emissions Burned Peak of memecoin season 381K ETH Burned in 2023 Q2 ETH Burn vs. Emission Rate (Jan – Jun 2023)
  • 21. CoinGecko 2023 Q2 Crypto Industry Report $1M $2M $7M $5M $9M $3M $2M $3M $11M $2M $3M $2M $2M $0M $5M $10M $15M $20M Jan-23 Feb-23 Mar-23 Apr-23 May-23 Jun-23 Sandwich Profits Arbitrage Profits Liquidation Profits 20 2023 Q2 Maximal Extractable Value (MEV) Even though MEV transaction volumes have fallen by 87%, MEV bots still increased their profits by 11% in 2023 Q2, with the majority going to sandwich attackers Volume Profits Source: EigenPhi As transaction volumes on DEXs have fallen off significantly in 2023 Q2, MEV bots also were noticeably less active, as MEV transaction volumes shrank by 87.0% from $44B in March to $6B in June 2023. Although sandwich attacks are still the most active form of MEV, quarterly volumes have plunged by 69.4% from $59B to $18B. Yet, sandwich attackers have increased their profits in 2023 Q2 by 80.1%, In other words, sandwich bots are making more on average with each “attack”. Be that as it may, MEV searchers are still raking in the cash, increasing their earnings by 11.0% from $24.5M to $27.2M this quarter. MEV bots achieved their most profitable month of Q2 in May during the height of the recent memecoin season. $10B $14B $36B $7B $7B $4B $8B $0B $10B $20B $30B $40B $50B Jan-23 Feb-23 Mar-23 Apr-23 May-23 Jun-23 Sandwich Attack Arbitrage Liquidation $27.2M Profits Generated by MEV Transactions in 2023 Q2 MEV Monthly Transaction Volume and Profits (Jan – Jun 2023)
  • 22. CoinGecko 2023 Q2 Crypto Industry Report 1589x 183x 142x 96x 59x 24x 1x 51x 101x 151x 201x 251x 1x 2x 4x 8x 16x 32x 64x 128x 256x 512x 1024x 2048x 0 2 4 6 8 10 12 14 16 18 20 22 24 26 28 30 32 34 36 38 40 42 44 46 48 50 PEPE AIDOGE LADYS BOB WOJAK BITCOIN 21 21 21 May 2023 Memecoin Season May 2023 Memecoin Season gave rise to PEPE and a new batch of memecoins, including BRC-20 tokens on Bitcoin AIDOGE claimed second spot in terms of returns, with returns of up to 235x** at its peak. AIDOGE distinguished itself by launching on Arbitrum, and tokens were distributed to those eligible for ARB airdrop. The Introduction of BRC-20 tokens through Bitcoin Ordinals brought memecoins to the Bitcoin network, driving a surge in trading volume in May 2023. $ORDI emerging as the most popular one, reaching a peak market cap of $600 million. Source: GeckoTerminal *Comparison of Returns is based on the coins' performance after they first reached a market capitalization of $1M. The price of the token at that point is used as a benchmark for calculating returns. Day 0 represents the day the market cap of the token first hits $1M. **Peak return is calculated based on the intraday high price. Price returns on chart are calculated based on the daily closing price and will not match the peak price. Memecoin Season arrived in 2023 Q2, capturing the attention of traders. PEPE emerged as the frontrunner, offering early investors returns of ~1813x** at its peak. Its “appeal” stem from the use of Pepe the Frog as its imagery. At peak, PEPE achieved a market cap of $1.8 billion following its Binance listing announcement. However, the price dipped after its actual listing. Returns (PEPE) Days Returns (Others) 1813x Peak returns from PEPE** May 2023 Memecoin Season Price Returns
  • 23. CoinGecko 2023 Q2 Crypto Industry Report 22 Track DEXes and real-time cryptocurrency prices. GeckoTerminal Now tracking: • 100 Blockchain Networks • 600+ DEXes • 1.7 million+ Pools • 1.5 million+ Tokens Discover the next big opportunity in the decentralized exchange (DEX) and DeFi space with GeckoTerminal. 📈 What’s new: • Explore the hottest crypto trends via the Trending Pools Page. • Compare DEXes across all networks using DEX Rankings. • Builder? Explore the market data via GeckoTerminal API. Chart the hottest tokens now! Stay updated with GeckoTerminal: from
  • 24. CoinGecko 2023 Q2 Crypto Industry Report DEFI ANALYSIS 23
  • 25. CoinGecko 2023 Q2 Crypto Industry Report 3.7% 3.8% 3.9% 4.0% 4.1% 4.2% 4.3% 4.4% 4.5% 4.6% 4.7% $30B $35B $40B $45B $50B $55B $60B Jan-23 Feb-23 Mar-23 Apr-23 May-23 Jun-23 Total DeFi Market Cap DeFi Share of Market (DeFi/Global Market Cap) 24 2023 Q2 DeFi Overview While the DeFi sector saw a temporary spike in market cap following Ethereum’s Shapella upgrade, it has only been downhill since before seeing a slight rebound at the end of June Market Cap % of Market Source: CoinGecko 2023 Q1 $51B Total DeFi Market Cap and DeFi Share of Overall Market (Jan – Jun 2023) TradFi banking turmoil 2023 Q2 $48B Even though the DeFi market cap fell slightly by 5.2% from $51B in 2023 Q1 to $48B in 2023 Q2, it still underperformed the overall crypto market, shrinking its market share. The success of the Shapella upgrade in April brought DeFi’s market cap to a quarterly high of $56B, yet DeFi’s dominance only saw a minor increase from 4.0% to 4.2%. -5.2% DeFi Market Cap Decrease in 2023 Q2 After the SEC charged Binance and Coinbase in June, DeFi’s market cap saw an impressive recovery, bouncing 16.4% from $42B on 15 June to on $48B by the end of June. Unfortunately, the rest of the crypto markets also moved higher, causing DeFi’s dominance to fall further below to 3.9%. Ethereum Shapella upgrade SEC charges Binance & Coinbase
  • 26. CoinGecko 2023 Q2 Crypto Industry Report 25 2023 Q2 DeFi Multichain Market Share Ethereum continues to strengthen its dominance and now controls nearly 70% of multichain TVL, while Tron breaks ahead of the pack to #2 as BSC falls off $54B $62B $62B $67B $65B Source: DefiLlama *Monthly TVL is calculated by taking the average TVL daily for each month. Market Share $63B Total TVL Multi-chain Total Value Locked (TVL) Breakdown (Jan – Jun 2023) Despite fears of massive withdrawals of staked ETH after the Shapella upgrade, it did not come to pass and instead Ethereum has continued to increase its dominance, increasing its TVL share from 67% to 69% in 2023 Q2, attracting an additional $1.6B. While 2022 saw Tron going neck-and-neck with BNB Smart Chain (BSC) for the second spot, the former has pulled further ahead in TVL due to net outflows from BSC. While Tron increased its TVL by 6.8% from $5.4B to $5.7B in 2023 Q2, TVL on BSC fell by 30.9%, from $5.0B to $3.5B in the same period. +1.9% Multi-chain DeFi TVL Increase in 2023 Q2 In the past quarter, TVL on zero-knowledge rollups such as zkSync Era and Polygon zkEVM have risen exponentially. As the next potential targets for airdrop hunters, TVL on zkSync Era has grown from $27M on March 31 to $180M at the end of June. 65% 65% 67% 68% 68% 69% 9% 8% 8% 8% 8% 9% 8% 8% 7% 7% 7% 6% 10% 9% 8% 7% 7% 6% 0% 10% 20% 30% 40% 50% 60% 70% 80% 90% 100% Jan-23 Feb-23 Mar-23 Apr-23 May-23 Jun-23 Ethereum Tron Others BSC Arbitrum Polygon Optimism Avalanche Solana Mixin Cronos Kava
  • 27. CoinGecko 2023 Q2 Crypto Industry Report 26 2023 Q2 DeFi Ecosystem Overview While overall DeFi tokens market cap declined by $5.2B (-17.6%), liquid staking governance tokens and lending tokens increased their market share relative to other DeFi segments Asset Management $0.12B Fixed Interest $0.13B After a +65.2% increase in 2023 Q1, the overall DeFi market cap fell by 17.6%, dropping $5.2B from $29.6B to $24.4B in 2023 Q2. Asset management protocols declined the most in percentage terms, plunging 34.5% from $181M to $118M. The Ethereum Shapella upgrade enabled withdrawals for staked Ether but turbocharged liquid staking protocols, cementing their position in the current DeFi landscape. Even though liquid staking protocols lost 17.4% of their market cap from $4.2B to $3.7B, the segment has increased its market share compared to 2023 Q1. Fixed interest protocols were the only gainer of 2023 Q2, rising by 19.6% from $110M to $131M, largely driven by the popularity of Pendle. The success of Pendle also contributed to the creation of the LSDFi segment in DeFi (see slide 27). Market Cap of Each DeFi Category* (2023 Q2) *Market cap includes only governance and utility tokens (excluding stablecoins and wrapped tokens Source: CoinGecko
  • 28. CoinGecko 2023 Q2 Crypto Industry Report 27 LSDFi The attention surrounding liquid staking derivatives have allowed protocols to build on top of this new core primitive, resulting in a new DeFi segment known as ‘LSDFi’ Fixed Yield § Fixed interest protocols such as Pendle and Flashstake separate the staking yield from liquid staking tokens, allowing users to hedge their yield at current rates. § Pendle allows users to purchase ETH at a discount and receive a fixed amount of ETH upon a chosen maturity date. § Flashstake lets users lock in their ETH or LSDs for a chosen duration to receive yield tokens from a selection of various assets. Flashstake Collateralized Stablecoins § Similar to MakerDAO’s Maker Vaults, protocols such as Lybra, Gravita and Raft allow users to deposit their LSDs as collateral to borrow/mint the protocol’s native stablecoin. § These protocols typically maintain a collateralization ratio above 150%, along with other stablecoin mechanisms such as stability pools and redemptions. § Lybra distributes the generated yield from the underlying LSDs to stablecoin holders, creating a yield-bearing stablecoin. Lybra Raft Gravita Restaking § EigenLayer introduced the concept of restaking, where users could reuse their LSDs to provide security to other dApps on the network and earn additional rewards in the process. § Tenet expands on this concept, utilizing LSDs as collateral for securing its own Layer-1 network. Holders can stake their existing LSDs with the network’s validators, as well as earn fees and rewards from the network’s ecosystem of protocols. LSD Indices § LSD indices offer a diversified basket of staked assets, allowing holders to gain exposure to varying yield rates from different LSD protocols, through a single token. § The index tokens can be minted using ETH or the underlying LSDs. On Asymmetry Finance, the deposited ETH will be separated across supported LSD protocols. § These diversified asset baskets can also function as liquidity pools, where users can swap between different LSDs. Tenet EigenLayer unshETH LSDx Asymmetry Finance Pendle
  • 29. CoinGecko 2023 Q2 Crypto Industry Report Bridges 2023 Q2 2023 Q1 QoQ % Change WBTC $4.8B $4.3B 12.9% JustCryptos $3.6B $3.3B 8.1% Multichain $1.3B $1.5B 10.4% Stargate $402M $369M 9.0% Portal $371M $281M 31.2% hBTC $272M $253M 7.5% Poly Network $272M $338M 19.4% Synapse $179M $188M 5.1% Orbit Bridge $125M $187M 33.1% Celer cBridge $110M $142M 22.6% Thorchain $93M $118M 21.0% Axelar $87M $89M 2.8% 28 2023 Q2 Cross-chain Bridge Liquidity The launch of new networks and rumors of potential airdrops drove TVL on bridges higher by 4.4% The top 3 cross-chain bridges have remained largely unchanged in 2023 Q2, with WBTC experiencing net inflows, in line with the 6.9% price appreciation of Bitcoin. However, most of these inflows only came after June 15th, just after the SEC sued Binance and Coinbase. On the other hand, Multichain lost 10.4% of its TVL, dropping from $1.5B to $1.3B. The protocol has yet to fully recover after temporarily halting cross-chain activities in June due to ‘unforeseen circumstances,’ Wormhole’s Portal token bridge was the top gainer of 2023 Q2, its liquidity surging by 31.2%, from $281M to $371M. The rise of Portal’s TVL was largely contributed by the launch of the Sui mainnet in May, where it has become the official bridge. Stargate also saw a TVL increase of 9% from $369M to $402M, perhaps due to rumors of an impending airdrop of LayerZero’s governance token, ZRO. Historically, providing liquidity for cross-chain protocols has been a criteria in determining airdrop eligibility. Top 12 Bridges with Highest Liquidity (as of July 1, 2023) Source: DeFiLlama Total Cross-chain Bridge Liquidity as of July 1, 2023 $11.61B (+4.4%) Making its way into the top 12, Axelar fell slightly by 2.8% from $89M to $87M. Compared to other cross-chain protocols, Axelar provides more bridging avenues for the Cosmos ecosystem, supporting networks such as Juno, Kava and Kujira.
  • 30. CoinGecko 2023 Q2 Crypto Industry Report 29 Bitget Ad Slide
  • 31. CoinGecko 2023 Q2 Crypto Industry Report 30 NON-FUNGIBLE TOKENS (NFTs)
  • 32. CoinGecko 2023 Q2 Crypto Industry Report $0.9B $1.9B $1.5B $1.1B $0.7B $0.8B $0.1B $0.2B $0.1B $0.1B $0.1B $0.0B $0.5B $1.0B $1.5B $2.0B $2.5B Jan-23 Feb-23 Mar-23 Apr-23 May-23 Jun-23 Ethereum Bitcoin ImmutableX Polygon Solana Flow Arbitrum BNB Chain 31 2023 Q2 NFT Trading Volume across Top 8 Chains NFT Trading Volume decreased by 35.0% in Q2 compared to Q1, despite Bitcoin Ordinals quickly gaining popularity; meanwhile Solana NFT trading volumes decrease significantly $4.84B Source: FootPrint Analytics; Cryptoslam *Wash trades on LooksRare , X2Y2 and Blur are excluded **Cardano has been excluded due to irregular trading behavior Volume $3.15B Top 8 Chains for NFT Trading Volume (Jan – Jun 2023) -35.0% Trading Volume Decrease in 2023 Q2 $1.07B $2.08B $1.69B $0.97B $1.00B $1.18B NFT trading volumes have decreased by 35.0% from $4.84B in 2023 Q1 to $3.15B in 2023 Q2. While Ethereum maintained its dominance of 83.0% in the NFT market in Q2, its dominance did temporarily decline to 73.3% in May 2023, as Bitcoin Ordinals gained popularity and captured nearly 20.3% of the NFT trading volume. In contrast, trading volume for Solana NFTs experienced a significant decline of 78.6%, dropping from $184.91 million in Q1 to $39.66 million in Q2. Part of the decline can be attributable to the migration of DeGods and y00ts, which were significant contributors to Solana sales volume. After its migration, y00ts has become one of the top 10 traded NFT collections on Polygon on all-time sales volume.
  • 33. CoinGecko 2023 Q2 Crypto Industry Report $0.4B $1.1B $1.1B $0.7B $0.5B $0.7B $0.4B $0.7B $0.3B $0.3B $0.2B $0.2B $0.1B $0.1B $0.1B $0.0B $0.5B $1.0B $1.5B $2.0B $2.5B Jan-23 Feb-23 Mar-23 Apr-23 May-23 Jun-23 Blur Opensea Magic Eden X2Y2 Unisat OKX Cryptopunks Ordinals Wallet LooksRare $0.92B $1.04B $1.10B $0.87B $2.02B $1.53B 71.2% 18.8% 4.6% 32 2023 Q2 NFT Platform Trading Volumes Blur maintains its position as the dominant NFT marketplace, controlling 71.2% of trading volume in June 2023 In Q2, Blur maintained its position as the leading NFT marketplace, bolstered by the introduction of Blend, a lending platform for NFTs, as well as the promise of BLUR token rewards. Their share of trading volume increased from 56% in 2023 Q1 to 65% in 2023 Q2. Meanwhile, Opensea's share continued to decline, falling from 33% in 2023 Q1 to 23% in 2023 Q2. -37.0% NFT Marketplace Trading Volume Decrease in 2023 Q2 The emergence of Bitcoin Ordinals also led to new NFT marketplaces which support these NFTs, including UniSat, OKX and Ordinals Wallet. On the back of this hype Unisat and OKX have now become the fifth and sixth largest marketplace in June, pulling ahead of more established players CryptoPunks and LooksRare. Magic Eden, which previously focused on Solana, also added support for Ordinals in a bid to recapture market share. Source: FootPrint Analytics, Dune (@domo) *OpenSea volumes include Ethereum, Polygon and Solana; Magic Eden volumes include Solana, Ethereum and Bitcoin ***Wash trades on Blur, LooksRare and X2Y2 are excluded $4.59B $2.89B Top 9 NFT Marketplaces (Jan – Jun 2023) Volume
  • 34. CoinGecko 2023 Q2 Crypto Industry Report 33 2023 Q2 Notable NFT Collections It was an eventful Q2 for the NFT space: NFT Prices Experience Roller Coaster Ride, PFP Sentiment Hits All-Time Low as bluechips seem to implode against holder expectations Its All Fun and Games at Memeland § Memeland has garnered significant attention in the NFT ecosystem as it one of the rare NFT projects that is backed by a profitable web2 company, 9GAG. The platform boasts three notable collections, namely "You The Real MVP," "The Potatoz," and "The Captainz." § During Q2 2023, Memeland marked several milestones. They successfully launched their first GM show, introduced both season 0 and season 1 of their raids, and revealed their Captainz collection. § However, floor price of Captainz dumped post-reveal due to having similarities in the NFT’s base models, which allows customization of traits based on the NFT holder’s preference. Azuki Fumbles § Azuki has established itself as a prominent NFT collection, with its community demonstrating resilience and overcoming challenges in the past year. § The announcement of their "Follow the Rabbit" event in Las Vegas generated substantial interest in the space. During this event, Azuki unveiled a new collection, Azuki Elementals. The collection garnered immense attention and demand, resulting in a quick sell- out within less than 10 minutes at 2 ETH. § Despite the successful sale, Azuki faced backlash as the revealed art for the Azuki Elementals collection disappointed the community. Floor prices dropped below the initial mint price of 2 ETH due to perceived similarities with the original collection. Milady Maker Making Its Way Up § Milady Maker gained significant attention in the NFT space as it experienced a remarkable surge in value, rising from 1.1 ETH in April to a peak of 5.5 ETH in May, before dipping back to 3.0 ETH at the end of Q2. § The surge in price was further fueled by the announcement from Blur's Blend platform that Milady Maker would be one of the three featured NFT collections, alongside Azuki and Cryptopunks, supported by the platform upon its launch on May 1. § The momentum for Milady Maker continued to grow when Elon Musk tweeted a picture of a Milady NFT with the caption “There Is No Meme, I Love You”. Yuga Labs Under Fire § Yuga Labs have been getting the heat, as the floor prices of their NFT collections experienced a downward trend in Q2 2023. The exact reasons behind this decline are uncertain, and it remains unclear whether it can be attributed to Blur points farmers creating artificial buyers who subsequently dumped the floor, or if the ApeCoin DAO’s extensive treasury burning occurred without bringing significant results. § Despite floor price trending downwards, Yuga Labs have continued to roll out parts of its gaming ecosystem in Q2, including the introduction of Otherside: Legends of Mara and HV-MTL forge. § Additionally, they have upgraded Meebits, transforming them from static profile pictures (PFP) into dynamic ones.
  • 35. CoinGecko 2023 Q2 Crypto Industry Report 34 NFT Lending The launch of Blend pushed NFT lending volumes higher by 453%, but some high-profile collections crumbled under the massive demand for loans Although NFT lending platforms were already recording millions in monthly volume in the early part of 2023, the launch of Blur Lending (Blend) , took the space by storm, increasing NFT lending volumes by 453% from $74M to $411M in May 2023. Blend featured innovative mechanisms such as fixed interest rates and perpetual loans, but its success can also be attributed to Blur’s incentive model, which allows lenders to earn Blur points to receive future BLUR token drops. Azukis and Bored Apes made up 57.9% of all loans on Blend thus far, equating to $655M in borrowed funds. Ironically despite their “blue chip” status, the ETH floor prices for Azukis and Bored Apes have plunged by 36.6% and 41.9% respectively in 2023 Q2, resulting in 317 liquidations across both collections. $346M $786M $26M $23M $25M $24M $27M $21M $38M $40M $29M $0M $100M $200M $300M $400M $500M $600M $700M $800M $900M Jan-23 Feb-23 Mar-23 Apr-23 May-23 Jun-23 Blend NFTFi Arcade BendDAO X2Y2 Pine Source: Dune Analytics (@ahkek, @beetle) Top 6 NFT Lending Platform Volume (Jan – Jun 2023) Volume $84M $87M $84M $74M $411M $826M 29.4% 28.5% 12.7% 9.7% 7.8% Azuki BAYC MAYC Wrapped CryptoPunks DeGods Milady Pudgy Penguins BEANZ Official Others Loan Origination Volume on Blend (by Collection) $1.1B
  • 36. CoinGecko 2023 Q2 Crypto Industry Report Track ‘em all with the new CoinGecko mobile app 100+ Crypto Categories Trending Coins Hottest NFTs Download Now
  • 37. CoinGecko 2023 Q2 Crypto Industry Report 36 EXCHANGES
  • 38. CoinGecko 2023 Q2 Crypto Industry Report 37 2023 Q2 Top Crypto Exchanges Trading Volume Trading volume fell by 19.5% from 2023 Q1; majority of losses coming from spot markets, with CEXes particularly badly hit -19.5% Top Crypto Exchanges Trading Volume Decrease in 2023 Q2 Trading Volume Source: CoinGecko Total Trading Volume ($ Trillion) $3.1T $2.6T $2.8T $3.1T $3.2T $4.2T The ratio of CEX : DEX spot trading volume dropped to 89.1% in Q2. This is the first time since 2022 Q2 in which CEX:DEX ratio has dropped below 90%. CEX:DEX derivatives trading volume ratio stayed at 97.9%, with traders still preferring to trade on CEX’s. Top crypto exchanges closed out 2023 Q2 with an -19.5% decrease in total trading volume from 2023 Q1 to 2023 Q2. Total trading volume stands at $8.5T for the entire quarter. Spot DEXes declined less than spot CEXes, and perpetual markets held up better than spot markets. Derivatives trading volume still made up the bulk of total trading volume with a 77.3% share. Top Cryptocurrency Exchanges Trading Volume (Jan - Jun 2023) $2.24T $2.29T $3.15T $2.43T $2.07T $2.28T $0.74T $0.84T $0.92T $0.56T $0.40T $0.46T $0.00T $0.50T $1.00T $1.50T $2.00T $2.50T $3.00T $3.50T $4.00T $4.50T Jan-23 Feb-23 Mar-23 Apr-23 May-23 Jun-23 Top 10Perpetual CEX Top 6Perpetual DEX Top 10Spot CEX Top 10Spot DEX
  • 39. CoinGecko 2023 Q2 Crypto Industry Report 63% 65% 61% 53% 54% 52% 9% 9% 7% 10% 6% 8% 5% 5% 6% 6% 7% 7% 7% 5% 5% 6% 6% 6% 3% 3% 4% 5% 5% 3% 5% 3% 5% 5% 5% 5% 5% 6% 6% 4% 5% 5% 5% 4% 0% 10% 20% 30% 40% 50% 60% 70% 80% 90% 100% Jan-23 Feb-23 Mar-23 Apr-23 May-23 Jun-23 Binance Upbit OKX Coinbase Bybit Kucoin Bitget MEXC Gate Kraken 38 2023 Q2 Top 10 Spot Centralized Exchanges (CEX) Trading Volume Binance continued as the dominant spot CEX with 52.0% market share in June 2023, but is progressively losing market share to its competitors Total Trading Volume ($ Trillion) -43.2% Top 10 CEX Total Trading Volume Decrease in 2023 Q2 Source: CoinGecko Top 10 Spot CEX Trading Volume Breakdown (Jan – Jun 2023) Market Share Top-10 CEXes recorded $1.42T in spot trading volume in 2023 Q2. Despite showing signs of recovery in Q1, trading volume has since plummeted 43.2% QoQ. With pressure mounting from regulators, Binance has seen its dominance slide. However, it managed to maintain a 52% market share in June, down from 61% in March. Huobi and Crypto.com have been edged out of the top 10, with Bybit and Bitget taking their places. Both exchanges saw an increase in Q2 trading volume of $13.1B and $1.5B respectively, the only exchanges in the top 10 to see gains. $0.6T $0.4T $0.5T $0.7T $0.8T $0.9T
  • 40. CoinGecko 2023 Q2 Crypto Industry Report 62% 65% 72% 64% 70% 65% 14% 8% 9% 10% 6% 11% 5% 7% 5% 11% 13% 9% 5% 6% 4% 5% 4% 7% 7% 4% 3% 3% 2% 2% 3% 0% 10% 20% 30% 40% 50% 60% 70% 80% 90% 100% Jan-23 Feb-23 Mar-23 Apr-23 May-23 Jun-23 Uniswap Curve Pancakeswap Dodo Balancer Quickswap Jupiter THORChain Sushi TraderJoe 39 2023 Q2 Top 10 Spot Decentralized Exchanges (DEX) Trading Volume DEX trading volumes decreased by -28.1% in 2023 Q2, as Uniswap solidified its dominance over the sector Curve saw volumes plummet in May despite the release of its crvUSD stablecoin. The stableswap ended June with 11% of market share. Meanwhile, Trader Joe which managed to break into the top 10 in 2023 Q1, has seen a drop in volume. The exchange ended Q2 with just 0.3% of market share. Top 10 DEXs recorded a total of $155 billion in spot trading volume in 2023 Q2, representing a 30.8% drop QoQ. -30.8% Top 10 DEXs Total Trading Volume Decrease in 2023 Q2 Despite memecoin season in full swing (majority launched on DEXs), volumes on DEXs didn’t experience a noticeable uptick. However, their volumes saw less decline compared to spot CEXes. Source: CoinGecko Top 10 Spot DEX Trading Volume Breakdown (Jan – Jun 2023) Total Trading Volume ($ Billion) Market Share $57B $47B $46B $60B $61B $95B
  • 41. CoinGecko 2023 Q2 Crypto Industry Report 79% 71% 71% 47% 63% 63% 4% 8% 13% 24% 15% 17% 6% 7% 5% 11% 13% 10% 6% 8% 6% 5% 5% 6% 11% 0% 10% 20% 30% 40% 50% 60% 70% 80% 90% 100% Jan-23 Feb-23 Mar-23 Apr-23 May-23 Jun-23 Ethereum Arbitrum BSC Polygon Solana Optimism THORChain Avalanche Fantom 40 2023 Q2 Spot DEX Trading Volume Breakdown by Chain Ethereum remained the most popular chain for DEX trading with 57% market share, though its dominance have been waning Ethereum captured $87.8 billion of DEX trading volume in 2023 Q2, representing 57% amongst all chains. This is a drop of -44.7% from 2023 Q1, where Ethereum had $158.8 billion in trading volume and 74% market share . In terms of market share, Arbitrum has pulled ahead to be the clear #2 in terms of DEX trading volume ahead of BSC, thanks to Uniswap and Trader Joe. Source: CoinGecko Spot DEX Trading Volume Breakdown by Chain (Jan – Jun 2023) Market Share Having lost ground in Q1, BSC bounced back in Q2 to capture 10% market share in June and keep its #3 position. However, it may continue to struggle as the FUD piles up against Binance. Polygon consistently has the fourth highest trading volume with ~6.0% market share. As of June the Top 4 Chains control >95% of volume. Total Trading Volume ($ Billion) $57B $47B $46B $60B $61B $95B
  • 42. CoinGecko 2023 Q2 Crypto Industry Report 56% 57% 56% 54% 53% 53% 14% 15% 16% 17% 17% 18% 12% 12% 12% 13% 12% 12% 10% 9% 8% 9% 10% 9% 0% 10% 20% 30% 40% 50% 60% 70% 80% 90% 100% Jan-23 Feb-23 Mar-23 Apr-23 May-23 Jun-23 Binance OKX Bybit Bitget KuCoin Gate Huobi BitMEX Deribit Crypto.com 41 2023 Q2 Top 10 Centralized Perpetual Exchanges Trading Volume While the top 10 centralized perpetual exchanges experienced a slight decline in trading volume in 2023 Q2, the relative market share of the exchanges remained largely the same Between 2023 Q1 to Q2, volume across top 10 centralized perpetual exchanges declined slightly by 11.6% from $7.7T to $6.8T. However, this is still 4.5x larger than the Top 10 centralized spot exchanges. Relative share of trading volume between centralized perpetual exchanges remained largely the same across the Top 10, with Binance, OKX, Bybit and Bitget holding the Top 4 spots. The Top 4 exchanges together control >90% of the trading volume. Binance remains the top centralized perpetual exchange with >50% of the trading volume alone. Source: CoinGecko -11.6% Top 10 Centralized Perpetual Exchanges Trading Volume Decrease in 2023 Q2 Top 10 Centralized Perpetual Exchanges Trading Volume (Jan – Jun 2023) Total Trading Volume ($ Trillion) $2.4T $2.1T $2.3T $2.2T $2.3T $3.2T Market Share
  • 43. CoinGecko 2023 Q2 Crypto Industry Report $0B $5B $10B $15B $20B $25B $30B Jan-23 Feb-23 Mar-23 Apr-23 May-23 Jun-23 Binance Bybit Bitget OKX Gate KuCoin Deribit BitMEX Huobi Crypto.com 42 2023 Q2 Top 10 Centralized Perpetual Exchanges Open Interest Besides a short-lived spike in mid-April, OI across Top 10 centralized perpetual exchanges only saw a modest increase in Q2 Other than a short-lived spike in mid- April during Ethereum’s Shapella upgrade, OI across Top 10 centralized perpetual exchanges only showed a modest increase from $23.2B to $24.4B (+5.1%) in 2023 Q2. Source: CoinGecko +5.1% Top 10 Centralized Perpetual Exchanges OI Increase from 1 Apr 2023 to 30 Jun 2023 Centralized perpetual exchanges still dwarf decentralized perpetual protocols in terms of OI, with ~40x larger in size. Top 10 Centralized Perpetual Exchanges Open Interest (Jan – Jun 2023) Binance: 35% Bybit: 19% Bitget: 13% OKX; 12% Gate: 7% KuCoin: 7% Deribit: 4% BitMEX: 1% Huobi: 1% Crypto.com: 1% Open Interest Share of OI between exchanges also largely stayed the same, with Binance still leading with ~35% of OI, followed by Bybit at ~19%. Despite the Top 4 contributing only ~80% of OI, they managed to capture >90% of volume. The next two exchanges KuCoin and Gate contribute ~7% of OI each but only captured ~2-3% of volume.
  • 44. CoinGecko 2023 Q2 Crypto Industry Report 77% 69% 66% 59% 57% 72% 13% 15% 15% 17% 12% 9% 14% 8% 8% 9% 7% 7% 8% 7% 5% 6% 10% 7% 0% 10% 20% 30% 40% 50% 60% 70% 80% 90% 100% Jan-23 Feb-23 Mar-23 Apr-23 May-23 Jun-23 dYdX GMX Kwenta Gains Network Level Finance Perpetual Protocol 43 2023 Q2 Decentralized Perpetual Protocols Trading Volume While trading volume on decentralized perpetuals fell by $20.4B (-12.7%), dYdX regains its market share, while newer protocols continue to challenge GMX In 2023 Q2, the top 6 decentralized perpetual protocols recorded $139.7B in trading volume, a $20.4B decrease from $160B in 2023 Q1. Compared to CEXes, decentralized perpetuals represent just 2.1% of the $6.8 trillion in trading volume on CEX perpetuals. As volumes on decentralized perpetuals rebounded towards the later part of 2023 Q2, dYdX regained some of its market share from 66% in March to 72% in June. While GMX was the top contender against dYdX, its position is now threatened by newer entrants such as Kwenta and Gains Network. While GMX is still slightly ahead with a 9% share of the market, Kwenta and Gains Network are catching up as they expand across to other altchains / rollups. Top 6 Decentralized Perpetual Protocols Trading Volume (Jan – Jun 2023) Total Trading Volume ($ Billion) $52B $36B $51B $47B $48B $65B Market Share Source: Dune Analytics, GMX Analytics, Token Terminal -12.7% Top 6 Decentralized Perpetual Protocols Trading Volume Decrease in 2023 Q2
  • 45. CoinGecko 2023 Q2 Crypto Industry Report $0M $100M $200M $300M $400M $500M $600M $700M $800M $900M Jan-23 Feb-23 Mar-23 Apr-23 May-23 Jun-23 Jul-23 dYdX GMX Kwenta Gains Network Perpetual Protocol Level Finance 44 2023 Q2 Decentralized Perpetual Protocols Open Interest Open Interest on decentralized perpetual exchanges saw a minor 3.2% decrease in 2023 Q2, while dYdX continues to increase its dominance Total open interest across the top 6 decentralized perpetual protocols fell slightly from $629M to $609M, a sign that on-chain traders are still maintaining their positions despite BTC and ETH’s tumultuous price action in the past quarter. dYdX still controls the majority of open interest between these protocols, increasing its market share from 43% to 52% in 2023 Q2, with $317M of open interest currently on its platform. Together, the top 3 decentralized perpetual platforms – dYdX, GMX, and Kwenta – currently dominate 90% of total open interest among the 6 protocols. Top 6 Decentralized Perpetual Protocols Open Interest (Jan 2023 – Jun 2023) Open Interest Source: CoinGecko, Dune Analytics, GMX Analytics, Level Finance Analytics dYdX: 52% GMX: 22% Kwenta: 16% Gains: 9% Perpetual: 1.4% Level: 0.2% -3.2% Top 6 Decentralized Perpetual Protocols OI Decrease from 1 Apr 2023 to 30 Jun 2023
  • 46. CoinGecko 2023 Q2 Crypto Industry Report The Most Comprehensive Cryptocurrency Data API for Traders and Developers CoinGecko’s enterprise-grade API is built upon the same infrastructure that powers our industry-leading platform - CoinGecko.com. Our REST APIs provide you access to historical and real-time data from our extensive and ever-expanding list of exchanges and crypto assets. Trusted by hundreds of the world’s leading cryptocurrency exchanges and products, our API enables your project with reliable and accurate data. API for Business 750+ Exchanges 10,000+ Coins 3,000+ NFTs 50 Endpoints 10B+ Calls per Month 10 Years Historical Data and many more endpoint improvements shipped… SIGN UP FREE ONE MONTH for you! Analyst API Subscription for Geckos * Promotion valid till 30 September 2023. Promo code only applicable for new subscription and entitles the subscriber to a $129 discount for Analyst API Monthly or Yearly subscription. SIGN UP Subscribe now with this promo code: WELCOME2023
  • 47. CoinGecko 2023 Q2 Crypto Industry Report FOLLOW US 46
  • 48. CoinGecko 2023 Q2 Crypto Industry Report THAT’S ALL! THANK YOU FOR READING :) 47