
Recommended
Recommended
More Related Content
Similar to Demand and Supply Explained
Similar to Demand and Supply Explained (17)
Recently uploaded
Recently uploaded (20)
Demand and Supply Explained
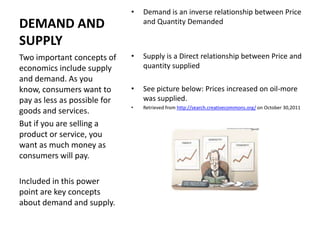
- 1. • Demand is an inverse relationship between Price DEMAND AND and Quantity Demanded SUPPLY Two important concepts of • Supply is a Direct relationship between Price and economics include supply quantity supplied and demand. As you know, consumers want to • See picture below: Prices increased on oil-more pay as less as possible for was supplied. • Retrieved from http://search.creativecommons.org/ on October 30,2011 goods and services. But if you are selling a product or service, you want as much money as consumers will pay. Included in this power point are key concepts about demand and supply.
- 2. The Demand Schedule The Demand Curve P 6 5 Price (per bushel) P Qd 4 $5 10 4 20 3 3 35 2 2 55 1 D 1 80 0 10 20 30 40 50 60 70 80 Q Quantity Demanded (bushels per week) LO1 3-5
- 3. The Supply Schedule The Supply Curve P 5 S Supply of Corn Price Qs 4 Price (per bushel) per per Bushel Week 3 $5 60 4 50 2 3 35 2 20 1 1 5 0 Q 10 20 30 40 50 60 70 Quantity supplied (bushels per week) LO2 3-14
- 4. Market Equilibrium Market Equilibrium 6 6,000 Bushel S 5 Surplus P Qd P Qs Price (per bushel) $5 2,000 4 $5 12,000 4 4,000 4 10,000 3 3 7,000 3 7,000 2 11,000 2 2 4,000 1 16,000 7,000 Bushel 1 1,000 1 Shortage D 0 2 4 6 7 8 10 12 14 16 18 Bushels of Corn (thousands per week) LO3 3-20
- 5. Determinants of Demand Determinants of Demand Table 3.1 Determinants of Demand: Factors That Shift the Demand Curve Determinant Examples Change in buyers’ tastes Physical fitness rises in popularity, increasing the demand for jogging shoes and bicycles; cell phone popularity rises, reducing the demand for land-line phones. Change in the number of buyers A decline in the birthrate reduces the demand for children’s toys. Change in income A rise in incomes increases the demand for normal goods such as restaurant meals, sports tickets, and necklaces while reducing the demand for inferior goods such as cabbage, turnips, and inexpensive wine. Change in the prices of related A reduction in airfares reduces the demand for bus goods transportation (substitute goods); a decline in the price of DVD players increases the demand for DVD movies (complementary goods). Change in consumer expectations Inclement weather in South America creates an expectation of higher future coffee bean prices, thereby increasing today’s demand for coffee beans. LO1 3-11
- 6. Determinants of Supply Determinants of Supply Table 3.2 Determinants of Supply: Factors That Shift the Supply Curve Determinant Examples Change in resource prices A decrease in the price of microchips increases the supply of computers; an increase in the price of crude oil reduces the supply of gasoline. Change in technology The development of more effective wireless technology increases the supply of cell phones. Change in taxes and subsidies An increase in the excise tax on cigarettes reduces the supply of cigarettes; a decline in subsidies to state universities reduces the supply of higher education. Change in prices of other goods An increase in the price of cucumbers decreases the supply of watermelons. Change in producer expectations An expectation of a substantial rise in future log prices decreases the supply of logs today. Change in the number of suppliers An increase in the number of tattoo parlors increases the supply of tattoos; the formation of women’s professional basketball leagues increases the supply of women’s professional basketball games. LO2 3-18