
Recommended
More Related Content
What's hot
What's hot (20)
Viewers also liked
Viewers also liked (9)
Similar to What are the elements of a control chart 2
Similar to What are the elements of a control chart 2 (20)
Recently uploaded
Recently uploaded (20)
What are the elements of a control chart 2
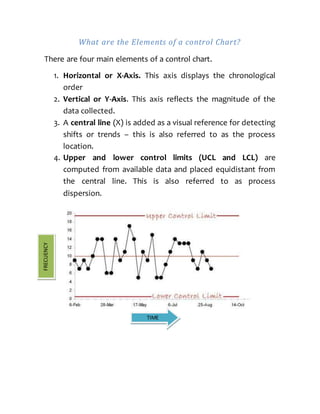
- 1. What are the Elements of a control Chart? There are four main elements of a control chart. 1. Horizontal or X-Axis. This axis displays the chronological order 2. Vertical or Y-Axis. This axis reflects the magnitude of the data collected. 3. A central line (X) is added as a visual reference for detecting shifts or trends – this is also referred to as the process location. 4. Upper and lower control limits (UCL and LCL) are computed from available data and placed equidistant from the central line. This is also referred to as process dispersion. TIME FRECUENCY
- 2. If all process values are plotted within the upper and lower control limits and no particular tendency is noted, the process is referred to as "In Control." If the process values are plotted outside the control limits or show a particular tendency, however, the process is referred to as "Out Of Control".