Pick of the week : SBIN
•
0 likes•39 views

Pick of the week : SBIN To view detail click on the given link(Buy @191 upto 186 SL 177 TGT 230 : http://bit.ly/1PihkGh

Recommended
More Related Content
What's hot
What's hot (15)
Similar to Pick of the week : SBIN
Similar to Pick of the week : SBIN (20)
Recently uploaded
Recently uploaded (20)
Pick of the week : SBIN
- 1. STATE BANK OF INDIA. State Bank of India is an Indian multinational, public sector banking and financial services company. It is a government-owned corporation with its headquarters in Mumbai, Maharashtra. As of 2014-15, it has assets of INR 20,48,080 crores and 16,333 branches, including 191 foreign offices spread across 36 countries, making it the largest banking and financial services company in India by assets. Under the Pradhan Mantri Jan Dhan Yojana of financial inclusion launched by Government in August 2014, SBI held 11,300 camps and opened over 30 lakhs accounts by September, which included 21.16 lakh accounts in rural areas and 8.8 lakh accounts in urban areas. It has branches of the parent in Singapore, Moscow, Colombo, Dhaka, Frankfurt, Hong Kong, Tehran, Johannesburg, London, Los Angeles, Male in the Maldives, Muscat, Dubai, New York, Osaka, Sydney, and Tokyo. It has offshore banking units in the Bahamas and Bahrain, and representative offices in Myanmar, Bhutan and Cape Town. SBI has 7 retail banking branches in Singapore. The Canadian subsidiary, State Bank of India (Canada) also dates to 1982. It has seven branches, four in the Toronto area and three in the Vancouver area. SBI is one of the largest employers in the country having 222,033 employees as on 31 March 2014, out of which there were 45,132 female employees (20%) and 2,610 (1%) employees with disabilities. Staff productivity: As per its Annual Report for FY 2013-14, each employee contributed net profit of INR 4.85 lakhs. Technical Outlook • After a deep correction, price has retraced from previous bottoms, connecting the lows (marked in arrow) stock has formed Triple Bottom Pattern which is very bullish reversal formation. Furthermore we have seen consistent rise in volume at third bottom, it enhance strength of the pattern. • Looking at intricacies of recent price action (marked in circle) stock had formed Pennant on daily chart which is known as continuation pattern which indicates that stock has digested its earlier strong move and now again likely to resume it’s northward journey. As a first sign of its upward move, stock has closed above its previous reversal point which is a bullish development. • Moreover, stock has been trading above its 50 day moving average which is placed at 183.10 level, which shows that near to medium term trend is up and stock could propel its upside movement from the present level. • Getting the sense from momentum oscillator RSI, it is rising from oversold zone. After facing mild hurdle at 60 level, it has taken support of its average line and again started its upward journey. • Gathering all evidences from chart, we can presume that further momentum can be seen upto 230 level in few trading session. Company SBIN Recommendation Buy Sector : Bank-Public Buying Range : 191 & Upto 186 Price Potential : 230 Stop Loss (Closing Basis): 177 Mkt Cap (Rs. Cr.): 1,48,308 TTM EPS (Rs.) 16.01 TTM Sales (Rs. Cr.) 1,60,955 BVPS (Rs.) 188.79 Reserves (Rs. Cr.) 1,45,781 P/BV 1.01 PE 11.93 Bloomberg Code : SBIN:IN Reuters Code : SBI.NS TW = Twelve Months TTM= Trailing 12 months (Consolidated) SEBI Registered – Research Analyst Equities I Commodities I Currencies I Mutual Funds Pick of the Week: STATE BANK OF INDIA. 19th March, 2016 www.choiceindia.com *Please Refer Disclaimer on Website
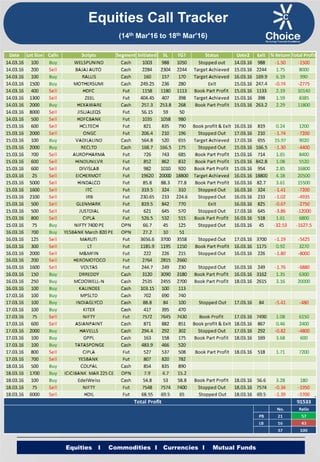
- 2. Pick of the Week: STATE BANK OF INDIA. 19th March, 2016 SEBI Certified – Research Analyst Equities I Commodities I Currencies I Mutual FundsSEBI Registered – Research Analyst Equities I Commodities I Currencies I Mutual Funds This is solely for information of clients of Choice Broking and does not construe to be an investment advice. It is also not intended as an offer or solicitation for the purchase and sale of any financial instruments. Any action taken by you on the basis of the information contained herein is your responsibility alone and Choice Broking its subsidiaries or its employees or associates will not be liable in any manner for the consequences of such action taken by you. We have exercised due diligence in checking the correctness and authenticity of the information contained in this recommendation, but Choice Broking or any of its subsidiaries or associates or employees shall not be in any way responsible for any loss or damage that may arise to any person from any inadvertent error in the information contained in this recommendation or any action taken on basis of this information. Technical analysis studies Aprilket psychology, price patterns and volume levels. It is used to forecast future price and Aprilket movements. Technical analysis is complementary to fundamental analysis and news sources. The recommendations issued herewith might be contrary to recommendations issued by Choice Broking in the company research undertaken as the recommendations stated in this report is derived purely from technical analysis. Choice Broking has based this document on information obtained from sources it believes to be reliable but which it has not independently verified; Choice Broking makes no guarantee, representation or warranty and accepts no responsibility or liability as to its accuracy or completeness. The opinions contained within the report are based upon publicly available information at the time of publication and are subject to change without notice. The information and any disclosures provided herein are in sumAprily form and have been prepared for informational purposes. The recommendations and suggested price levels are intended purely for trading purposes. The recommendations are valid for the day of the report however trading trends and volumes might vary substantially on an intraday basis and the recommendations may be subject to change. The information and any disclosures provided herein may be considered confidential. Any use, distribution, modification, copying, forwarding or disclosure by any person is strictly prohibited. The information and any disclosures provided herein do not constitute a solicitation or offer to purchase or sell any security or other financial product or instrument. The current performance may be unaudited. Past performance does not guarantee future returns. There can be no assurance that investments will achieve any targeted rates of return, and there is no guarantee against the loss of your entire investment. POTENTIAL CONFLICT OF INTEREST DISCLOSURE (as on date of report) Disclosure of interest statement – • Analyst interest of the stock /Instrument(s): - No. • Firm interest of the stock / Instrument (s): - No. Disclaimer Contact Us Kunal Parmar (Research Associate) kunal.parmar@choiceindia.com PERFORMANCE TRACKER www.choiceindia.comcustomercare@choiceindia.com Kapil Shah(Research Associate) kapil.shah@choiceindia.com Amit Pathania (Research Associate) amit.pathania@choiceindia.com Vikas Chaudhari (Research Associate) vikas.chaudhari@choiceindia.com Kunal Parmar Digitally signed by Kunal Parmar DN: cn=Kunal Parmar, o=Choice Equity Broking Pvt Ltd., ou=Research Dept, email=kunal.parmar@choiceindia.com, c=IN Date: 2016.03.19 15:18:06 +05'30'