Download as PDF, PPTX
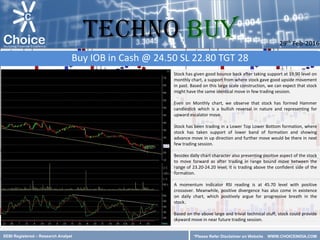


The stock has bounced back after finding support at 19.90 on the monthly chart. It has formed a hammer candlestick pattern, which is bullish reversal signal. The stock is trading above the range of 23.20-24.20 and technical indicators show positive crossover and divergence. Based on the technical analysis, the stock is expected to move upward in the near future. The recommendation is to buy IOB at 24.50 with stop loss of 22.80 and target of 28.


