
Recommended
More Related Content
What's hot
What's hot (17)
Similar to H W 2011 10 De
Similar to H W 2011 10 De (20)
H W 2011 10 De
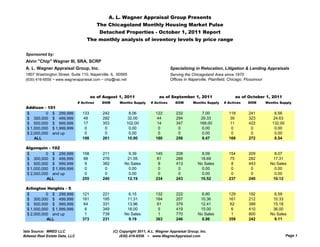
- 1. A. L. Wagner Appraisal Group Presents The Chicagoland Monthly Housing Market Pulse Detached Properties - October 1, 2011 Report The monthly analysis of inventory levels by price range Sponsored by: Alvin "Chip" Wagner III, SRA, SCRP A. L. Wagner Appraisal Group, Inc. Specializing in Relocation, Litigation & Lending Appraisals 1807 Washington Street, Suite 110, Naperville, IL 60565 Serving the Chicagoland Area since 1970 (630) 416-6556 ~ www.wagnerappraisal.com ~ chip@rac.net Offices in Naperville, Plainfield, Chicago, Flossmoor as of August 1, 2011 as of September 1, 2011 as of October 1, 2011 # Actives DOM Months Supply # Actives DOM Months Supply # Actives DOM Months Supply Addison - 101 $ 0 $ 299,999 133 242 8.06 122 232 7.00 118 241 6.56 $ 300,000 $ 499,999 48 282 32.00 44 294 29.33 39 323 24.63 500,000 999,999 $ 500 000 $ 999 999 17 353 102.00 14 347 168.00 11 422 132.00 $ 1,000,000 $ 1,999,999 0 0 0.00 0 0 0.00 0 0 0.00 $ 2,000,000 and up 0 0 0.00 0 0 0.00 0 0 0.00 ALL 198 261 10.90 180 256 9.47 168 272 8.54 Algonquin - 102 $ 0 $ 299,999 158 211 9.39 145 208 8.09 154 209 8.07 $ 300,000 $ 499,999 88 276 21.55 81 289 18.69 75 282 17.31 $ 500,000 $ 999,999 9 382 No Sales 8 413 No Sales 8 443 No Sales $ 1,000,000 $ 1,999,999 0 0 0.00 0 0 0.00 0 0 0.00 $ 2,000,000 and up 0 0 0.00 0 0 0.00 0 0 0.00 ALL 255 240 12.19 234 243 10.52 237 240 10.12 Arlington Heights - 5 $ 0 $ 299,999 121 221 6.15 132 222 6.80 129 192 6.59 $ 300,000 $ 499,999 181 195 11.31 164 207 10.36 161 212 10.33 $ 500,000 $ 999,999 64 331 13.96 61 379 12.41 62 399 15.18 $ 1,000,000 $ 1,999,999 6 349 18.00 5 419 15.00 6 410 36.00 $ 2,000,000 and up 1 739 No Sales 1 770 No Sales 1 800 No Sales ALL 373 231 9.19 363 246 8.96 359 242 9.11 Data Source: MRED LLC (C) Copyright 2011, A.L. Wagner Appraisal Group, Inc. Midwest Real Estate Data, LLC (630) 416-6556 ~ www.WagnerAppraisal.com Page 1
- 2. as of August 1, 2011 as of September 1, 2011 as of October 1, 2011 # Actives DOM Months Supply # Actives DOM Months Supply # Actives DOM Months Supply Aurora - 507 $ 0 $ 299,999 740 204 5.66 742 210 5.57 725 217 5.47 $ 300,000 $ 499,999 79 188 7.13 80 201 7.38 78 207 7.67 $ 500,000 $ 999,999 25 264 15.00 19 284 12.67 17 308 10.20 $ 1,000,000 $ 1,999,999 0 0 0.00 0 0 0.00 0 0 0.00 $ 2,000,000 and up 1 467 No Sales 1 498 No Sales 1 528 No Sales ALL 845 205 5.89 842 211 5.79 821 218 5.69 Barrington Area - 10 $ 0 $ 299,999 68 261 9.38 66 241 8.80 64 261 8.53 $ 300,000 $ 499,999 122 187 10.31 103 188 8.58 94 216 7.78 $ 500,000 $ 999,999 234 310 16.05 222 327 15.76 230 332 16.73 $ 1,000,000 $ 1,999,999 98 437 29.40 92 433 26.93 84 427 25.85 $ 2,000,000 and up 61 520 183.00 57 537 342.00 51 554 204.00 ALL 583 322 15.62 540 330 14.53 523 339 14.20 Bannockburn - 7115 $ 0 $ 299,999 0 0 0.00 0 0 0.00 0 0 0.00 $ 300,000 $ 499,999 0 0 0.00 0 0 0.00 0 0 0.00 $ 500,000 $ 999,999 3 317 18.00 4 540 24.00 4 570 24.00 1,000,000 1,999,999 $ 1 000 000 $ 1 999 999 5 246 30.00 30 00 5 277 30.00 30 00 5 307 60.00 60 00 $ 2,000,000 and up 7 69 42.00 8 89 48.00 8 119 48.00 ALL 15 177 25.71 17 250 29.14 17 280 34.00 Bartlett - 104 $ 0 $ 299,999 136 205 7.88 118 234 6.29 114 241 5.63 $ 300,000 $ 499,999 84 199 12.92 75 216 10.84 66 218 10.03 $ 500,000 $ 999,999 11 410 18.86 10 431 20.00 12 416 20.57 $ 1,000,000 $ 1,999,999 0 0 0.00 0 0 0.00 0 0 0.00 $ 2,000,000 and up 0 0 0.00 0 0 0.00 0 0 0.00 ALL 231 212 9.49 203 237 7.76 192 244 7.00 Batavia - 510 $ 0 $ 299,999 94 236 6.60 93 232 6.31 83 250 5.53 $ 300,000 $ 499,999 70 243 14.74 64 228 12.59 66 232 13.42 $ 500,000 $ 999,999 30 219 16.36 28 253 15.27 22 281 12.00 $ 1,000,000 $ 1,999,999 1 1,291 12.00 1 1,322 12.00 1 1,352 12.00 $ 2,000,000 and up 0 0 0.00 0 0 0.00 0 0 0.00 ALL 195 241 9.32 186 240 8.55 172 253 7.88 Data Source: MRED LLC (C) Copyright 2011, A.L. Wagner Appraisal Group, Inc. Midwest Real Estate Data, LLC (630) 416-6556 ~ www.WagnerAppraisal.com Page 2
- 3. as of August 1, 2011 as of September 1, 2011 as of October 1, 2011 # Actives DOM Months Supply # Actives DOM Months Supply # Actives DOM Months Supply Bensenville - 106 $ 0 $ 299,999 79 280 7.13 82 293 7.18 79 274 6.87 $ 300,000 $ 499,999 33 454 56.57 31 482 53.14 28 549 48.00 $ 500,000 $ 999,999 2 137 No Sales 2 168 No Sales 1 182 No Sales $ 1,000,000 $ 1,999,999 0 0 0.00 0 0 0.00 0 0 0.00 $ 2,000,000 and up 0 0 0.00 0 0 0.00 0 0 0.00 ALL 114 328 9.77 115 342 9.58 108 344 8.94 Bloomingdale - 108 $ 0 $ 299,999 49 149 10.50 57 178 12.44 57 168 12.44 $ 300,000 $ 499,999 35 193 12.35 32 211 11.64 34 187 12.75 $ 500,000 $ 999,999 31 250 37.20 29 243 49.71 30 254 60.00 $ 1,000,000 $ 1,999,999 2 224 No Sales 1 437 12.00 1 467 12.00 $ 2,000,000 and up 0 0 0.00 0 0 0.00 0 0 0.00 ALL 117 190 14.04 119 205 14.88 122 197 15.57 Bolingbrook - 440 $ 0 $ 299,999 348 203 7.28 341 213 7.23 328 218 6.59 $ 300,000 $ 499,999 58 205 13.13 55 206 11.79 56 216 11.79 $ 500,000 $ 999,999 4 46 24.00 3 52 18.00 6 96 72.00 1,000,000 1,999,999 $ 1 000 000 $ 1 999 999 0 0 0.00 0 00 0 0 0.00 0 00 0 0 0.00 0 00 $ 2,000,000 and up 0 0 0.00 0 0 0.00 0 0 0.00 ALL 410 201 7.82 399 210 7.67 390 215 7.15 Buffalo Grove - 89 $ 0 $ 299,999 55 235 4.75 48 203 4.11 51 239 4.40 $ 300,000 $ 499,999 77 180 9.06 75 185 9.28 70 191 8.66 $ 500,000 $ 999,999 21 238 7.64 21 212 9.00 19 218 8.77 $ 1,000,000 $ 1,999,999 1 422 No Sales 1 453 No Sales 1 483 No Sales $ 2,000,000 and up 0 0 0.00 0 0 0.00 0 0 0.00 ALL 154 209 6.74 145 197 6.57 141 214 6.46 Burr Ridge - 522 $ 0 $ 499,999 30 175 7.66 26 180 6.64 24 198 5.76 $ 500,000 $ 999,999 58 377 11.80 59 436 12.00 57 400 11.21 $ 1,000,000 $ 1,999,999 55 326 22.00 51 304 20.40 51 332 21.10 $ 2,000,000 $ 2,999,999 16 338 48.00 14 399 33.60 15 380 45.00 $ 3,000,000 and up 9 485 108.00 9 516 108.00 8 600 96.00 ALL 168 326 14.30 159 353 13.44 155 355 12.83 Data Source: MRED LLC (C) Copyright 2011, A.L. Wagner Appraisal Group, Inc. Midwest Real Estate Data, LLC (630) 416-6556 ~ www.WagnerAppraisal.com Page 3
- 4. as of August 1, 2011 as of September 1, 2011 as of October 1, 2011 # Actives DOM Months Supply # Actives DOM Months Supply # Actives DOM Months Supply Carol Stream - 188 $ 0 $ 299,999 125 202 10.07 109 205 8.84 104 201 8.26 $ 300,000 $ 499,999 28 150 15.27 28 171 14.00 25 142 12.00 $ 500,000 $ 999,999 0 0 0.00 0 0 0.00 0 0 0.00 $ 1,000,000 $ 1,999,999 0 0 0.00 0 0 0.00 0 0 0.00 $ 2,000,000 and up 0 0 0.00 0 0 0.00 0 0 0.00 ALL 153 192 10.74 137 198 9.56 129 189 8.80 Carpentersville, Lake Marion - 110 $ 0 $ 299,999 213 252 6.11 205 263 5.76 215 229 6.14 $ 300,000 $ 499,999 11 223 18.86 11 235 18.86 11 244 22.00 $ 500,000 $ 999,999 2 125 No Sales 1 147 12.00 1 177 12.00 $ 1,000,000 $ 1,999,999 0 0 0.00 0 0 0.00 0 0 0.00 $ 2,000,000 and up 0 0 0.00 0 0 0.00 0 0 0.00 ALL 226 249 6.37 217 261 5.97 227 230 6.36 Cary, Oakwood Hills - 13 $ 0 $ 299,999 176 225 14.57 167 234 13.01 171 238 13.50 $ 300,000 $ 499,999 57 210 24.43 54 224 22.34 49 231 21.00 $ 500,000 $ 999,999 16 200 32.00 17 186 34.00 17 224 34.00 1,000,000 1,999,999 $ 1 000 000 $ 1 999 999 0 0 0.00 0 00 0 0 0.00 0 00 0 0 0.00 0 00 $ 2,000,000 and up 0 0 0.00 0 0 0.00 0 0 0.00 ALL 249 220 16.69 238 228 15.11 237 235 15.29 Channahon - 410 $ 0 $ 299,999 75 225 7.96 82 227 9.20 76 216 8.85 $ 300,000 $ 499,999 16 268 13.71 16 400 16.00 14 457 14.00 $ 500,000 $ 999,999 1 207 12.00 1 238 12.00 1 268 12.00 $ 1,000,000 $ 1,999,999 0 0 0.00 0 0 0.00 0 0 0.00 $ 2,000,000 and up 0 0 0.00 0 0 0.00 0 0 0.00 ALL 92 233 8.63 99 255 9.90 91 254 9.41 Clarendon Hills - 514 $ 0 $ 299,999 14 228 9.33 14 250 8.00 17 267 10.74 $ 300,000 $ 499,999 22 206 11.00 19 225 7.60 20 216 7.74 $ 500,000 $ 999,999 23 197 10.62 21 227 10.08 18 235 8.00 $ 1,000,000 $ 1,999,999 15 448 7.83 15 474 9.00 11 576 6.60 $ 2,000,000 and up 2 220 No Sales 2 251 No Sales 1 387 12.00 ALL 76 255 10.02 71 284 8.88 67 296 8.20 Data Source: MRED LLC (C) Copyright 2011, A.L. Wagner Appraisal Group, Inc. Midwest Real Estate Data, LLC (630) 416-6556 ~ www.WagnerAppraisal.com Page 4
- 5. as of August 1, 2011 as of September 1, 2011 as of October 1, 2011 # Actives DOM Months Supply # Actives DOM Months Supply # Actives DOM Months Supply Countryside - 527 $ 0 $ 299,999 12 273 6.55 13 319 8.21 11 361 6.60 $ 300,000 $ 499,999 11 170 33.00 9 214 27.00 8 203 19.20 $ 500,000 $ 999,999 5 387 60.00 5 382 60.00 4 503 48.00 $ 1,000,000 $ 1,999,999 0 0 0.00 0 0 0.00 0 0 0.00 $ 2,000,000 and up 0 0 0.00 0 0 0.00 0 0 0.00 ALL 28 253 12.44 27 296 13.50 23 331 10.62 Crystal Lake, Lakewood, Prairie Grove - 14 $ 0 $ 299,999 261 236 7.15 251 245 6.80 255 242 6.99 $ 300,000 $ 499,999 116 216 11.05 117 229 11.51 115 222 12.21 $ 500,000 $ 999,999 48 355 24.00 52 352 27.13 54 325 29.45 $ 1,000,000 $ 1,999,999 11 288 26.40 10 345 20.00 11 387 33.00 $ 2,000,000 and up 1 28 No Sales 1 59 No Sales 1 89 No Sales ALL 437 244 8.84 431 256 8.71 436 250 9.07 Darien - 562 $ 0 $ 299,999 37 253 6.00 34 273 5.23 34 293 5.37 $ 300,000 $ 499,999 37 149 11.68 40 151 12.63 40 139 12.63 $ 500,000 $ 999,999 17 167 15.69 16 176 19.20 14 156 15.27 1,000,000 1,999,999 $ 1 000 000 $ 1 999 999 1 106 No Sales 1 137 No Sales 1 167 No Sales $ 2,000,000 and up 0 0 0.00 0 0 0.00 0 0 0.00 ALL 92 194 8.83 91 201 8.67 89 201 8.54 Deerfield - 15 $ 0 $ 299,999 15 208 3.00 18 135 3.60 19 184 4.00 $ 300,000 $ 499,999 45 237 7.83 52 242 9.18 43 265 7.37 $ 500,000 $ 999,999 52 167 11.56 50 167 11.11 51 169 11.13 $ 1,000,000 $ 1,999,999 11 217 8.25 13 212 9.75 17 189 12.75 $ 2,000,000 and up 1 1,999 No Sales 1 2,030 No Sales 1 2,060 No Sales ALL 124 216 7.48 134 210 8.12 131 220 7.94 Des Plaines - 16 $ 0 $ 299,999 194 234 6.47 193 240 6.29 198 234 6.62 $ 300,000 $ 499,999 61 192 14.08 70 185 18.26 68 206 17.74 $ 500,000 $ 999,999 27 285 29.45 25 302 30.00 25 317 30.00 $ 1,000,000 $ 1,999,999 3 438 No Sales 3 469 No Sales 3 499 No Sales $ 2,000,000 and up 1 686 No Sales 1 717 No Sales 1 747 No Sales ALL 286 233 8.11 292 236 8.26 295 239 8.53 Data Source: MRED LLC (C) Copyright 2011, A.L. Wagner Appraisal Group, Inc. Midwest Real Estate Data, LLC (630) 416-6556 ~ www.WagnerAppraisal.com Page 5
- 6. as of August 1, 2011 as of September 1, 2011 as of October 1, 2011 # Actives DOM Months Supply # Actives DOM Months Supply # Actives DOM Months Supply Downers Grove - 515 $ 0 $ 299,999 113 312 6.40 111 305 5.95 109 317 5.79 $ 300,000 $ 499,999 113 225 10.51 110 229 11.09 107 228 10.52 $ 500,000 $ 999,999 82 349 12.30 81 381 12.00 80 399 12.47 $ 1,000,000 $ 1,999,999 17 230 68.00 12 260 48.00 12 222 72.00 $ 2,000,000 and up 1 448 12.00 1 479 12.00 1 509 12.00 ALL 326 287 9.20 315 297 8.83 309 304 8.66 Dundee, East & West Dundee, Sleepy Hollow - 118 $ 0 $ 299,999 77 213 9.63 72 212 8.39 77 195 8.88 $ 300,000 $ 499,999 42 274 16.80 42 271 19.38 44 289 21.12 $ 500,000 $ 999,999 9 348 21.60 8 349 32.00 8 379 32.00 $ 1,000,000 $ 1,999,999 0 0 0.00 0 0 0.00 0 0 0.00 $ 2,000,000 and up 0 0 0.00 0 0 0.00 0 0 0.00 ALL 128 242 11.73 122 241 11.09 129 238 11.73 Elburn - 119 $ 0 $ 299,999 50 317 7.59 55 312 8.80 50 340 7.23 $ 300,000 $ 499,999 46 292 25.09 46 271 21.23 40 311 20.87 $ 500,000 $ 999,999 11 581 132.00 12 566 144.00 14 472 168.00 1,000,000 1,999,999 $ 1 000 000 $ 1 999 999 3 406 36.00 36 00 3 437 36.00 36 00 2 464 24.00 24 00 $ 2,000,000 and up 0 0 0.00 0 0 0.00 0 0 0.00 ALL 110 336 12.82 116 325 13.51 106 349 11.78 Elgin - 123 $ 0 $ 299,999 648 244 7.76 648 248 7.70 600 255 6.86 $ 300,000 $ 499,999 137 359 21.35 137 377 21.63 124 436 19.84 $ 500,000 $ 999,999 45 493 49.09 37 477 44.40 33 500 36.00 $ 1,000,000 $ 1,999,999 2 72 No Sales 3 71 No Sales 3 101 No Sales $ 2,000,000 and up 0 0 0.00 0 0 0.00 0 0 0.00 ALL 832 276 9.16 825 279 9.03 760 294 8.04 Elk Grove Village - 7 $ 0 $ 299,999 93 250 9.00 94 252 9.02 93 263 8.86 $ 300,000 $ 499,999 48 202 19.86 45 190 18.00 43 232 18.43 $ 500,000 $ 999,999 4 407 16.00 4 438 16.00 2 132 6.00 $ 1,000,000 $ 1,999,999 0 0 0.00 0 0 0.00 0 0 0.00 $ 2,000,000 and up 0 0 0.00 0 0 0.00 0 0 0.00 ALL 145 238 11.15 143 237 10.86 138 252 10.48 Data Source: MRED LLC (C) Copyright 2011, A.L. Wagner Appraisal Group, Inc. Midwest Real Estate Data, LLC (630) 416-6556 ~ www.WagnerAppraisal.com Page 6
- 7. as of August 1, 2011 as of September 1, 2011 as of October 1, 2011 # Actives DOM Months Supply # Actives DOM Months Supply # Actives DOM Months Supply Elmhurst - 126 $ 0 $ 299,999 101 209 6.31 95 210 5.97 81 224 4.86 $ 300,000 $ 499,999 82 187 7.45 85 200 8.10 79 179 7.65 $ 500,000 $ 999,999 115 187 12.11 108 199 10.80 105 214 10.86 $ 1,000,000 $ 1,999,999 23 457 30.67 22 448 29.33 19 473 22.80 $ 2,000,000 and up 0 0 0.00 0 0 0.00 0 0 0.00 ALL 321 213 8.62 310 220 8.34 284 224 7.57 Elmwood Park - 635 $ 0 $ 299,999 105 221 7.28 110 239 7.67 102 249 7.20 $ 300,000 $ 499,999 24 246 19.20 26 238 24.00 27 255 27.00 $ 500,000 $ 999,999 1 7 No Sales 1 38 No Sales 0 0 0.00 $ 1,000,000 $ 1,999,999 0 0 0.00 0 0 0.00 0 0 0.00 $ 2,000,000 and up 0 0 0.00 0 0 0.00 0 0 0.00 ALL 130 224 8.30 137 237 8.89 129 250 8.51 Evanston - 201 $ 0 $ 299,999 67 227 6.64 63 238 6.00 67 226 6.48 $ 300,000 $ 499,999 60 169 5.85 55 162 5.20 61 144 5.95 $ 500,000 $ 999,999 83 151 6.38 81 145 7.09 86 140 7.70 1,000,000 1,999,999 $ 1 000 000 $ 1 999 999 22 243 8.52 8 52 18 215 7.45 7 45 19 253 7.86 7 86 $ 2,000,000 and up 10 471 120.00 10 502 120.00 9 578 108.00 ALL 242 198 6.72 227 196 6.49 242 190 7.07 Flossmoor - 422 $ 0 $ 299,999 78 228 8.83 85 216 9.62 83 219 8.97 $ 300,000 $ 499,999 40 308 21.82 36 325 16.62 34 348 15.69 $ 500,000 $ 999,999 14 432 21.00 15 456 22.50 16 398 27.43 $ 1,000,000 $ 1,999,999 0 0 0.00 0 0 0.00 0 0 0.00 $ 2,000,000 and up 0 0 0.00 0 0 0.00 0 0 0.00 ALL 132 274 11.65 136 271 11.66 133 274 11.08 Frankfort, Green Garden - 423 $ 0 $ 299,999 61 226 6.97 63 202 7.07 64 224 7.18 $ 300,000 $ 499,999 129 253 17.20 116 250 14.97 108 262 13.94 $ 500,000 $ 999,999 55 316 27.50 55 291 24.44 57 311 27.36 $ 1,000,000 $ 1,999,999 6 381 No Sales 6 412 No Sales 6 420 No Sales $ 2,000,000 and up 0 0 0.00 0 0 0.00 0 0 0.00 ALL 251 263 13.75 240 251 12.69 235 268 12.53 Data Source: MRED LLC (C) Copyright 2011, A.L. Wagner Appraisal Group, Inc. Midwest Real Estate Data, LLC (630) 416-6556 ~ www.WagnerAppraisal.com Page 7
- 8. as of August 1, 2011 as of September 1, 2011 as of October 1, 2011 # Actives DOM Months Supply # Actives DOM Months Supply # Actives DOM Months Supply Franklin Park - 131 $ 0 $ 299,999 117 216 6.75 120 217 6.82 123 225 6.87 $ 300,000 $ 499,999 2 748 No Sales 2 779 No Sales 2 809 No Sales $ 500,000 $ 999,999 0 0 0.00 0 0 0.00 0 0 0.00 $ 1,000,000 $ 1,999,999 0 0 0.00 0 0 0.00 0 0 0.00 $ 2,000,000 and up 0 0 0.00 0 0 0.00 0 0 0.00 ALL 119 225 6.87 122 226 6.94 125 234 6.98 Geneva - 134 $ 0 $ 299,999 85 192 7.39 76 210 6.42 62 201 5.24 $ 300,000 $ 499,999 122 182 9.96 118 186 9.83 114 192 9.37 $ 500,000 $ 999,999 47 254 22.56 45 256 22.50 39 246 18.72 $ 1,000,000 $ 1,999,999 6 681 72.00 5 681 60.00 6 595 No Sales $ 2,000,000 and up 0 0 0.00 0 0 0.00 0 0 0.00 ALL 260 210 10.03 244 217 9.41 221 215 8.47 Glen Ellyn - 137 $ 0 $ 299,999 74 184 6.25 73 169 5.88 76 198 6.04 $ 300,000 $ 499,999 71 180 6.04 72 180 6.13 74 173 6.30 $ 500,000 $ 999,999 74 313 8.79 72 317 8.73 73 284 9.22 1,000,000 1,999,999 $ 1 000 000 $ 1 999 999 16 687 24.00 24 00 17 677 34.00 34 00 21 534 42.00 42 00 $ 2,000,000 and up 0 0 0.00 0 0 0.00 0 0 0.00 ALL 235 258 7.19 234 255 7.11 244 245 7.45 Glencoe - 22 $ 0 $ 499,999 11 166 4.89 12 264 4.65 7 219 2.33 $ 500,000 $ 999,999 37 215 7.05 38 191 7.35 32 220 6.00 $ 1,000,000 $ 1,999,999 37 163 9.45 35 163 9.55 31 161 8.27 $ 2,000,000 $ 2,999,999 22 275 29.33 19 318 20.73 16 338 17.45 $ 3,000,000 and up 11 530 18.86 11 500 18.86 10 398 17.14 ALL 118 235 9.25 115 241 8.90 96 239 7.07 Glendale Heights - 139 $ 0 $ 299,999 123 228 6.87 116 234 6.60 127 234 7.33 $ 300,000 $ 499,999 5 381 30.00 5 412 30.00 4 296 24.00 $ 500,000 $ 999,999 0 0 0.00 0 0 0.00 0 0 0.00 $ 1,000,000 $ 1,999,999 0 0 0.00 0 0 0.00 0 0 0.00 $ 2,000,000 and up 0 0 0.00 0 0 0.00 0 0 0.00 ALL 128 234 7.08 121 241 6.82 131 235 7.49 Data Source: MRED LLC (C) Copyright 2011, A.L. Wagner Appraisal Group, Inc. Midwest Real Estate Data, LLC (630) 416-6556 ~ www.WagnerAppraisal.com Page 8
- 9. as of August 1, 2011 as of September 1, 2011 as of October 1, 2011 # Actives DOM Months Supply # Actives DOM Months Supply # Actives DOM Months Supply Glenview, Golf - 25 $ 0 $ 299,999 49 168 4.78 46 202 4.35 40 242 3.69 $ 300,000 $ 499,999 107 223 12.59 99 245 11.10 87 266 8.63 $ 500,000 $ 999,999 131 225 8.73 126 243 8.69 124 258 8.80 $ 1,000,000 $ 1,999,999 49 209 11.53 53 212 13.25 48 225 13.09 $ 2,000,000 and up 9 205 36.00 7 260 42.00 7 226 84.00 ALL 345 213 9.02 331 234 8.67 306 252 7.90 Grayslake, Gages Lake, Hainesville, Third Lake, Wildwood - 30 $ 0 $ 299,999 214 197 8.53 224 196 8.84 229 194 9.32 $ 300,000 $ 499,999 50 277 16.22 43 268 15.18 39 303 13.76 $ 500,000 $ 999,999 7 146 42.00 7 162 42.00 8 168 48.00 $ 1,000,000 $ 1,999,999 0 0 0.00 1 33 No Sales 1 63 No Sales $ 2,000,000 and up 0 0 0.00 0 0 0.00 0 0 0.00 ALL 271 210 9.56 275 206 9.71 277 208 10.04 Gurnee - 31 $ 0 $ 299,999 157 217 10.07 152 234 9.60 150 236 9.00 $ 300,000 $ 499,999 58 263 11.05 58 266 12.21 50 242 11.32 $ 500,000 $ 999,999 19 450 19.00 18 473 16.62 15 350 15.00 1,000,000 1,999,999 $ 1 000 000 $ 1 999 999 0 0 0.00 0 00 0 0 0.00 0 00 0 0 0.00 0 00 $ 2,000,000 and up 0 0 0.00 0 0 0.00 0 0 0.00 ALL 234 247 10.72 228 261 10.52 215 245 9.74 Hanover Park - 103 $ 0 $ 299,999 116 200 6.30 111 200 5.79 111 212 5.79 $ 300,000 $ 499,999 2 188 24.00 2 219 24.00 1 194 12.00 $ 500,000 $ 999,999 1 1,026 No Sales 0 0 0.00 0 0 0.00 $ 1,000,000 $ 1,999,999 0 0 0.00 0 0 0.00 0 0 0.00 $ 2,000,000 and up 0 0 0.00 0 0 0.00 0 0 0.00 ALL 119 206 6.43 113 201 5.87 112 212 5.82 Highland Park - 35 $ 0 $ 299,999 35 222 6.77 26 185 4.46 28 207 5.01 $ 300,000 $ 499,999 69 211 6.27 79 220 7.24 81 230 7.25 $ 500,000 $ 999,999 107 198 12.97 98 225 11.31 93 236 10.63 $ 1,000,000 $ 1,999,999 65 304 26.00 62 305 29.76 58 313 26.77 $ 2,000,000 and up 24 279 48.00 19 321 32.57 21 354 50.40 ALL 300 233 10.94 284 244 10.11 281 256 10.01 Data Source: MRED LLC (C) Copyright 2011, A.L. Wagner Appraisal Group, Inc. Midwest Real Estate Data, LLC (630) 416-6556 ~ www.WagnerAppraisal.com Page 9
- 10. as of August 1, 2011 as of September 1, 2011 as of October 1, 2011 # Actives DOM Months Supply # Actives DOM Months Supply # Actives DOM Months Supply Hinsdale - 521 $ 0 $ 499,999 59 364 12.87 55 371 12.69 53 394 10.97 $ 500,000 $ 999,999 97 191 10.39 87 208 9.24 86 207 10.02 $ 1,000,000 $ 1,999,999 71 257 9.36 72 236 9.82 75 207 11.25 $ 2,000,000 $ 2,999,999 21 318 15.75 24 322 20.57 22 333 17.60 $ 3,000,000 and up 21 320 84.00 17 347 51.00 16 347 64.00 ALL 269 266 11.65 255 271 11.29 252 266 11.68 Hoffman Estates - 194 $ 0 $ 299,999 124 188 7.29 122 191 7.07 122 202 7.18 $ 300,000 $ 499,999 72 174 9.93 72 195 10.67 73 199 10.68 $ 500,000 $ 999,999 12 173 24.00 10 229 20.00 10 248 30.00 $ 1,000,000 $ 1,999,999 0 0 0.00 0 0 0.00 0 0 0.00 $ 2,000,000 and up 0 0 0.00 0 0 0.00 0 0 0.00 ALL 208 182 8.40 204 194 8.33 205 203 8.48 Homer Glen - 500 $ 0 $ 299,999 65 221 9.75 69 221 9.98 76 216 10.86 $ 300,000 $ 499,999 110 281 25.38 106 274 24.00 88 312 17.90 $ 500,000 $ 999,999 46 408 36.80 45 371 36.00 46 390 36.80 1,000,000 1,999,999 $ 1 000 000 $ 1 999 999 7 160 No Sales 5 210 No Sales 4 284 48.00 48 00 $ 2,000,000 and up 0 0 0.00 0 0 0.00 0 0 0.00 ALL 228 286 18.61 225 276 17.88 214 294 16.15 Homewood - 430 $ 0 $ 299,999 133 195 8.72 143 187 9.13 148 199 9.20 $ 300,000 $ 499,999 6 60 14.40 7 80 16.80 8 97 24.00 $ 500,000 $ 999,999 0 0 0.00 0 0 0.00 0 0 0.00 $ 1,000,000 $ 1,999,999 0 0 0.00 0 0 0.00 0 0 0.00 $ 2,000,000 and up 0 0 0.00 0 0 0.00 0 0 0.00 ALL 139 189 8.87 150 182 9.33 156 194 9.50 Indian Head Park - 531 $ 0 $ 299,999 2 91 24.00 2 122 24.00 1 108 12.00 $ 300,000 $ 499,999 6 347 10.29 6 377 10.29 7 350 12.00 $ 500,000 $ 999,999 4 136 6.00 3 73 5.14 9 97 18.00 $ 1,000,000 $ 1,999,999 1 20 No Sales 1 51 No Sales 1 81 No Sales $ 2,000,000 and up 0 0 0.00 0 0 0.00 0 0 0.00 ALL 13 218 9.75 12 231 9.60 18 195 15.43 Data Source: MRED LLC (C) Copyright 2011, A.L. Wagner Appraisal Group, Inc. Midwest Real Estate Data, LLC (630) 416-6556 ~ www.WagnerAppraisal.com Page 10
- 11. as of August 1, 2011 as of September 1, 2011 as of October 1, 2011 # Actives DOM Months Supply # Actives DOM Months Supply # Actives DOM Months Supply Inverness - 7167 $ 0 $ 299,999 5 158 12.00 8 302 16.00 5 469 6.67 $ 300,000 $ 499,999 17 470 8.16 17 433 8.16 19 446 9.50 $ 500,000 $ 999,999 75 258 26.47 67 278 25.94 70 285 27.10 $ 1,000,000 $ 1,999,999 19 373 28.50 19 391 32.57 16 393 27.43 $ 2,000,000 and up 4 918 48.00 5 768 60.00 4 996 48.00 ALL 120 324 19.73 116 342 19.89 114 360 19.00 Itasca - 143 $ 0 $ 299,999 18 188 6.97 20 185 7.27 20 176 7.06 $ 300,000 $ 499,999 21 227 25.20 19 270 25.33 22 201 37.71 $ 500,000 $ 999,999 19 637 45.60 19 596 32.57 23 568 46.00 $ 1,000,000 $ 1,999,999 1 628 No Sales 1 659 No Sales 0 0 0.00 $ 2,000,000 and up 0 0 0.00 0 0 0.00 0 0 0.00 ALL 59 354 15.39 59 353 14.45 65 323 16.60 Joliet - 499 $ 0 $ 299,999 685 242 8.79 661 240 8.41 681 235 8.45 $ 300,000 $ 499,999 15 332 16.36 15 341 16.36 10 259 10.91 $ 500,000 $ 999,999 5 431 60.00 4 407 No Sales 3 542 No Sales 1,000,000 1,999,999 $ 1 000 000 $ 1 999 999 0 0 0.00 0 00 0 0 0.00 0 00 0 0 0.00 0 00 $ 2,000,000 and up 0 0 0.00 0 0 0.00 0 0 0.00 ALL 705 245 8.93 680 244 8.55 694 236 8.52 Kenilworth - 43 $ 0 $ 299,999 0 0 0.00 0 0 0.00 0 0 0.00 $ 300,000 $ 499,999 1 164 4.00 1 195 4.00 2 157 8.00 $ 500,000 $ 999,999 8 104 9.60 7 94 9.33 8 149 10.67 $ 1,000,000 $ 1,999,999 14 334 10.50 17 303 12.75 15 349 10.59 $ 2,000,000 and up 12 427 9.60 11 483 8.25 12 470 10.29 ALL 35 309 9.55 36 314 9.82 37 335 10.33 LaGrange - 525 $ 0 $ 299,999 17 193 6.00 14 219 4.80 14 251 5.25 $ 300,000 $ 499,999 34 175 6.69 35 197 6.67 36 188 7.08 $ 500,000 $ 999,999 33 247 6.83 37 231 8.88 39 174 9.18 $ 1,000,000 $ 1,999,999 4 68 9.60 4 99 9.60 2 99 4.00 $ 2,000,000 and up 1 91 No Sales 1 122 No Sales 0 0 0.00 ALL 89 200 6.76 91 209 7.14 91 190 7.28 Data Source: MRED LLC (C) Copyright 2011, A.L. Wagner Appraisal Group, Inc. Midwest Real Estate Data, LLC (630) 416-6556 ~ www.WagnerAppraisal.com Page 11
- 12. as of August 1, 2011 as of September 1, 2011 as of October 1, 2011 # Actives DOM Months Supply # Actives DOM Months Supply # Actives DOM Months Supply LaGrange Highlands - 528 $ 0 $ 299,999 3 34 2.77 5 44 4.00 5 74 5.00 $ 300,000 $ 499,999 6 135 18.00 8 168 24.00 8 195 19.20 $ 500,000 $ 999,999 2 358 8.00 1 137 4.00 1 167 4.00 $ 1,000,000 $ 1,999,999 0 0 0.00 0 0 0.00 0 0 0.00 $ 2,000,000 and up 0 0 0.00 0 0 0.00 0 0 0.00 ALL 11 148 6.60 14 121 7.64 14 150 8.40 LaGrange Park - 526 $ 0 $ 299,999 36 196 6.97 33 267 6.09 35 251 6.36 $ 300,000 $ 499,999 26 163 10.76 18 168 7.20 22 169 9.10 $ 500,000 $ 999,999 9 257 7.20 9 238 8.31 10 201 9.23 $ 1,000,000 $ 1,999,999 0 0 0.00 0 0 0.00 0 0 0.00 $ 2,000,000 and up 0 0 0.00 0 0 0.00 0 0 0.00 ALL 71 192 8.04 60 233 6.67 67 217 7.44 Lake Bluff - 44 $ 0 $ 299,999 8 282 6.86 9 253 7.20 11 186 7.33 $ 300,000 $ 499,999 31 198 10.05 27 223 8.31 34 201 10.46 $ 500,000 $ 999,999 33 189 11.00 34 186 12.36 38 165 13.82 1,000,000 1,999,999 $ 1 000 000 $ 1 999 999 16 204 12.00 12 00 17 298 11.33 11 33 15 239 11.25 11 25 $ 2,000,000 and up 8 479 96.00 7 321 84.00 10 273 120.00 ALL 96 226 11.08 94 234 10.64 108 199 12.11 Lake Forest - 45 $ 0 $ 499,999 26 170 8.67 25 176 7.69 26 194 8.43 $ 500,000 $ 999,999 113 236 12.44 99 252 11.42 97 273 11.19 $ 1,000,000 $ 1,999,999 96 296 16.94 85 346 15.45 88 332 16.00 $ 2,000,000 $ 2,999,999 47 341 33.18 39 350 26.00 42 331 25.20 $ 3,000,000 and up 43 451 34.40 40 508 30.00 34 514 27.20 ALL 325 292 15.92 288 322 14.22 287 321 14.23 Lake Villa, Lindenhurst - 46 $ 0 $ 299,999 202 213 9.40 208 211 9.49 210 223 9.69 $ 300,000 $ 499,999 67 243 12.00 60 257 10.59 56 277 10.18 $ 500,000 $ 999,999 16 320 32.00 17 331 40.80 14 350 42.00 $ 1,000,000 $ 1,999,999 1 460 No Sales 1 491 No Sales 1 521 No Sales $ 2,000,000 and up 1 330 No Sales 1 361 No Sales 1 391 No Sales ALL 287 227 10.40 287 229 10.25 282 242 10.25 Data Source: MRED LLC (C) Copyright 2011, A.L. Wagner Appraisal Group, Inc. Midwest Real Estate Data, LLC (630) 416-6556 ~ www.WagnerAppraisal.com Page 12
- 13. as of August 1, 2011 as of September 1, 2011 as of October 1, 2011 # Actives DOM Months Supply # Actives DOM Months Supply # Actives DOM Months Supply Lemont - 439 $ 0 $ 299,999 50 304 12.00 49 311 9.97 51 308 10.03 $ 300,000 $ 499,999 87 295 18.98 79 319 15.54 84 308 18.00 $ 500,000 $ 999,999 58 318 19.89 54 305 20.90 49 333 18.97 $ 1,000,000 $ 1,999,999 1 498 No Sales 0 0 0.00 0 0 0.00 $ 2,000,000 and up 0 0 0.00 0 0 0.00 0 0 0.00 ALL 196 305 16.80 182 313 14.46 184 314 14.92 Libertyville, Green Oaks - 48 $ 0 $ 299,999 27 252 4.91 31 209 5.24 32 217 5.12 $ 300,000 $ 499,999 99 229 10.70 101 245 10.92 99 248 10.51 $ 500,000 $ 999,999 140 253 14.87 134 270 15.31 131 279 15.88 $ 1,000,000 $ 1,999,999 39 350 117.00 40 367 120.00 32 411 76.80 $ 2,000,000 and up 1 1,797 No Sales 1 1,828 No Sales 1 1,858 No Sales ALL 306 262 12.49 307 274 12.66 295 281 12.12 Lincolnshire - 69 $ 0 $ 299,999 6 205 6.55 6 359 8.00 6 298 8.00 $ 300,000 $ 499,999 26 214 6.93 24 238 6.40 23 223 6.13 $ 500,000 $ 999,999 34 230 12.75 33 208 14.14 32 231 13.71 1,000,000 1,999,999 $ 1 000 000 $ 1 999 999 10 341 17.14 17 14 12 313 20.57 20 57 11 369 18.86 18 86 $ 2,000,000 and up 0 0 0.00 0 0 0.00 0 0 0.00 ALL 76 237 9.60 75 247 10.11 72 255 9.71 Lincolnwood - 645 $ 0 $ 299,999 20 174 3.87 26 183 5.29 23 201 4.68 $ 300,000 $ 499,999 41 237 9.46 41 237 9.46 45 220 12.27 $ 500,000 $ 999,999 29 227 10.88 26 273 9.75 23 306 8.12 $ 1,000,000 $ 1,999,999 8 300 48.00 6 179 36.00 6 209 36.00 $ 2,000,000 and up 1 471 No Sales 1 502 No Sales 1 17 No Sales ALL 99 229 8.03 100 232 8.28 98 233 8.46 Lisle - 532 $ 0 $ 299,999 56 242 12.00 58 266 11.41 55 292 11.19 $ 300,000 $ 499,999 50 242 10.17 48 222 9.93 46 222 9.86 $ 500,000 $ 999,999 25 324 21.43 26 360 28.36 25 343 37.50 $ 1,000,000 $ 1,999,999 0 0 0.00 0 0 0.00 0 0 0.00 $ 2,000,000 and up 0 0 0.00 0 0 0.00 0 0 0.00 ALL 131 257 12.19 132 269 12.18 126 277 12.29 Data Source: MRED LLC (C) Copyright 2011, A.L. Wagner Appraisal Group, Inc. Midwest Real Estate Data, LLC (630) 416-6556 ~ www.WagnerAppraisal.com Page 13
- 14. as of August 1, 2011 as of September 1, 2011 as of October 1, 2011 # Actives DOM Months Supply # Actives DOM Months Supply # Actives DOM Months Supply Lockport, Homer Township - 495 $ 0 $ 299,999 187 214 10.95 167 212 9.32 152 207 8.07 $ 300,000 $ 499,999 53 213 15.51 49 223 16.33 51 230 15.30 $ 500,000 $ 999,999 6 340 72.00 7 319 No Sales 8 284 96.00 $ 1,000,000 $ 1,999,999 3 170 No Sales 3 201 No Sales 2 314 24.00 $ 2,000,000 and up 0 0 0.00 0 0 0.00 0 0 0.00 ALL 249 216 12.10 226 217 10.80 213 216 9.54 Lombard - 148 $ 0 $ 299,999 195 184 8.27 187 195 7.48 178 201 7.10 $ 300,000 $ 499,999 47 390 9.72 47 408 9.40 47 408 9.10 $ 500,000 $ 999,999 16 205 27.43 12 175 20.57 11 170 18.86 $ 1,000,000 $ 1,999,999 0 0 0.00 1 16 No Sales 1 46 No Sales $ 2,000,000 and up 1 154 No Sales 1 185 No Sales 1 215 No Sales ALL 259 223 8.93 248 234 8.11 238 240 7.72 Long Grove, Lake Zurich, Hawthorn Woods, Kildeer - 47 $ 0 $ 299,999 89 197 7.52 91 187 7.64 88 209 7.23 $ 300,000 $ 499,999 126 181 10.72 134 189 11.91 131 215 11.15 $ 500,000 $ 999,999 216 286 18.92 219 303 19.76 199 311 18.09 1,000,000 1,999,999 $ 1 000 000 $ 1 999 999 43 352 25.80 25 80 40 347 30.00 30 00 43 327 34.40 34 40 $ 2,000,000 and up 5 692 No Sales 4 798 No Sales 4 828 No Sales ALL 479 252 13.06 488 258 13.71 465 271 12.86 Medinah - 157 $ 0 $ 299,999 11 479 12.00 12 467 12.00 10 521 8.00 $ 300,000 $ 499,999 9 325 12.00 7 378 7.00 4 337 3.43 $ 500,000 $ 999,999 4 589 12.00 1 1,558 2.40 1 1,588 3.00 $ 1,000,000 $ 1,999,999 0 0 0.00 0 0 0.00 0 0 0.00 $ 2,000,000 and up 0 0 0.00 0 0 0.00 0 0 0.00 ALL 24 439 12.00 20 491 8.28 15 543 5.45 Minooka - 447 $ 0 $ 299,999 68 240 6.92 66 242 6.66 66 241 6.66 $ 300,000 $ 499,999 18 142 43.20 18 171 43.20 14 190 33.60 $ 500,000 $ 999,999 12 243 144.00 11 281 132.00 11 304 132.00 $ 1,000,000 $ 1,999,999 1 770 No Sales 1 801 No Sales 1 831 No Sales $ 2,000,000 and up 0 0 0.00 0 0 0.00 0 0 0.00 ALL 99 228 9.58 96 239 9.22 92 247 8.83 Data Source: MRED LLC (C) Copyright 2011, A.L. Wagner Appraisal Group, Inc. Midwest Real Estate Data, LLC (630) 416-6556 ~ www.WagnerAppraisal.com Page 14
- 15. as of August 1, 2011 as of September 1, 2011 as of October 1, 2011 # Actives DOM Months Supply # Actives DOM Months Supply # Actives DOM Months Supply Mokena - 448 $ 0 $ 299,999 56 221 8.40 57 223 8.77 52 226 7.52 $ 300,000 $ 499,999 64 212 17.45 53 250 12.98 51 279 12.24 $ 500,000 $ 999,999 24 252 24.00 24 260 22.15 22 279 20.31 $ 1,000,000 $ 1,999,999 3 137 36.00 3 168 36.00 3 198 36.00 $ 2,000,000 and up 1 260 No Sales 1 291 No Sales 2 162 No Sales ALL 148 221 12.96 138 239 11.74 130 254 10.61 Montgomery - 538 $ 0 $ 299,999 193 193 7.82 182 205 6.98 186 207 7.06 $ 300,000 $ 499,999 3 656 36.00 2 971 No Sales 2 1,001 No Sales $ 500,000 $ 999,999 0 0 0.00 0 0 0.00 0 0 0.00 $ 1,000,000 $ 1,999,999 0 0 0.00 0 0 0.00 0 0 0.00 $ 2,000,000 and up 0 0 0.00 0 0 0.00 0 0 0.00 ALL 196 200 7.92 184 214 7.05 188 215 7.14 Morton Grove - 53 $ 0 $ 299,999 73 216 5.73 72 190 5.68 72 208 5.50 $ 300,000 $ 499,999 42 233 10.96 45 249 11.74 41 265 10.25 $ 500,000 $ 999,999 15 296 12.86 13 250 11.14 13 252 12.00 1,000,000 1,999,999 $ 1 000 000 $ 1 999 999 0 0 0.00 0 00 1 9 No Sales 0 0 0.00 0 00 $ 2,000,000 and up 0 0 0.00 0 0 0.00 0 0 0.00 ALL 130 230 7.32 131 215 7.42 126 231 6.90 Mount Prospect - 56 $ 0 $ 299,999 111 230 6.43 114 234 6.87 121 221 7.01 $ 300,000 $ 499,999 105 170 12.86 99 167 12.25 97 172 12.13 $ 500,000 $ 999,999 13 183 17.33 13 195 17.33 12 166 14.40 $ 1,000,000 $ 1,999,999 1 45 No Sales 1 76 No Sales 1 106 No Sales $ 2,000,000 and up 0 0 0.00 0 0 0.00 0 0 0.00 ALL 230 199 8.79 227 202 8.93 231 197 8.86 Mundelein - 60 $ 0 $ 299,999 203 239 10.68 192 255 9.93 189 257 9.45 $ 300,000 $ 499,999 72 196 13.29 75 202 13.85 74 227 14.10 $ 500,000 $ 999,999 29 185 26.77 25 203 37.50 21 198 31.50 $ 1,000,000 $ 1,999,999 7 440 42.00 8 415 48.00 6 570 24.00 $ 2,000,000 and up 0 0 0.00 0 0 0.00 0 0 0.00 ALL 311 228 12.12 300 242 11.73 290 252 11.08 Data Source: MRED LLC (C) Copyright 2011, A.L. Wagner Appraisal Group, Inc. Midwest Real Estate Data, LLC (630) 416-6556 ~ www.WagnerAppraisal.com Page 15
- 16. as of August 1, 2011 as of September 1, 2011 as of October 1, 2011 # Actives DOM Months Supply # Actives DOM Months Supply # Actives DOM Months Supply Naperville - 540 $ 0 $ 299,999 193 183 6.87 178 192 6.30 166 199 5.60 $ 300,000 $ 499,999 366 178 6.64 330 193 6.25 292 210 5.64 $ 500,000 $ 999,999 297 266 11.88 277 286 11.54 274 295 11.54 $ 1,000,000 $ 1,999,999 59 413 22.84 58 405 25.78 60 373 30.00 $ 2,000,000 and up 11 357 132.00 11 381 66.00 11 411 66.00 ALL 926 224 8.35 854 240 7.94 803 252 7.48 New Lenox - 451 $ 0 $ 299,999 133 214 10.86 144 217 12.34 141 235 11.51 $ 300,000 $ 499,999 85 268 21.25 81 289 19.06 73 303 17.52 $ 500,000 $ 999,999 7 343 42.00 7 363 28.00 7 370 42.00 $ 1,000,000 $ 1,999,999 1 786 No Sales 1 817 No Sales 1 847 No Sales $ 2,000,000 and up 2 448 No Sales 2 479 No Sales 2 509 No Sales ALL 228 243 13.89 235 251 14.54 224 266 13.51 Niles - 648 $ 0 $ 299,999 64 206 5.95 64 215 5.77 66 208 5.82 $ 300,000 $ 499,999 48 199 19.86 49 203 21.78 43 176 19.85 $ 500,000 $ 999,999 15 313 16.36 15 321 16.36 16 331 19.20 1,000,000 1,999,999 $ 1 000 000 $ 1 999 999 0 0 0.00 0 00 0 0 0.00 0 00 0 0 0.00 0 00 $ 2,000,000 and up 0 0 0.00 0 0 0.00 0 0 0.00 ALL 127 216 9.02 128 223 8.98 125 213 8.72 North Aurora - 542 $ 0 $ 299,999 95 196 8.77 86 215 8.06 65 223 5.74 $ 300,000 $ 499,999 43 213 21.50 39 217 19.50 41 192 22.36 $ 500,000 $ 999,999 0 0 0.00 0 0 0.00 0 0 0.00 $ 1,000,000 $ 1,999,999 0 0 0.00 0 0 0.00 0 0 0.00 $ 2,000,000 and up 0 0 0.00 0 0 0.00 0 0 0.00 ALL 138 201 10.68 125 215 9.80 106 211 8.00 Northbrook - 62 $ 0 $ 299,999 34 352 4.58 28 361 3.73 28 339 3.78 $ 300,000 $ 499,999 70 234 7.50 67 259 6.99 71 274 7.34 $ 500,000 $ 999,999 84 226 7.00 83 218 6.82 85 220 7.34 $ 1,000,000 $ 1,999,999 31 340 14.88 32 306 18.29 29 340 16.57 $ 2,000,000 and up 9 357 108.00 7 154 84.00 6 179 72.00 ALL 228 268 7.37 217 260 6.98 219 267 7.18 Data Source: MRED LLC (C) Copyright 2011, A.L. Wagner Appraisal Group, Inc. Midwest Real Estate Data, LLC (630) 416-6556 ~ www.WagnerAppraisal.com Page 16
- 17. as of August 1, 2011 as of September 1, 2011 as of October 1, 2011 # Actives DOM Months Supply # Actives DOM Months Supply # Actives DOM Months Supply Northfield - 7193 $ 0 $ 299,999 5 233 6.67 5 240 6.67 8 224 10.67 $ 300,000 $ 499,999 12 240 9.60 10 134 10.00 11 127 13.20 $ 500,000 $ 999,999 29 297 14.50 30 280 15.65 25 307 13.64 $ 1,000,000 $ 1,999,999 13 183 22.29 12 192 20.57 16 198 27.43 $ 2,000,000 and up 4 449 12.00 2 262 6.00 2 292 6.00 ALL 63 267 12.81 59 233 12.87 62 235 14.31 Northlake - 164 $ 0 $ 299,999 68 217 7.35 65 233 6.61 72 239 7.58 $ 300,000 $ 499,999 2 816 No Sales 2 847 No Sales 1 1,178 No Sales $ 500,000 $ 999,999 0 0 0.00 0 0 0.00 0 0 0.00 $ 1,000,000 $ 1,999,999 0 0 0.00 0 0 0.00 0 0 0.00 $ 2,000,000 and up 0 0 0.00 0 0 0.00 0 0 0.00 ALL 70 234 7.57 67 251 6.81 73 252 7.68 Oak Brook - 523 $ 0 $ 499,999 8 272 10.67 12 223 16.00 11 282 13.20 $ 500,000 $ 999,999 46 282 16.73 49 294 19.60 49 292 21.00 $ 1,000,000 $ 1,999,999 47 324 29.68 48 335 30.32 42 326 24.00 2,000,000 2,999,999 $ 2 000 000 $ 2 999 999 22 503 88.00 88 00 24 527 96.00 96 00 24 501 72.00 72 00 $ 3,000,000 and up 9 513 54.00 9 483 54.00 7 663 28.00 ALL 132 349 24.00 142 353 27.05 133 359 24.18 Oak Brook Terrace - 181 $ 0 $ 299,999 7 120 10.50 3 104 4.00 4 187 6.00 $ 300,000 $ 499,999 3 135 No Sales 2 222 24.00 2 252 24.00 $ 500,000 $ 999,999 0 0 0.00 0 0 0.00 1 843 No Sales $ 1,000,000 $ 1,999,999 0 0 0.00 0 0 0.00 0 0 0.00 $ 2,000,000 and up 0 0 0.00 0 0 0.00 0 0 0.00 ALL 10 124 15.00 5 151 6.00 7 299 9.33 Oak Lawn - 453 $ 0 $ 299,999 253 205 8.98 239 195 8.17 239 195 8.12 $ 300,000 $ 499,999 20 258 10.91 19 250 12.00 20 243 16.00 $ 500,000 $ 999,999 4 280 No Sales 4 311 No Sales 3 349 No Sales $ 1,000,000 $ 1,999,999 0 0 0.00 0 0 0.00 0 0 0.00 $ 2,000,000 and up 0 0 0.00 0 0 0.00 0 0 0.00 ALL 277 210 9.23 262 200 8.50 262 200 8.54 Data Source: MRED LLC (C) Copyright 2011, A.L. Wagner Appraisal Group, Inc. Midwest Real Estate Data, LLC (630) 416-6556 ~ www.WagnerAppraisal.com Page 17
- 18. as of August 1, 2011 as of September 1, 2011 as of October 1, 2011 # Actives DOM Months Supply # Actives DOM Months Supply # Actives DOM Months Supply Oak Park - 302 $ 0 $ 299,999 48 227 5.05 55 216 5.79 52 210 5.33 $ 300,000 $ 499,999 58 193 4.38 69 155 5.45 69 152 5.52 $ 500,000 $ 999,999 55 140 9.04 48 154 8.00 54 113 9.13 $ 1,000,000 $ 1,999,999 5 549 10.00 8 370 32.00 7 451 42.00 $ 2,000,000 and up 0 0 0.00 0 0 0.00 0 0 0.00 ALL 166 196 5.66 180 183 6.33 182 169 6.42 Olympia Fields - 461 $ 0 $ 299,999 45 198 10.59 47 242 10.85 43 227 10.12 $ 300,000 $ 499,999 9 290 9.82 6 419 6.00 9 319 9.82 $ 500,000 $ 999,999 0 0 0.00 0 0 0.00 0 0 0.00 $ 1,000,000 $ 1,999,999 0 0 0.00 0 0 0.00 0 0 0.00 $ 2,000,000 and up 0 0 0.00 0 0 0.00 0 0 0.00 ALL 54 213 10.45 53 262 9.94 52 243 10.06 Orland Park - 462 $ 0 $ 299,999 96 175 6.62 100 194 6.63 91 160 5.78 $ 300,000 $ 499,999 128 220 14.63 123 225 14.06 122 237 14.35 $ 500,000 $ 999,999 76 224 24.65 74 239 26.12 69 272 22.38 1,000,000 1,999,999 $ 1 000 000 $ 1 999 999 15 278 30.00 30 00 15 312 36.00 36 00 15 342 36.00 36 00 $ 2,000,000 and up 4 453 No Sales 6 333 No Sales 7 314 No Sales ALL 319 213 11.89 318 225 11.74 304 229 10.95 Oswego - 543 $ 0 $ 299,999 198 314 7.38 192 307 7.13 188 319 7.01 $ 300,000 $ 499,999 52 255 13.00 54 231 12.96 55 221 13.47 $ 500,000 $ 999,999 12 331 48.00 13 337 52.00 11 400 44.00 $ 1,000,000 $ 1,999,999 2 206 12.00 2 237 12.00 3 186 18.00 $ 2,000,000 and up 0 0 0.00 0 0 0.00 1 23 No Sales ALL 264 302 8.45 261 292 8.29 258 299 8.23 Palatine - 67 $ 0 $ 299,999 111 201 8.07 113 195 7.62 108 201 6.86 $ 300,000 $ 499,999 96 198 10.19 102 196 11.33 94 203 10.16 $ 500,000 $ 999,999 81 265 22.09 83 278 23.16 78 300 21.77 $ 1,000,000 $ 1,999,999 1 34 No Sales 1 65 No Sales 1 95 No Sales $ 2,000,000 and up 0 0 0.00 0 0 0.00 0 0 0.00 ALL 289 218 10.77 299 218 10.91 281 229 9.83 Data Source: MRED LLC (C) Copyright 2011, A.L. Wagner Appraisal Group, Inc. Midwest Real Estate Data, LLC (630) 416-6556 ~ www.WagnerAppraisal.com Page 18
- 19. as of August 1, 2011 as of September 1, 2011 as of October 1, 2011 # Actives DOM Months Supply # Actives DOM Months Supply # Actives DOM Months Supply Palos Heights - 463 $ 0 $ 299,999 40 212 7.50 45 180 8.44 36 214 6.00 $ 300,000 $ 499,999 26 207 13.00 23 225 11.04 23 248 12.55 $ 500,000 $ 999,999 20 344 34.29 20 254 24.00 18 272 19.64 $ 1,000,000 $ 1,999,999 3 580 No Sales 1 736 No Sales 2 745 No Sales $ 2,000,000 and up 0 0 0.00 0 0 0.00 0 0 0.00 ALL 89 253 11.24 89 214 10.79 79 250 9.03 Palos Hills - 465 $ 0 $ 299,999 36 201 7.71 32 200 6.86 35 197 7.24 $ 300,000 $ 499,999 22 164 44.00 21 157 31.50 17 197 34.00 $ 500,000 $ 999,999 5 203 No Sales 3 302 No Sales 2 238 No Sales $ 1,000,000 $ 1,999,999 0 0 0.00 0 0 0.00 0 0 0.00 $ 2,000,000 and up 0 0 0.00 0 0 0.00 0 0 0.00 ALL 63 188 12.19 56 189 10.50 54 198 10.13 Palos Park - 464 $ 0 $ 299,999 10 480 9.23 11 457 10.15 11 502 11.00 $ 300,000 $ 499,999 31 216 18.60 28 267 15.27 27 288 16.20 $ 500,000 $ 999,999 23 272 39.43 20 299 48.00 23 277 55.20 1,000,000 1,999,999 $ 1 000 000 $ 1 999 999 10 484 60.00 60 00 11 469 44.00 44 00 12 459 48.00 48 00 $ 2,000,000 and up 7 774 No Sales 7 805 No Sales 6 894 No Sales ALL 81 346 23.14 77 380 21.49 79 387 23.70 Park Ridge - 68 $ 0 $ 299,999 56 212 6.65 56 222 6.52 54 195 6.06 $ 300,000 $ 499,999 104 215 8.67 102 226 8.05 107 227 8.18 $ 500,000 $ 999,999 56 344 7.81 58 341 8.70 53 376 7.66 $ 1,000,000 $ 1,999,999 18 285 21.60 18 313 24.00 17 348 18.55 $ 2,000,000 and up 5 176 No Sales 5 128 No Sales 5 158 No Sales ALL 239 249 8.41 239 257 8.34 236 260 7.91 Plainfield - 544 $ 0 $ 299,999 443 198 6.00 448 195 5.89 432 209 5.62 $ 300,000 $ 499,999 160 248 11.43 159 239 10.97 162 251 11.57 $ 500,000 $ 999,999 47 348 31.33 46 346 30.67 40 380 25.26 $ 1,000,000 $ 1,999,999 3 324 No Sales 3 355 No Sales 2 301 No Sales $ 2,000,000 and up 1 245 No Sales 1 276 No Sales 1 306 No Sales ALL 654 222 7.32 657 217 7.14 637 231 6.89 Data Source: MRED LLC (C) Copyright 2011, A.L. Wagner Appraisal Group, Inc. Midwest Real Estate Data, LLC (630) 416-6556 ~ www.WagnerAppraisal.com Page 19