
Recommended
More Related Content
Similar to Autozone, Inc. .docx
Similar to Autozone, Inc. .docx (15)
More from celenarouzie
More from celenarouzie (20)
Recently uploaded
Recently uploaded (20)
Autozone, Inc. .docx
- 1. Autozone, Inc. 1 Autozone, Inc. 2 Case Study 30 BNFN 4304 – Financial Policy Instructor: Mr. Masood Aijazi Done by: Halah Bahanshal 1510635 Yusra Bashanfar 1410057 Yara Al-Feki 1410435 Hala Rajab 1310257 Due: 3rd of April, 2018 Introduction: 3 Question 1 4 Question 2 7 Question 3 11 Question 4 12 Question 5 15 Conclusion 17 References 18
- 2. Introduction: AutoZone first store opened in 1979 under the name Auto Shack in Forrest City, Arizona; while, in 1987 the name was changed to Autozone. Autozone implemented the first electronic auto parts catalog for the retail industry. After four years of steady growth, Autozone went public and it was listed in New York Stock Exchange in 1991. By 2012, AutoZone was one of the biggest leading company in retailing and distributing automotive parts and accessories in the United States with more than 65,000 employees and 4,813 stores located in every state contiguous United States, Mexico, Puerto Rico. In fact, AutoZone has performed well in terms of profitability and stock price appreciation over the previous 15 years. In specific, this case is about Mark Johnson, a portfolio manager of Johnson & Associates, who was reviewing his holdings, including his position in AutoZone. Johnson was concerned that Edward Lampert’s (a prominent shareholder who had begun liquidating his position in AutoZone) reduced position could lead the company to stop using share repurchases as a method of distributing cash flows to shareholders. In this case, students provide an overview of AutoZone’s stock price performed over the previous five years, and how does a stock repurchase work and its impact on EPS and ROIC as well. Moreover, the case lists a number of alternative uses for the free cash flows generated by Autozone if they decided to stop the repurchases program they are undertaking. At the end, recommendation is given to Mark Johnson about his holdings
- 3. of AutoZone shares and what should he do to deal with it.Question 1 How has AutoZone’s stock price performed over the previous five years? What other financial measures can you cite that are consistent with the stock price performance? Autozone shareholders had enjoyed strong price appreciation since 1997, with an average annual return of 11.5%. The stock price had dramatically increased in the previous five years reaching $348. In 2008, U.S. economy had gone through the worst recession since the great depression, and the recovery that followed had been unusually slow. Strong appreciation of stock price was a result of the recession of the U.S. economy because auto-part business was somewhat a counter cyclical industry. To illustrate more, the company’s growth and stock price are directly related and connected to the economy and to the number of miles driven by a car. When the economy struggled and unemployment was high, fewer new cars were purchased and older cars were kept on the road longer, requiring more frequent repairs. As a result the auto parts retail business enjoyed strong top line growth.By 2012, AutoZone had become the leading retailer of automotive replacement parts and accessories in the United States with more than 65,000 employees and 4,813 stores. As illustrated in Exhibit 1,the financial statements of Autozone reflect its stock price performance, net sales increased from $6,169,804 to $8,072,973 from 2007 till 2011 which is equal a 30.85% increase. Moreover, cost of sales also increased from $3,105,554 until $3,953,510 in the same period which is equal a 27.430% increase. The increase in cost of sales is lower than the increase in net sales which results in an increase in gross profit from $3,064,250 till $4,119,463 in the previous five years which is equal to 34.4%. Furthermore, Autozone’s operating profit increased by 41.65% ,where it was $1,055,266 in 2007 reaching to $1,494,803 in 2011 indicating the efficiency and the profitability of the company. EPS is strongly related and is a key driver of the stock price for Autozone company. Where
- 4. basic EPS increase by 130.97% from 2007 till 2011, and the diluted EPS increase by 128.25% through the same period. AutoZone Income Statements (in thousands, except per share) August 27, 2011 August 28, 2010 August 29, 2009 August 30, 2008 August 25, 2007 % change Net sales $8,072,973 $7,362,618 $6,816,824 $6,522,706 $6,169,804 30.85% Cost of sales 3,953,510 3,650,874 3,400,375 3,254,645 3,105,554 27.30% Gross profit 4,119,463 3,711,744 3,416,449 3,268,061
- 5. 3,064,250 34.44% Operating profit 1,494,803 1,319,414 1,176,062 1,124,134 1,055,266 41.65% Net income $848,974 $738,311 $657,049 $641,606 $595,672 42.52% Wt. avg. shares for basic EPS 42,632 48,488 55,282 63,295 69,101 -38.30% Effect of dilutive stock equivalents 971 816 710 580 743 30.69% Adj. wt. avg. shares for diluted EPS 43,603 49,304 55,992 63,875 69,844
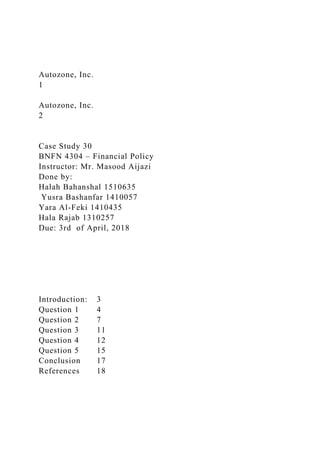
- 6. -37.57% Basic earnings per share $19.91 $15.23 $11.89 $10.14 $8.62 130.97% Diluted earnings per share $19.47 $14.97 $11.73 $10.04 $8.53 128.25% Additionally, Autozone's management also focused on after tax return on invested capital( ROIC) as the primary way to measure value creation for the company's capital providers. In 1998, Autozone had restrained capital to its equity investors through share repurchases which is funded through strong operating cash flow and debt issuance. Thus, resulting in reduction of the shares outstanding, which enhanced earning per share. Share outstanding reduction reached 39% from 2007 to 2011, and the shareholders’ equity reached negative 1.2 billion in 2011. The net result was that Autozone’s invested capital had remained fairly constant since 2007, which combined of both increased earning and create attractive ROIC level as shown in exhibit 9 in the case. These two reasons result in the stock price increasing in the previous five years. Autozone cash flow statement in Exhibit 4 shows that net cash provided by operating activities was $1,291,538 in 2011 and the debt is $500,000, showing that the purchases of treasury stock totaling $1,466,802 in 2001 was heavily funded by the free cash flow and by debt as well.
- 7. August 27, 2011 August 28, 2010 August 29, 2009 August 30, 2008 August 25, 2007 Net cash provided by operating activities 1,291,538 1,196,252 923,808 921,100 845,194 Net cash used in investing activities (318,994) (307,447) (263,722) (243,150) (228,715) Cash flows from financing activities: Proceeds from issuance of debt 500,000 - 500,000 750,000 - Purchase of treasury stock (1,466,802) (1,123,655) (1,300,002) (849,196) (761,887) Question 2
- 8. How does a stock repurchase work? Why would a company use this tactic? What impact does it have on: EPS? ROIC? When we talk about free cash flow in a company, the first decision they have to take is whether to retain the cash flow or distribute it to the firm’s capital providers as a return to their investment. If the firm chooses to retain cash flow, it will invest in new projects or add to the cash reserves. If the firm chooses to distribute cash flow, it can do so by repurchasing shares or paying dividends. The way a firm chooses between alternatives ways to pay out cash to shareholders is called Payout policy. A share repurchase, also known as share buyback, is “the transaction in which the stock issuer buys back its shares from investors”. Once Shares are repurchased, these shares are generally held in the corporate treasury and become treasury shares (or treasury stock). The Accounting transaction that is done to record it is that the dollar amount of the stocks repurchased is debited to the Treasury Stock account and cash is credited. The account of Treasury Stock cannot be considered as an asset/investment, because stocks purchased are from the company’s own shares. Treasury Stock account is a contra- stockholders equity account and it is mainly found in the Balance sheet, specifically stockholders equity section, as a negative item. So what are the motives and reasons behind repurchasing shares, · Management signaling that stock is undervalued. Some companies use buybacks for signaling to the market, in general, that their shares are undervalued. This is possibly because inside information is more positive than the public’s perception about the company’s strength. A large volume of stock buyback in a given time signals that a wide number of stocks in this specific market are undervalued. · Attaining an advantage of income tax When a company decide to distribute its cash flow and thus returning part of their cash to shareholders, the option of Share repurchases offer a tax advantage over dividends. In fact, when
- 9. shareholders receive cash dividends, dividends are treated as ordinary income and the receipts are taxed at the current personal income tax rate in the same year dividends are received. On the other side, when companies buy back their own shares, any capital gains created for the shareholders are not taxed until the gains are realized; also, capital gains are taxed at a much lower rate. · Offset share increases from executive stock options. · Maintain the optimal capital structure One other reason behind stock buybacks comprises the companies’ efforts to maintain the looked-for capital structure. The existence of an optimal capital is believed by many finance experts, which is the correct mix of debt and equity financing that is most advantageous and beneficial for a company. Hence, companies usually use purchasing of treasury stock to alter and maintain such optimum balance of debt and equity levels. · Flexibility The share buyback is more flexible in nature than payment of dividends. Cash dividends need to be paid immediately, however, the share repurchase program is conducted over extended period of time. Also, the company is under no compulsion to conduct the repurchase program; It can cancel it or modify it according to the company needs. However, a company will never want to stop or cancel dividends payment. Earnings per Share (EPS) The most common and also the most important accounting item of measurement for valuing a company is its Earnings per Share (EPS). EPS is figured by dividing the total earnings of a specific period by the number of shares outstanding (stock). For the same level of earnings, if the number of outstanding shares is reduced through stock buyback, the company’s EPS is spontaneously increased without any corresponding increase in total earnings. High EPS companies are regarded as a more favorable option than companies with lower EPS. Therefore, by purchasing shares back, EPS increases and stock prices would probably be on the rise.
- 10. Return on Invested capital (ROIC) Return on Invested capital, one of the best metrics to evaluate corporates performance, is also affected by Share repurchases. Return on Invested capital, one of the best metrics to evaluate corporates performance, is also affected by Share repurchases. When ROIC is calculated non-economic accounting issues and financial leverage impacts are removed. AutoZone’s management management focused on after-tax return on invested capital (ROIC) as primary way to measure value creation for the company's capital providers. As a result, while Autozone management invested in opportunities that led to top line result revenue growth and increased margins, it also focused on capital stewardship. What resulted was an aggressively managed working capital at the store level through the efficient use of inventory as well as attractive terms from suppliers in 1998. On the balance sheet, a share repurchase will reduce a company’s cash holdings, and thus reduce the total assets and total shareholders’ equity. This is clearly shown in the case of Autozone where there was a significant reduction of both the shares outstanding and equity capital. In particular, shares outstanding had dropped 39% from 2007 to 2011, and shareholders equity had been reduced to a negative $1.2 billion in 2011. Based on exhibit 9, which shows the relation between share repurchased and ROIC, ROIC improve subsequent to a share repurchase. The chart also shows the strong increase of ROIC after an extensive repurchase program is undergone by Autozone. Together with share repurchase program, the obvious increase in growth of Autozone when the economy recession occurred had a large impact on creating a desirable ROIC. At the end, AutoZone’s ROIC is clearly demonstrating that the company is proposing strong returns for its investors. Question 3 How much of AutoZone’s stock price performance should we attribute to the share repurchase program? The increase in the company’s stock price is somehow
- 11. directly associated the company repurchase programs. Due to the fact that a company’s repurchase program can result to the following: · An increase in the price of the stock. · Created a strong earning per share (EPS) · The reduction in the number of shares outstanding The company’s earnings per share is absorbed by investors in order to measure the company’s performance. Furthermore, the company has a total of 43,603 shares outstanding in 2011 compared to 69,844 shares outstanding in 2007 which shows a reduction in number of shares. This reduction in shares outstanding resulted to an increase in diluted earnings per share by 128% through previous five years. Increasing diluted earnings per share from an $8.53 per share in 2007 to $19.47 per share in 2011. Moreover, the AutoZone’s stock price has shown an increase in the same time period from $120 to $298. Thus, the increase of shares outstanding will result to lower the price of the stocks on the other hand, the decrease of price of stocks will result to an increase in number of shares outstanding. However, the stock price performance of Autozone company was linked greatly to the good performance. Net Income Adj. wt. avg. shares for diluted EPS Stock price EPS before share repurchase EPS after share repurchase EPS differences P/E Ratio Stock Price contributed by Share Repurchase Aug.25,2007 $595,672 69844
- 13. 297.96 $17.22 $19.47 $2.25 15.3 34.45 Question 4 Assume that AutoZone is planning to stop its share repurchase program. What would be the best alternative use of those cash flows? Why? If AutoZone decided to stop its share repurchase program, the company could use its cash flows in several ways. These alternatives include distributing their cash flows through dividends, increasing the number of stores, acquiring other auto-parts retail stores, or retire some of the accumulated debt that the company has made over the years. After carefully looking at the alternatives, expanding the business using the company’s operational cash flows is considered a good alternative, which could be done in one of two ways; either by initiating new stores (both domestically and nationally) or by acquiring other existing auto-parts retail stores. This expansion or growth is essential for AutoZone in order to maintain the company’s position as the leading auto- parts retailer in the United States and bar its competitors from gaining a foothold in those new markets. AutoZone Inc. already owns several stores abroad (outside the United States), in Puerto Rico as well as Mexico. However, AutoZone’s management must bear in mind the risk associated with such expansion. There is no assurance that the expansion would bring along the same returns that AutoZone is currently witnessing. Since 1998, AutoZone was able to acquire almost 800 stores from its rivals. Therefore, AutoZone is well-aware of using its operational cash flows in acquiring its rivals’ existing stores as an alternative to the share repurchasing program. These stores would be considered a good investment as it would mean that
- 14. these stores would become productive and functional faster than initiating new stores (due to the fact that they are already built and available). However, there are a few drawbacks to this strategy as well. The auto-parts market is considered an oversaturated or mature market which means that there are a few competitors to be acquired in the market (fewer targets for acquisition). Moreover, this also indicates that the acquisition action could be blocked by the U.S. Department of Justice (as it would be considered a potential act of monopoly). Hence, we suggest that AutoZone should not consider using its operational cash flows to grow its business because: · The auto-part retail market is already mature/oversaturated · Fewer locations are available for expansion (domestically) · Overseas expansion is considered risky and uncertain · Acquisition of a higher proportion of the market would be difficult without violating antitrust policy Moreover, Autozone could use part or all of its operating cash flows to retire some of the debts that the company had accumulated over the years, where much of the debt had been used to fund the share repurchase. However, with a negative book- equity position and a such a large debt position, it is recommended that Autozone could at least use part of its cash flow to repay debt. This is because of two reasons: the first one is that if Autozone ran into trouble, it could struggle under the strain of making interest payments and rolling over maturing debt. Another point is that Autozone was conceivable to lose its investment grade, which would make future debt financing more difficult to secure and more expensive. Autozone could also distribute its operating cash flows to shareholders through dividends, the company have the choice of distributing the cash through dividend or share repurchases, or some combination of the two. Dividends were seen a way to provide cash to existing shareholders, whereas only those who happened to be selling their shares would receive cash from a share-repurchase program. On the other hand, dividends were taxed at the shareholder level in the year received, whereas if a
- 15. share-repurchase program succeeded in increasing the share price, the non-selling shareholders could defer paying taxes until they sell the stock. Dividends were also generally considered to be sticky, meaning that the market expected a company to either keep its dividend steady or raise it each year. However, share repurchases were not viewed as sticky by the market because the amount of share repurchase vary every year. Autozone can chose to return shareholder capital through both dividends and share repurchases as some companies do. In most of these cases, the company provided a stable but relatively small cash dividend and then repurchased shares at varying levels according to the circumstances each year. The benefit of this approach was to give shareholders the benefit of a sticky dividend while also receiving the price support of share repurchases. In conclusion, Autozone should make its mind up to benefit from all these alternative and implement one or more of these alternatives according to the company’s need.Question 5 What should Mark Johnson do about his holdings of AutoZone shares? Mark Johnson has three options on Autozone Shares holdings either sell, buy or hold Autozon’s shares. Each of these options have advantages and disadvantages which are discussed below: If Mark Johnson sells his holdings, he will be given a chance of getting a higher return before economy growth and became strong because if the economy became strong, the value of Autozone shares would decline which will reduce Mark Johnson return. Buying Autozone shares have a positive side in case the stock price and the value increase; however, if the stock price and value decline, it will be a loss for him, and it will be also the same case if he hold Autozone shares. Additionally, if Autozone decided to stop share repurchase, they would have excess cash flow that could be used for expansion, producing new product, or retiring some of their debt. Utilizing this cash very well may affect Autozone positively; however,
- 16. the stock price and EPS might slightly decrease if the company were able to handle its operations. On the other hand, if the company could not handle its operation very well, the stock price and EPS might drop which will disappoint its investors. Johnson is one of the largest holdings in Autozone company shares, where Johnson was concerned about the news that Lampert, Autozone’s main shareholder, was rapidly liquidating his stake in the company (Autozone). In addition, Johnson was concerned about the future performance of Autozone’s stock price because he did not know what is the reason behind Lampert liquidating his stake as it might have a negative effect among Autozones’ investors. However, it is not necessary that Lampert liquidating his stake is a bad sign, he might liquidate his Autozones’ stake because he is in need of fund for any other personal causes, or for better investment chances as he is might be a financial buyer seeking a greater return, so we believe that Johnson should remain holdings shares in Autozone. Financial measures of Autozones’ company show that the company is steadily improving, where EPS, ROIC, and stock price which is the most important measures for investors; are at a desirable rate of increasing. As Autozones’ investors had been enjoying the strong appreciation of Autozone’s stock prices, we believe they will continue enjoying this strong appreciation in the future. In fact, Autozones’ financial statement has no sign of a decrease in its shares stock price, where the company created a measured value since long time, we believe that it will continue doing in the future. Autozone faced bad debt ratio which affect the financial security index and the complex of increase capital in debt to develop or the company will forced to pay higher cost of capital. Additionally, Autozone maintaining policy of using debt is not efficient to repurchase its stock due to its high debt ratio. If Autozone do not have enough capital to maintain such policy, the stock prices would highly dropped. While the policy of repurchasing shares by debt would create demand on securities market, where the company stock price will be higher
- 17. than instinct value. Our recommendation to Mark Johnson to hold Autozone share as U.S. suffer a recession and recover from recession need many years to improve its economy. Consequently, as U.S did reach the economy improving, Mark Johnson will enjoy high stock price, high value of Autozone stock resulted in high ESP. Conclusion Post analyzing all potential alternatives to managing their operational cash flows, we strongly believe that AutoZone should not consider stopping its share repurchasing program and continue with it. By implementing their share repurchase program/strategy, AutoZone was able to progressively improve the price of their shares (as the market views their share repurchases as indirect dividends). Any alteration away from the company’s repurchasing program could be considered a negative signal by the market, therefore, resulting in the investors’ loss of confidence in the company. Likewise, if AutoZone happens and decides to change their strategy and instead issue dividends, they will have to keep it constant or increment the dividends amount in order to keep the investors satisfied at all times. Over the years, AutoZone has been able to demonstrate progressively incremental and an enhanced its ROIC. As per the other alternatives for using the company’s operating cash flows, the undesirable facets as well as the risks linked with the expansion plans, whether domestically or nationally, would probably result in a decrement in the company’s value. Consequently, foreseeing a sustained upsurge in the price of AutoZone’s shares, Johnson & Associates ought to retain its position and sturdily deliberate on growing its venture inside the company itself. References Berk, J.,DeMarzo, P., Harford, J. (2015). Fundamentals of
- 18. Corporate Finance (3rd ed.). Pearson, pp. 290-291 Bruner, R., Eades, K., & Schill, M. (2014). Case Studies in Finance: Managing for Corporate Value Creation (7th ed.). NY:New York, pp. 409- 422. CFA Institution. (n.d) Chapter 6 : Dividends and Share repurchases: Basics Yallapragada, R. (2014). Stock Buybacks: Good Or Bad For Investors?. Retrieved from file:///C:/Users/sarah/Downloads/8535-Article%20Text-33867- 1-10-20140329.pdf Title PageThis spreadsheet supports STUDENT analysis of the case “AutoZone, Inc.” (Case 30).This spreadsheet was prepared by Professor Kenneth Eades, Paul Tudor Jones Research Professor of Business Administration. Copyright © 2012 by the University of Virginia Darden School Foundation, Charlottesville, VA. All rights reserved. For customer service inquiries, send an e-mail [email protected] No part of this publication may be reproduced, stored in a retrieval system, posted to the Internet, or transmitted in any form or by any means—electronic, mechanical, photocopying, recording, or otherwise—without the permission of the Darden School Foundation. Rev. Jan. 18, 2013 Ex1_Price Performance3/29/026/28/029/30/0212/31/023/31/036/30/039/30/ 0312/31/033/31/046/30/049/30/0412/31/043/31/056/30/059/30/0 512/30/053/31/066/30/069/29/0612/29/063/30/076/29/079/28/07 12/31/073/31/086/30/089/30/0812/31/083/31/096/30/099/30/091 2/31/093/31/106/30/109/30/1012/31/103/31/116/30/119/30/111/ 24/12RBS25.525.525.525.525.525.519.919.919.919.920.621.321 .321.321.3222222222222222222.922.922.922.923.323.420.920.
- 19. 219.319.313.512.511.210.69.69.22.3ESL0000000000000000000 00000000000000.94.443.53.53.131.5Total (mm)25.525.525.525.525.525.519.919.919.919.920.621.321.321 .321.3222222222222222222.922.922.922.923.323.420.920.219. 320.217.916.514.714.112.712.23.8Value$1,755.68$1,971.15$2,0 10.93$1,801.58$1,752.11$1,937.24$1,781.65$1,695.68$1,710.8 0$1,593.99$1,591.35$1,944.90$1,825.41$1,969.40$1,773.23$2, 018.50$2,193.18$1,940.40$2,272.60$2,542.32$2,819.08$3,005. 64$2,555.08$2,745.94$2,606.71$2,771.13$2,824.49$3,249.65$3 ,805.31$3,158.20$2,953.64$3,050.75$3,496.42$3,458.64$3,777. 02$4,007.07$3,857.20$3,744.60$3,894.12$1,317.65BB Last Pr68.8577.378.8670.6568.7175.9789.5385.2185.9780.177.2591. 3185.792.4683.2591.7599.6988.2103.3115.56128.14136.62116. 14119.91113.83121.01123.34139.47162.62151.11146.22158.071 73.09193.22228.91272.59273.56294.85319.19346.75Indexed to Time 0Absolute NumbersDateAutoZoneS&P 500S&P 500AZOSPXSPXT12/31/96100.0%100.0%100.0%27.5740.7497 3.91/31/9778.6%106.1%106.2%21.625786.161034.742/28/9790. 0%106.8%107.1%24.75790.821042.853/31/9781.8%102.2%102. 7%22.5757.1210004/30/9789.1%108.2%108.8%24.5801.341059. 75/30/9785.0%114.5%115.4%23.375848.281124.226/30/9785.0 %119.5%120.6%23.375885.141174.597/31/97104.3%128.8%130 .2%28.688954.291268.058/29/97102.7%121.4%122.9%28.25899 .471197.019/30/97108.6%127.9%129.6%29.875947.281262.561 0/31/97107.5%123.5%125.3%29.563914.621220.411/28/97109. 1%129.0%131.1%30955.41276.8912/31/97105.5%131.0%133.4 %29970.431298.821/30/9899.8%132.3%134.8%27.438980.2813 13.192/27/98110.0%141.7%144.6%30.251049.341407.93/31/98 123.2%148.7%152.0%33.8751101.7514804/30/98109.8%150.1% 153.5%30.1881111.751494.895/29/98120.9%147.3%150.9%33.2 51090.821469.196/30/98116.1%153.1%157.0%31.9381133.8415 28.877/31/98124.5%151.3%155.3%34.251120.671512.598/31/9 894.3%129.2%132.9%25.938957.281293.99/30/9889.5%137.3% 141.4%24.6251017.011376.7910/30/9895.7%148.3%152.9%26.3 131098.671488.7811/30/98109.5%157.1%162.1%30.1251163.63 1579.0212/31/98119.8%165.9%171.5%32.9381229.231670.011/
- 22. 76.661950.998/31/06328.4%176.0%205.1%90.31303.821997.42 9/29/06375.6%180.3%210.4%103.31335.852048.8910/31/06407 .3%186.0%217.2%1121377.942115.6511/30/06413.1%189.1%22 1.4%113.611400.632155.8912/29/06420.2%191.5%224.5%115.5 61418.32186.13AutoZoneS&P 500S&P 500 Total Return1/31/07456.8%194.2%227.9%125.631438.242219.19100 %100%100%2/28/07456.2%189.9%223.4%125.461406.822175. 78100%98%98%3/30/07466.0%191.8%225.9%128.141420.8622 00.12102%99%99%4/30/07483.8%200.1%235.9%133.041482.3 72297.57106%103%104%5/31/07467.7%206.6%244.1%128.631 530.622377.75102%106%107%6/29/07496.8%203.0%240.1%13 6.621503.352338.25109%105%105%7/31/07461.1%196.5%232. 6%126.811455.272265.75101%101%102%8/31/07441.1%199.0 %236.1%121.291473.992299.7197%102%104%9/28/07422.3%2 06.1%245.0%116.141526.752385.7292%106%108%10/31/07452 .4%209.2%248.9%124.411549.382423.6799%108%109%11/30/ 07405.9%200.0%238.5%111.631481.142322.3489%103%105%1 2/31/07436.0%198.2%236.8%119.911468.362306.2395%102%1 04%1/31/08438.7%186.1%222.6%120.651378.552167.996%96 %98%2/29/08418.5%179.6%215.4%115.081330.632097.4892% 93%95%3/31/08413.9%178.6%214.4%113.831322.72088.4291 %92%94%4/30/08439.1%187.1%224.9%120.751385.592190.13 96%96%99%5/30/08460.2%189.1%227.8%126.561400.382218. 5101%97%100%6/30/08440.0%172.8%208.6%121.0112802031. 4796%89%92%7/31/08473.8%171.1%206.8%130.291267.38201 4.39104%88%91%8/29/08499.0%173.2%209.8%137.231282.83 2043.53109%89%92%9/30/08448.5%157.5%191.1%123.341166 .361861.4498%81%84%10/31/08462.9%130.8%159.0%127.299 68.751548.81101%67%70%11/28/08397.2%121.0%147.6%109. 22896.241437.6887%62%65%12/31/08507.2%121.9%149.2%13 9.47903.251452.98111%63%65%1/30/09483.2%111.5%136.6% 132.89825.881330.51106%57%60%2/27/09517.2%99.2%122.1 %142.23735.091188.84113%51%54%3/31/09591.3%107.7%132 .8%162.62797.871292.98129%55%58%4/30/09605.1%117.8%1 45.5%166.39872.811416.73132%61%64%5/29/09553.3%124.1 %153.6%152.15919.141495.97121%64%67%6/30/09549.5%124
- 24. 35580 35611 35642 35671 35703 35734 35762 35795 35825 35853 35885 35915 35944 35976 36007 36038 36068 36098 36129 36160 36189 36217 36250 36280 36311 36341 36371 36403 36433 36462 36494 36525 36556 36585 36616 36644 36677 36707 36738 36769 36798 36830 36860 36889 36922 36950 36980 37011 37042 37071 37103 37134 37162 37195 37225 37256 37287 37315 37344 37376 37407 37435 37468 37498 37529 37560 37589 37621 37652 37680 37711 37741 37771 37802 37833 37862 37894 37925 37953 37986 38016 38044 38077 38107 38138 38168 38198 38230 38260 38289 38321 38352 38383 38411 38442 38471 38503 38533 38562 38595 38625 38656 38686 38716 38748 38776 38807 38835 38868 38898 38929 38960 38989 39021 39051 39080 39113 39141 39171 39202 39233 39262 39294 39325 39353 39386 39416 39447 39478 39507 39538 39568 39598 39629 39660 39689 39721 39752 39780 39813 39843 39871 39903 39933 39962 39994 40025 40056 40086 40116 40147 40178 40207 40235 40268 40298 40329 40359 40389 40421 40451 40480 40512 40543 40574 40602 40633 40662 40694 40724 40753 40786 40816 40847 40877 40907 40939 1 0.78636363636363638 0.9 0.81818181818181823 0.89090909090909087 0.85 0.85 1.0431999999999999 1.0272727272727273 1.0863636363636364 1.0750181818181819 1.0909090909090908 1.0545454545454545 0.99774545454545449 1.1000000000000001 1.2318181818181819 1.0977454545454546
- 25. 1.209090909090909 1.1613818181818181 1.2454545454545454 0.94319999999999993 0.8954545454545455 0.9568363636363636 1.0954545454545455 1.1977454545454547 1.2318181818181819 1.2727272727272727 1.1045454545454545 1.0909090909090908 1.0522909090909089 1.0954545454545455 0.89774545454545451 0.86592727272727266 1.0204727272727272 0.96592727272727263 1.0022909090909091 1.175018181818182 0.95454545454545459 0.87272727272727268 1.009090909090909 0.83410909090909091 1.0181818181818181 0.80058181818181817 0.83181818181818179 0.81890909090909092 0.82501818181818176 0.97501818181818178 0.93865454545454541 1.0363636363636364 0.94654545454545458 0.91854545454545455 1.018909090909091 1.1396363636363636 1.2025454545454546 1.3636363636363635 1.721090909090909 1.6800000000000002 1.8858181818181818 2.1283636363636362 2.4472727272727273 2.6109090909090908 2.4600000000000004 2.4130909090909092 2.5036363636363634 2.7636363636363637 2.9763636363636361 2.810909090909091 2.6818181818181817 2.6309090909090909 2.8676363636363638 3.1189090909090909 2.9709090909090912 2.5690909090909093 2.3894545454545453 2.3927272727272726 2.4985454545454542 2.9385454545454546 3.0429090909090912 2.7625454545454544 3.0276363636363639 3.3381818181818179 3.2556363636363637 3.4945454545454542 3.4785454545454546 3.0985454545454543 3.0661818181818181 3.2618181818181817 3.1261818181818182 3.1843636363636363
- 26. 3.1545454545454548 2.9127272727272726 2.8072727272727276 2.693090909090909 2.8090909090909091 2.9749090909090912 3.1127272727272723 3.3203636363636364 3.2454545454545456 3.5236363636363639 3.1163636363636367 3.0181818181818181 3.2916363636363637 3.3621818181818179 3.5432727272727274 3.4363636363636365 3.0272727272727273 2.9418181818181819 3.2385454545454548 3.3363636363636364 3.5545454545454547 3.5156363636363639 3.6250909090909089 3.4039999999999999 3.2992727272727276 3.2072727272727275 3.1952727272727275 3.2836363636363637 3.7563636363636363 4.0727272727272723 4.1312727272727274 4.2021818181818187 4.5683636363636362 4.5621818181818181 4.6596363636363636 4.8378181818181814 4.6774545454545455 4.968 4.611272727272727 4.4105454545454545 4.2232727272727271 4.524 4.0592727272727274 4.360363636363636 4.3872727272727277 4.1847272727272724 4.1392727272727274 4.3909090909090907 4.6021818181818182 4.4003636363636369 4.7378181818181817 4.9901818181818181 4.4850909090909088 4.6287272727272732 3.9716363636363634 5.0716363636363635 4.8323636363636355 5.1719999999999997 5.9134545454545453 6.0505454545454542 5.5327272727272732 5.4949090909090916 5.5843636363636362 5.3545454545454545 5.3170909090909086 4.9203636363636365 5.3770909090909091 5.7479999999999993 5.6374545454545455 6.033818181818182 6.2941818181818183 6.7276363636363632 6.9410909090909092 7.0261818181818185
- 27. 7.6934545454545455 7.6283636363636367 8.3239999999999998 8.6410909090909094 9.4330909090909092 9.9123636363636347 9.2192727272727275 9.379999999999999 9.9476363636363629 10.268363636363636 10.690909090909091 10.721818181818183 10.379999999999999 11.163636363636364 11.60690909090909 11.76690909090909 11.941090909090908 11.81709090909091 12.650181818181817 S & P 500 35430 35461 35489 35520 35550 35580 35611 35642 35671 35703 35734 35762 35795 35825 35853 35885 35915 35944 35976 36007 36038 36068 36098 36129 36160 36189 36217 36250 36280 36311 36341 36371 36403 36433 36462 36494 36525 36556 36585 36616 36644 36677 36707 36738 36769 36798 36830 36860 36889 36922 36950 36980 37011 37042 37071 37103 37134 37162 37195 37225 37256 37287 37315 37344 37376 37407 37435 37468 37498 37529 37560 37589 37621 37652 37680 37711 37741 37771 37802 37833 37862 37894 37925 37953 37986 38016 38044 38077 38107 38138 38168 38198 38230 38260 38289 38321 38352 38383 38411 38442 38471 38503 38533 38562 38595 38625 38656 38686 38716 38748 38776 38807 38835 38868 38898 38929 38960 38989 39021 39051 39080 39113 39141 39171 39202 39233 39262 39294 39325 39353 39386 39416 39447 39478 39507 39538 39568 39598 39629 39660 39689 39721 39752 39780 39813 39843 39871 39903 39933 39962 39994 40025 40056 40086 40116 40147 40178
- 28. 40207 40235 40268 40298 40329 40359 40389 40421 40451 40480 40512 40543 40574 40602 40633 40662 40694 40724 40753 40786 40816 40847 40877 40907 40939 1 1.0624704795153508 1.0707978231851318 1.0267994660642776 1.088099394188315 1.1543484957387822 1.2060683848444398 1.3020330629428072 1.2290892288736011 1.2963959338741144 1.2531060683848445 1.3111099702228157 1.3336276825136051 1.3483827908409489 1.4456309682718966 1.519663209775131 1.5349522538248281 1.5085635075469761 1.569842899681692 1.5531266043741656 1.3285758291405689 1.4136872368826368 1.5286785090871753 1.6213368929048158 1.7147653763220043 1.7864667830372727 1.7309477359071774 1.8001950918985523 1.8699147756443166 1.825752130608892 1.9270767019201149 1.8669062532087484 1.8576753260088306 1.8067460724920423 1.9210801930382997 1.9601293767327241 2.0755724407023308 1.9712906869288427 1.9339767943320669 2.1231748639490711 2.0592976691652121 2.0170448711366671 2.0667727692781601 2.0344593900811172 2.1608276003696476 2.0467501796899064 2.0380942601909848 1.8774206797412467 1.8866002669678612 1.9535373241605913 1.7754081527877605 1.6629428072697403 1.7921655200739297 1.8041790738268815 1.7602628606633124 1.7429304856761476 1.6338227744121574 1.5018893110175584 1.5305267481260909 1.6479309990758806 1.6623677995687443 1.6381045281856452 1.6065201766095081 1.6669370571927304
- 29. 1.5658691857480234 1.5543382277441216 1.4436184413184106 1.3310812198377657 1.3398295512886333 1.1942088510113975 1.2993223123523976 1.3757983365848652 1.2949789506109457 1.261053496252182 1.2421295820926175 1.2541944758188726 1.3575007700995996 1.4290173529109766 1.4472533114282782 1.4727692781599753 1.5014888592257931 1.4855426635178151 1.5695861998151761 1.5833966526337406 1.6664339254543588 1.6970222815484137 1.7206078652839101 1.6946503747818051 1.6680460006160798 1.6909333607146524 1.7238217476126911 1.6667625012834995 1.6735085737755415 1.6916315843515761 1.7174761269124141 1.7869699147756444 1.8477769791559708 1.8027312865797311 1.8406715268508063 1.808080911797926 1.773785809631379 1.8302289762809325 1.832826778930075 1.9009857274874216 1.883643084505596 1.8988910565766506 1.8672348290378888 1.9378580963137899 1.9385357839613924 1.9898654892699457 1.9952664544614438 2.0201047335455389 2.047222507444296 1.988304754081528 1.9909949686826163 2.0032754902967449 2.0509497895061095 2.103799158024438 2.1723482903788893 2.2136667008933153 2.2447171167470996 2.2786631070951846 2.2340897422733343 2.2590820412773387 2.3591436492453024 2.4414724304343363 2.4009138515247974 2.3264708902351372 2.36134100010268 2.4496560221788681 2.4886230619160079 2.3845774720197146 2.368035732621419 2.2259985624807475 2.1536913440805012 2.1443885409179591
- 30. 2.2488243146113565 2.2779546154635999 2.0859123113255982 2.0683745764452204 2.0982955128863332 1.9113255981106891 1.5903172810350139 1.4762090563712909 1.4919190882020741 1.3661669575931821 1.2207002772358557 1.3276311736317898 1.4546976075572442 1.5360611972481775 1.5391107916623885 1.6555190471300956 1.7152890440496971 1.7792997227641441 1.7462470479515351 1.8509908614847521 1.8867440188931102 1.8188725741862615 1.8752130608892084 1.9883766300441525 2.0197658897217372 1.8584864975870212 1.761197248177431 1.8845877400143753 1.7995174042509499 1.9601088407434029 2.0346955539583118 2.0349522538248279 2.1709518431050414 2.2224047643495228 2.2985419447581892 2.2994557962829862 2.367553136872369 2.3407536708080912 2.3017352910976485 2.2549337714344388 2.1324365951329707 1.9825341410822466 2.1992093644111304 2.1943526029366462 2.2167984392648119 2.3161412876065306 Relative Cumulative Return Lampert Position in AutoZone Shares 37344 37435 37529 37621 37711 37802 37894 37986 38077 38168 38260 38352 38442 38533 38625 38716 38807 38898 38989 39080 39171 39262 39353 39447 39538 39629 39721 39813 39903 39994 40086 40178 40268 40359 40451 40543 40633 40724 40816 40932 25.5 25.5 25.5 25.5 25.5 25.5 19.899999999999999 19.899999999999999 19.899999999999999 19.899999999999999 20.6 21.3 21.3 21.3 21.3 22 22
- 31. 22 22 22 22 22 22 22.9 22.9 22.9 22.9 23.3 23.4 20.9 20.2 19.3 20.2 17.899999999999999 16.5 14.7 14.1 12.7 12.2 3.8 Shares Held (millions) AutoZone Stock Price Performance AutoZone 35430 35461 35489 35520 35550 35580 35611 35642 35671 35703 35734 35762 35795 35825 35853 35885 35915 35944 35976 36007 36038 36068 36098 36129 36160 36189 36217 36250 36280 36311 36341 36371 36403 36433 36462 36494 36525 36556 36585 36616 36644 36677 36707 36738 36769 36798 36830 36860 36889 36922 36950 36980 37011 37042 37071 37103 37134 37162 37195 37225 37256 37287 37315 37344 37376 37407 37435 37468 37498 37529 37560 37589 37621 37652 37680 37711 37741 37771 37802 37833 37862 37894 37925 37953 37986 38016 38044 38077 38107 38138 38168 38198 38230 38260 38289 38321 38352 38383 38411 38442 38471 38503 38533 38562 38595 38625 38656 38686 38716 38748 38776 38807 38835 38868 38898 38929 38960 38989 39021 39051 39080 39113 39141 39171 39202 39233 39262 39294 39325 39353 39386 39416 39447 39478 39507 39538 39568 39598 39629 39660 39689 39721 39752 39780 39813 39843 39871 39903 39933 39962 39994 40025 40056 40086 40116 40147 40178 40207 40235 40268 40298 40329 40359 40389 40421 40451 40480 40512 40543 40574 40602 40633 40662 40694 40724 40753 40786 40816 40847
- 32. 40877 40907 40939 1 0.78636363636363638 0.9 0.81818181818181823 0.89090909090909087 0.85 0.85 1.0431999999999999 1.0272727272727273 1.0863636363636364 1.0750181818181819 1.0909090909090908 1.0545454545454545 0.99774545454545449 1.1000000000000001 1.2318181818181819 1.0977454545454546 1.209090909090909 1.1613818181818181 1.2454545454545454 0.94319999999999993 0.8954545454545455 0.9568363636363636 1.0954545454545455 1.1977454545454547 1.2318181818181819 1.2727272727272727 1.1045454545454545 1.0909090909090908 1.0522909090909089 1.0954545454545455 0.89774545454545451 0.86592727272727266 1.0204727272727272 0.96592727272727263 1.0022909090909091 1.175018181818182 0.95454545454545459 0.87272727272727268 1.009090909090909 0.83410909090909091 1.0181818181818181 0.80058181818181817 0.83181818181818179 0.81890909090909092 0.82501818181818176 0.97501818181818178 0.93865454545454541 1.0363636363636364 0.94654545454545458 0.91854545454545455 1.018909090909091 1.1396363636363636 1.2025454545454546 1.3636363636363635 1.721090909090909 1.6800000000000002 1.8858181818181818 2.1283636363636362 2.4472727272727273 2.6109090909090908 2.4600000000000004 2.4130909090909092 2.5036363636363634 2.7636363636363637 2.9763636363636361 2.810909090909091 2.6818181818181817 2.6309090909090909 2.8676363636363638 3.1189090909090909 2.9709090909090912 2.5690909090909093 2.3894545454545453 2.3927272727272726
- 33. 2.4985454545454542 2.9385454545454546 3.0429090909090912 2.7625454545454544 3.0276363636363639 3.3381818181818179 3.2556363636363637 3.4945454545454542 3.4785454545454546 3.0985454545454543 3.0661818181818181 3.2618181818181817 3.1261818181818182 3.1843636363636363 3.1545454545454548 2.9127272727272726 2.8072727272727276 2.693090909090909 2.8090909090909091 2.9749090909090912 3.1127272727272723 3.3203636363636364 3.2454545454545456 3.5236363636363639 3.1163636363636367 3.0181818181818181 3.2916363636363637 3.3621818181818179 3.5432727272727274 3.4363636363636365 3.0272727272727273 2.9418181818181819 3.2385454545454548 3.3363636363636364 3.5545454545454547 3.5156363636363639 3.6250909090909089 3.4039999999999999 3.2992727272727276 3.2072727272727275 3.1952727272727275 3.2836363636363637 3.7563636363636363 4.0727272727272723 4.1312727272727274 4.2021818181818187 4.5683636363636362 4.5621818181818181 4.6596363636363636 4.8378181818181814 4.6774545454545455 4.968 4.611272727272727 4.4105454545454545 4.2232727272727271 4.524 4.0592727272727274 4.360363636363636 4.3872727272727277 4.1847272727272724 4.1392727272727274 4.3909090909090907 4.6021818181818182 4.4003636363636369 4.7378181818181817 4.9901818181818181 4.4850909090909088 4.6287272727272732 3.9716363636363634 5.0716363636363635 4.8323636363636355 5.1719999999999997 5.9134545454545453 6.0505454545454542
- 34. 5.5327272727272732 5.4949090909090916 5.5843636363636362 5.3545454545454545 5.3170909090909086 4.9203636363636365 5.3770909090909091 5.7479999999999993 5.6374545454545455 6.033818181818182 6.2941818181818183 6.7276363636363632 6.9410909090909092 7.0261818181818185 7.6934545454545455 7.6283636363636367 8.3239999999999998 8.6410909090909094 9.4330909090909092 9.9123636363636347 9.2192727272727275 9.379999999999999 9.9476363636363629 10.268363636363636 10.690909090909091 10.721818181818183 10.379999999999999 11.163636363636364 11.60690909090909 11.76690909090909 11.941090909090908 11.81709090909091 12.650181818181817 S & P 500 35430 35461 35489 35520 35550 35580 35611 35642 35671 35703 35734 35762 35795 35825 35853 35885 35915 35944 35976 36007 36038 36068 36098 36129 36160 36189 36217 36250 36280 36311 36341 36371 36403 36433 36462 36494 36525 36556 36585 36616 36644 36677 36707 36738 36769 36798 36830 36860 36889 36922 36950 36980 37011 37042 37071 37103 37134 37162 37195 37225 37256 37287 37315 37344 37376 37407 37435 37468 37498 37529 37560 37589 37621 37652 37680 37711 37741 37771 37802 37833 37862 37894 37925 37953 37986 38016 38044 38077 38107 38138 38168 38198 38230 38260 38289 38321 38352 38383 38411 38442 38471 38503 38533 38562 38595 38625 38656 38686 38716 38748 38776 38807 38835 38868 38898
- 35. 38929 38960 38989 39021 39051 39080 39113 39141 39171 39202 39233 39262 39294 39325 39353 39386 39416 39447 39478 39507 39538 39568 39598 39629 39660 39689 39721 39752 39780 39813 39843 39871 39903 39933 39962 39994 40025 40056 40086 40116 40147 40178 40207 40235 40268 40298 40329 40359 40389 40421 40451 40480 40512 40543 40574 40602 40633 40662 40694 40724 40753 40786 40816 40847 40877 40907 40939 1 1.0624704795153508 1.0707978231851318 1.0267994660642776 1.088099394188315 1.1543484957387822 1.2060683848444398 1.3020330629428072 1.2290892288736011 1.2963959338741144 1.2531060683848445 1.3111099702228157 1.3336276825136051 1.3483827908409489 1.4456309682718966 1.519663209775131 1.5349522538248281 1.5085635075469761 1.569842899681692 1.5531266043741656 1.3285758291405689 1.4136872368826368 1.5286785090871753 1.6213368929048158 1.7147653763220043 1.7864667830372727 1.7309477359071774 1.8001950918985523 1.8699147756443166 1.825752130608892 1.9270767019201149 1.8669062532087484 1.8576753260088306 1.8067460724920423 1.9210801930382997 1.9601293767327241 2.0755724407023308 1.9712906869288427 1.9339767943320669 2.1231748639490711 2.0592976691652121 2.0170448711366671 2.0667727692781601 2.0344593900811172 2.1608276003696476 2.0467501796899064 2.0380942601909848 1.8774206797412467 1.8866002669678612 1.9535373241605913
- 36. 1.7754081527877605 1.6629428072697403 1.7921655200739297 1.8041790738268815 1.7602628606633124 1.7429304856761476 1.6338227744121574 1.5018893110175584 1.5305267481260909 1.6479309990758806 1.6623677995687443 1.6381045281856452 1.6065201766095081 1.6669370571927304 1.5658691857480234 1.5543382277441216 1.4436184413184106 1.3310812198377657 1.3398295512886333 1.1942088510113975 1.2993223123523976 1.3757983365848652 1.2949789506109457 1.261053496252182 1.2421295820926175 1.2541944758188726 1.3575007700995996 1.4290173529109766 1.4472533114282782 1.4727692781599753 1.5014888592257931 1.4855426635178151 1.5695861998151761 1.5833966526337406 1.6664339254543588 1.6970222815484137 1.7206078652839101 1.6946503747818051 1.6680460006160798 1.6909333607146524 1.7238217476126911 1.6667625012834995 1.6735085737755415 1.6916315843515761 1.7174761269124141 1.7869699147756444 1.8477769791559708 1.8027312865797311 1.8406715268508063 1.808080911797926 1.773785809631379 1.8302289762809325 1.832826778930075 1.9009857274874216 1.883643084505596 1.8988910565766506 1.8672348290378888 1.9378580963137899 1.9385357839613924 1.9898654892699457 1.9952664544614438 2.0201047335455389 2.047222507444296 1.988304754081528 1.9909949686826163 2.0032754902967449 2.0509497895061095 2.103799158024438 2.1723482903788893 2.2136667008933153 2.2447171167470996 2.2786631070951846
- 37. 2.2340897422733343 2.2590820412773387 2.3591436492453024 2.4414724304343363 2.4009138515247974 2.3264708902351372 2.36134100010268 2.4496560221788681 2.4886230619160079 2.3845774720197146 2.368035732621419 2.2259985624807475 2.1536913440805012 2.1443885409179591 2.2488243146113565 2.2779546154635999 2.0859123113255982 2.0683745764452204 2.0982955128863332 1.9113255981106891 1.5903172810350139 1.4762090563712909 1.4919190882020741 1.3661669575931821 1.2207002772358557 1.3276311736317898 1.4546976075572442 1.5360611972481775 1.5391107916623885 1.6555190471300956 1.7152890440496971 1.7792997227641441 1.7462470479515351 1.8509908614847521 1.8867440188931102 1.8188725741862615 1.8752130608892084 1.9883766300441525 2.0197658897217372 1.8584864975870212 1.761197248177431 1.8845877400143753 1.7995174042509499 1.9601088407434029 2.0346955539583118 2.0349522538248279 2.1709518431050414 2.2224047643495228 2.2985419447581892 2.2994557962829862 2.367553136872369 2.3407536708080912 2.3017352910976485 2.2549337714344388 2.1324365951329707 1.9825341410822466 2.1992093644111304 2.1943526029366462 2.2167984392648119 2.3161412876065306 Relative Cumulative Return Lampert Position in AutoZone Shares 37344 37435 37529 37621 37711 37802 37894 37986 38077 38168 38260 38352 38442 38533 38625 38716 38807
- 38. 38898 38989 39080 39171 39262 39353 39447 39538 39629 39721 39813 39903 39994 40086 40178 40268 40359 40451 40543 40633 40724 40816 40932 25.5 25.5 25.5 25.5 25.5 25.5 19.899999999999999 19.899999999999999 19.899999999999999 19.899999999999999 20.6 21.3 21.3 21.3 21.3 22 22 22 22 22 22 22 22 22.9 22.9 22.9 22.9 23.3 23.4 20.9 20.2 19.3 20.2 17.899999999999999 16.5 14.7 14.1 12.7 12.2 3.8 Shares Held (millions) Ex2_Inc StatementsAutoZone Income StatementsYear endedYear endedYear ended(in thousands, except August 27,August 28,August 29,August 30,August 25,August 26,August 27,August 28,August 30,August 31,August 25,August 26,August 28,August 29,August 30,August 31,% change per share data)201120102009200820072006200520042003200220012000 1999199819971996Net sales$8,072,973$7,362,618$6,816,824$6,522,706$6,169,804$5, 948,355$5,710,882$5,637,025$5,457,123$5,325,510$4,818,185 $4,482,696$4,116,392$3,242,922$2,691,440$2,242,63330.85%C ost of sales3,953,5103,650,8743,400,3753,254,6453,105,5543,009,835 2,918,3342,880,4462,942,1142,950,1232,804,8962,602,3862,38 4,9701,889,8471,559,2961,307,63827.30%Gross profit4,119,4633,711,7443,416,4493,268,0613,064,2502,938,52 02,792,5482,756,5792,515,0092,375,3872,013,2891,880,3101,7 31,4221,353,0751,132,144934,99534.44%ERROR:#DIV/0!SG& A2,624,6602,392,3302,240,3872,143,9272,008,9841,928,5951,8 16,8841,757,8731,597,2121,604,3791,625,5981,368,2901,298,3 27970,768810,793666,06130.65%Operating profit1,494,8031,319,4141,176,0621,124,1341,055,2661,009,92 5975,664998,706917,797771,008387,691512,020433,095382,30 7321,351268,93441.65%ERROR:#DIV/0!Interest expense, net170,557158,909142,316116,745119,116107,889102,44392,80
- 39. 484,79079,860100,66576,83045,31218,2048,8431,96943.19%In come before income taxes1,324,2461,160,5051,033,7461,007,389936,150902,036873 ,221905,902833,007691,148287,026435,190387,783364,103312, 508266,96541.46%ERROR:#DIV/0!Income tax expense475,272422,194376,697365,783340,478332,761302,202 339,700315,403263,000111,500167,600143,000136,200117,500 99,80039.59%Net income$848,974$738,311$657,049$641,606$595,672$569,275$ 571,019$566,202$517,604$428,148$175,526$267,590$244,783$ 227,903$195,008$167,16542.52%Wt. avg. shares for basic EPS42,63248,48855,28263,29569,101-38.30%Effect of dilutive stock equivalents97181671058074330.69%Adj. wt. avg. shares for diluted EPS43,60349,30455,99263,87569,84475,85979,50886,35096,96 3107,111113,801133,869150,257154,070152,535151,238- 37.57%ERROR:#DIV/0!Basic earnings per share$19.91$15.23$11.89$10.14$8.62$7.57130.97%Diluted earnings per share$19.47$14.97$11.73$10.04$8.53$7.50$7.18$6.56$5.34$4.0 0$1.54$2.00$1.63$1.48$1.28$1.11128.25%Other information:EBIT$1,494,803$1,319,414$1,176,062$1,124,134$ 1,055,266$1,009,925$975,664$998,706$917,797$771,008$387,6 91$512,020$433,095$382,307$321,351$268,93441.65%Depr. & Amort.196,209192,084180,433169,509159,411139,465135,5971 06,891109,748118,255131,333126,800128,53196,59977,82163,5 4123.08%EBITDA$1,691,012$1,511,498$1,356,495$1,293,643$ 1,214,677$1,149,390$1,111,261$1,105,597$1,027,545$889,263 $519,024$638,820$561,626$478,906$399,172$332,47539.21%E RROR:#DIV/0!EBITDA/Interest9.9x9.5x9.5x11.1x10.2x- 2.77%Data source: AutoZone annual reports.EPS$19.47$14.97$11.73$10.04$8.53Net IncomeAdj. wt. avg. shares for diluted EPSStock price EPS before share repurchaseEPS after share repurchaseEPS diffrencesP/E RatioStock Price contributed by Share RepurchaseEPS diffrencesP/E RatioStock Price contributed by Share
- 40. RepurchaseAug.25,2007$ 595,67269844120.5N/A$ 8.53N/A14.13N/AN/A14.13N/AAug.30,2008$ 641,60663875138$ 9.19$ 10.04$ 0.8513.7511.73$ 0.8513.7511.73Aug.29,2009$ 675,04955992149.6$ 10.29$ 11.73$ 1.4412.7518.41$ 1.4412.7518.41Aug.28,2010$ 738,31149304211.66$ 13.19$ 14.97$ 1.7814.1425.22$ 1.7814.1425.22Aug.27,2011$ 848,97443603297.96$ 17.22$ 19.47$ 2.2515.334.45$ 2.2515.334.45 Ex3_Bal SheetsAutoZone Balance Sheet Statements ($ thousands)August 27,August 28,August 29,August 30,August 25,August 26,August 27,August 28,August 30,August 31,August 25,August 26,August 28,August 29,August 30,August 31,20112010200920082007200620052004200320022001200019 99199819971996AssetsCurrent assets:Cash and cash equivalents$97,606$98,280$92,706$242,461$86,654$91,558$74 ,810$76,852$93,102$6,498$7,286$6,969$5,918$6,631$4,668$3, 904Accounts receivable140,690125,802126,51471,24159,87680,363118,2636 8,37243,74623,78219,13521,40725,91742,25218,71315,466Mer chandise inventories2,466,1072,304,5792,207,4972,150,1092,007,4301,8 46,6501,663,8601,561,4791,511,3161,375,5841,242,8961,108,9 781,129,693966,560709,446555,894Other current assets88,02283,160135,013122,490116,495100,35672,52649,05 419,19411,69018,42630,21433,46839,68320,98719,225Deferred income taxes-------- 3,99632,57440,76819,21230,08861,96424,98818,608Total current assets2,792,4252,611,8212,561,7302,586,3012,270,4552,118,92 71,929,4591,755,7571,671,3541,450,1281,328,5111,186,7801,2 25,0841,117,090778,802613,097Property and equipment:Land740,276690,098656,516643,699625,992588,444 559,231538,920525,473502,302492,287458,217390,920320,203 243,587190,660Buildings and improvements2,177,4762,013,3011,900,6101,814,6681,720,172 1,566,0021,450,8141,370,0791,325,7591,228,6041,182,8801,14
- 41. 9,9001,003,308851,083682,710523,240Equipment994,369923,5 95887,521850,679780,199729,426662,495574,882551,465533,1 21505,282484,967438,855374,465267,536248,275Leasehold improvements275,299247,748219,606202,098183,601165,57715 0,846137,562125,592114,317116,639117,452102,64682,27345,6 6736,708Construction in progress184,452192,519145,161128,13385,581134,359155,2518 7,69444,87153,78675,223109,840153,323150,46197,41162,283 Gross property and equipment4,371,8724,067,2613,809,4143,639,2773,395,5453,18 3,8082,978,6372,709,1372,573,1602,432,1302,372,3112,320,37 62,089,0521,778,4851,336,9111,061,166Less: Accumulated depreciation and amortization1,702,9971,547,3151,455,0571,349,6211,217,7031, 132,5001,041,022919,048857,407770,402661,868561,936450,56 6350,979255,783198,292Net property and equipment2,668,8752,519,9462,354,3572,289,6562,177,8422,05 1,3081,937,6151,790,0891,715,7531,661,7281,710,4431,758,44 01,638,4861,427,5061,081,128862,874Goodwill302,645302,645 302,645302,645302,645302,645302,699301,015294,348305,390 305,390324,494337,261181,31516,57017,187Deferred income taxes10,66146,22359,06738,28321,33120,64332,917- 25,54360,30480,59352,18276,4123,5104,3392,938Other long- term assets94,99690,95940,60640,22732,43632,78342,56765,70459,8 282417,57511,3227,52418,6923,1782,301Total assets$5,869,602$5,571,594$5,318,405$5,257,112$4,804,709$4, 526,306$4,245,257$3,912,565$3,766,826$3,477,791$3,432,512 $3,333,218$3,284,767$2,748,113$1,884,017$1,498,397Liabiliti es and Stockholders’ DeficitCurrent liabilities:Accounts payable$2,755,853$2,433,050$2,118,746$2,043,271$1,870,668$ 1,699,667$1,539,776$1,429,128$1,360,482$1,145,533$945,666 $788,825$757,447$683,372$449,793$401,309Accrued expenses and other449,327432,368381,271327,664307,633280,419255,67224 3,816310,944344,600292,153227,682230,036176,457122,58010
- 42. 4,909Income taxes payable25,18525,38535,14511,58225,44224,3784,75372,09639, 97843,43828,83518,03713,071-20,07912,260Deferred income taxes166,449146,971171,590136,80382,15250,10410,9586,011- -------Short-term borrowings34,08226,186------------- 94,400Total current liabilities3,430,8963,063,9602,706,7522,519,3202,285,8952,054 ,5681,811,1591,751,0511,711,4041,533,5711,266,6541,034,544 1,000,554859,829592,452612,878Long-term debt3,317,6002,882,3002,726,9002,250,0001,935,6181,857,157 1,861,8501,869,2501,546,8451,194,5171,225,4021,249,937888, 340545,067198,400-Other long-term liabilities375,338364,099317,827258,105179,996145,053181,24 1120,870134,81960,57674,24356,55872,07241,16017,95719,937 Stockholders’ deficit:Common stock, par: $0.01/share4415015796367137728118941,0071,1001,1951,5431 ,5401,5301,5131,501Additional paid-in capital591,384557,955549,326537,005545,404500,880462,2894 14,231410,962370,457295,629301,901289,084277,528249,8532 35,247Retained earnings(643,998)(245,344)136,935206,099546,049559,208370, 276580,147869,739974,141825,1961,564,1181,296,5281,051,74 5823,842628,834Accumulated other comprehensive loss(119,691)(106,468)(92,035)(4,135)(9,550)(15,500)(36,581)( 15,653)(37,297)(11,603)(7,219)(4,468)(3)---Treasury stock, at cost(1,082,368)(945,409)(1,027,879)(509,918)(679,416)(575,83 2)(405,788)(808,226)(870,653)(644,968)(248,588)(870,915)(26 3,348)(28,746)--Total stockholders’ equity(1,254,232)(738,765)(433,074)229,687403,200469,52839 1,007171,393373,758689,127866,213992,1791,323,8011,302,05 71,075,208865,582Total liabilities and stockholders’ equity$5,869,602$5,571,594$5,318,405$5,257,112$4,804,709$4 ,526,306$4,245,257$3,912,565$3,766,826$3,477,791$3,432,512 $3,333,218$3,284,767$2,748,113$1,884,017$1,498,397Shares issued44,08450,06157,88163,60071,25077,24081,11189,393100 ,670109,962119,518154,328153,963153,039151,313150,137Sha
- 43. res outstanding40,10945,10750,80159,60865,96071,08276,53979,62 888,70899,268109,408121,510144,353152,086151,313150,137O ther information:Capital lease obligations86,65688,28054,76464,06155,088-----------Data source: AutoZone annual reports. Ex4_Cash FlowsAutoZone Cash Flow Statements ($ thousands)Year endedYear endedYear endedAugust 27,August 28,August 29,August 30,August 25,August 26,August 27,August 28,August 30,August 31,August 25,August 26,August 28,August 29,August 30,August 31,20112010200920082007200620052004200320022001200019 99199819971996Cash flows from operating activities:Net income$848,974$738,311$657,049$641,606$595,672$569,275$ 571,019$566,202$517,604$428,148$175,526$267,590$244,783$ 227,903$195,008$167,165Adjustments to reconcile net income tonet cash provided by operating activities:Depreciation and amortization of property and equipment196,209192,084180,433169,509159,411139,465135,5 97106,891109,748118,255131,333126,800128,53196,59977,821 63,541Amortization of debt origination fees8,9626,4953,6441,8371,7191,5592,3434,2307,3342,283----- -Income tax benefit from exercise of stock options(34,945)(22,251)(8,407)(10,142)(16,523)(10,608)31,828 24,33937,40242,15913,4954,0504,30016,200--Deferred income taxes44,667(9,023)46,31867,47424,84436,306(16,628)44,49865, 70128,483(46,981)39,33842,92920,241(7,781)6,082Share-based compensation expense26,62519,12019,13518,38818,46217,370-- --------Other------19,791(42,094)(8,695)-156,822-----Changes in operating assets and liabilities:Accounts receivable(14,605)782(56,823)(11,145)20,48737,900(42,485)3,7 59(19,964)(12,879)10,5627,76420,399(15,260)(5,009)(7,564)M erchandise inventories(155,421)(96,077)(76,337)(137,841)(160,780)(182,7 90)(124,566)(119,539)(135,732)(168,150)(164,164)20,715(201, 553)(47,285)(153,552)(158,673)Accounts payable and accrued
- 44. expenses342,826349,122137,158175,733186,228184,986109,34 143,612164,201282,408187,80161,38270,304127,68366,15594,9 16Income taxes payable34,31912,47432,264(3,861)17,58728,676(67,343)32,118 (3,460)13,74310,7984,96613,367(22,230)7,8196,493Other, net(6,073)5,215(10,626)9,542(1,913)60829,186(25,637)(13,332) 1,720(16,255)(19,645)(11,392)(20,813)(2,898)2,930Net cash provided by operating activities1,291,5381,196,252923,808921,100845,194822,747648 ,083638,379720,807736,170458,937512,960311,668383,038177, 563174,890Cash flows from investing activities:Capital expenditures(321,604)(315,400)(272,247)(243,594)(224,474)(26 3,580)(283,478)(184,870)(182,242)(117,239)(169,296)(249,657) (428,315)(337,202)(295,417)(280,237)Purchase of marketable securities(43,772)(56,156)(48,444)(54,282)(94,615)(159,957)--- --(4,463)----Proceeds from sale of marketable securities43,08152,62046,30650,71286,921145,369--- 1,9112,552-----Acquisitions------(3,090)(11,441)-----(100,031)-- Disposal of capital assets3,30111,48910,6634,0143,4539,8453,7972,59014,44350,8 1744,60111,771----Net cash used in investing activities(318,994)(307,447)(263,722)(243,150)(228,715)(268,3 23)(282,771)(193,721)(167,799)(64,511)(122,143)(242,349)(42 8,315)(437,233)(295,417)(280,237)Cash flows from financing activities:Net proceeds from commercial paper134,600155,400277,600(206,700)84,300(51,993)(304,700) 254,40044,800(162,247)(381,853)234,300228,000305,000--Net proceeds from short-term borrowings6,90126,186---000-- 104,00084,900Proceeds from issuance of debt500,000- 500,000750,000- 200,000300,000500,000500,000150,000465,000120,000114,863 33,401--Repayment of debt(199,300)- (300,700)(229,827)(5,839)(150,000)- (431,995)(215,000)(15,000)(105,000)--(265,429)-(4,003)Net proceeds from sale of common stock55,84652,92239,85527,06558,95238,25364,54733,55245,3
- 45. 0355,67648,4105,4557,26611,49214,61817,699Purchase of treasury stock(1,466,802)(1,123,655)(1,300,002)(849,196)(761,887)(578 ,066)(426,852)(848,102)(891,095)(698,983)(366,097)(639,925)( 234,602)(28,746)--Income tax benefit from exercise of stock options34,94522,2518,40710,14216,52310,608---------- Payments of capital lease obligations(22,781)(16,597)(17,040)(15,880)(11,360)----------- Other(17,180)- (15,016)(8,286)(2,072)(6,478)(349)31,237(14,220)(4,814)3,063 10,610407440-4,244Net cash used in financing activities(973,771)(883,493)(806,896)(522,682)(621,383)(537,6 76)(367,354)(460,908)(530,212)(675,368)(336,477)(269,560)11 5,93456,158118,618102,840Effect of exchange rate changes on cash553262(2,945)539------------Net (decrease) increase in cash and cash equivalents(674)5,574(149,755)155,807(4,904)16,748(2,042)(16 ,250)22,796(3,709)3171,051(713)1,963764(2,507)Cash and cash equivalents at beginning of year98,28092,706242,46186,65491,55874,81076,85293,10270,3 0674,0156,9695,9186,6314,6683,9046,411Cash and cash equivalents at end of year$97,606$98,280$92,706$242,461$86,654$91,558$74,810$7 6,852$93,102$70,306$7,286$6,969$5,918$6,631$4,668$3,904S upplemental cash flow information:Interest paid, net of interest cost capitalized$155,531$150,745$132,905$107,477$116,580$104,9 29$98,937$77,871$77,533$77,935$97,968$74,745$41,533$17,0 42$8,779$1,971Income taxes paid$405,654$420,575$299,021$313,875$299,566$267,913$339 ,245$237,010$215,760$178,417$100,702$123,036$93,073$122, 529$109,681$69,791Assets acquired through capital lease$32,301$75,881$16,880$61,572$69,325--Data source: AutoZone annual reports. Ex5_Stockholders EquityAutoZone 2011 Statement of Stockholders’ Equity ($
- 46. thousands)AccumulatedCommonAdditionalRetainedOtherShares CommonPaid-in(Deficit)ComprehensiveTreasury(in thousands)Issued (000)StockCapitalEarningsLossStockTotalBalance at August 30, 200863,600$636$537,005$206,099($4,135)($509,918)$229,687 Net income657,049657,049Pension liability adjustments, net of taxes of ($29,481)(46,956)(46,956)Foreign currency translation adjustment(43,655)(43,655)Unrealized gain adjustment on marketable securities, net of taxes of $306568568Reclassification of net loss on termination of swap into earnings, net of taxes of $1,6012,7442,744Reclassification of net gain on derivatives into earnings(612)(612)Comprehensive income569,138Cumulative effect of adopting ASC Topic 715 measurement date, net of taxes of $19830011311Purchase of 9,313 shares of treasury stock(1,300,002)(1,300,002)Issuance of 3 shares of common stock395395Retirement of treasury shares(6,223)(62)(55,071)(726,513)781,646—Sale of common stock under stock option and stock purchase plans504539,85039,855Share-based compensation expense19,13519,135Income tax benefit from exercise of stock options8,4078,407Balance at August 29, 200957,881$579$549,326$136,935($92,035)($1,027,879)($433, 074)Net income738,311738,311Pension liability adjustments, net of taxes of ($5,504)(8,133)(8,133)Foreign currency translation adjustment705705Unrealized loss adjustment on marketable securities, net of taxes of ($56)(104)(104)Net losses on outstanding derivatives, net of taxes of ($3,700)(6,278)(6,278)Reclassification of net gain on derivatives into earnings(612)(612)Comprehensive income723,889Purchase of 6,376 shares of treasury stock(1,123,655)(1,123,655)Retirement of treasury shares(8,504)(85)(85,657)(1,120,289)1,206,031—Sale of common stock under stock options and stock purchase plan684752,91552,922Share-based compensation expense19,12019,120Income tax benefit from exercise of stock
- 47. options22,25122,251Other(301)(11)94(218)Balance at August 28, 201050,061$501$557,955($245,344)($106,468)($945,409)($738 ,765)Net income848,974848,974Pension liability adjustments, net of taxes of ($3,998)(17,346)(17,346)Foreign currency translation adjustment8,3478,347Unrealized loss adjustment on marketable securities, net of taxes of ($91)(171)(171)Net losses on terminated derivatives(5,453)(5,453)Reclassification of net losses on derivatives into earnings1,4001,400Comprehensive income835,751Purchase of 5,598 shares of treasury stock(1,466,802)(1,466,802)Retirement of treasury shares(6,577)(66)(82,150)(1,247,627)1,329,843—Sale of common stock under stock options and stock purchase plan600655,84055,846Share-based compensation expense24,79424,794Income tax benefit from exercise of stock options34,94534,945Other(1)(1)Balance at August 27, 201144,084$441$591,384($643,998)($119,691)($1,082,368)($1, 254,232)Data source: AutoZone annual reports. Ex6_Capital StructureYearInterest Expense ($mm)Depr Expense ($mm)Debt ($B)Equity ($B)EBITEBITDACoverage Ratio1996$1.97$63.540.090.87268.93332.48168.9x1997$8.84$7 7.820.201.08321.35399.1745.1x1998$18.20$96.600.551.30382. 31478.9126.3x1999$45.31$128.530.891.32433.10561.6312.4x20 00$76.83$126.801.250.99512.02638.828.3x2001$100.67$131.33 1.230.87387.69519.025.2x2002$79.86$118.261.190.69771.0188 9.2611.1x2003$84.79$109.751.550.37917.801,027.5512.1x2004 $92.80$106.891.870.17998.711,105.6011.9x2005$102.44$135.6 01.860.39975.661,111.2610.8x2006$107.89$139.471.860.471,0 09.931,149.3910.7x2007$119.12$159.411.940.401,055.271,214. 6810.2x2008$116.75$169.512.250.231,124.131,293.6411.1x200 9$142.32$180.432.73(0.43)1,176.061,356.509.5x2010$158.91$1 92.082.91(0.74)1,319.411,511.509.5x2011$170.56$196.213.35( 1.25)1,494.801,691.019.9xNote: Coverage ratio is defined as EBITDA divided by interest expense.Data source: AutoZone annual reports. AutoZone Capital Structure and Coverage Ratio
- 48. Debt ($B) 1996 1997 1998 1999 2000 2001 2002 2003 2004 2005 2006 2007 2008 2009 2010 2011 9.4399999999999998E-2 0.19839999999999999 0.54506699999999997 0.88834000000000002 1.2499370000000001 1.2254020000000001 1.1945170000000001 1.546845 1.8692500000000001 1.86185 1.8571569999999999 1.9356180000000001 2.25 2.7269000000000001 2.9084859999999999 3.3516819999999998 Equity ($B) 1996 1997 1998 1999 2000 2001 2002 2003 2004 2005 2006 2007 2008 2009 2010 2011 0.86558199999999996 1.0752079999999999 1.302057 1.323801 0.99217900000000003 0.86621300000000001 0.68912700000000005 0.37375799999999998 0.17139299999999999 0.39100699999999999 0.469528 0.4032 0.229687 - 0.43307400000000001 -0.73876500000000001 -1.254232 Coverage Ratio1996 1997 1998 1999 2000 2001 2002 2003 2004 2005 2006 2007 2008 2009 2010 2011 168.85474860335196 45.139884654529006 26.307734563832124 12.394641596045197 8.3147208121827401 5.1559529131277007 11.135274229902329 12.118705035971223 11.913247273824403 10.847603057309918 10.653449378527931 10.19742939655462 11.080928519422674 9.5315705893926186 9.5117205444625554 9.9146443710900183 Book Values ($ billions) Coverage Ratio Ex7_Cars,MilesAverage age for:DateAnnual Vehicle-Distance Traveled (Billion Miles)YearPassengerLight TrucksAverage ageDistance traveledJan-861,78419958.48.38.42.3Feb- 861,78819968.58.38.52.4Mar-861,79519978.78.58.62.4Apr- 861,79719988.98.58.82.5May-861,80119999.18.58.82.6Jun- 861,80520009.18.48.92.6Jul-861,80920019.38.48.92.7Aug-
- 50. 992,659Oct-992,664Nov-992,674Dec-992,679Jan-002,689Feb- 002,697Mar-002,709Apr-002,716May-002,727Jun-002,735Jul- 002,737Aug-002,743Sep-002,747Oct-002,750Nov-002,751Dec- 002,748Jan-012,754Feb-012,756Mar-012,755Apr-012,760May- 012,762Jun-012,763Jul-012,768Aug-012,774Sep-012,772Oct- 012,776Nov-012,784Dec-012,796Jan-022,801Feb-022,808Mar- 022,812Apr-022,817May-022,823Jun-022,827Jul-022,833Aug- 022,838Sep-022,845Oct-022,850Nov-022,851Dec-022,856Jan- 032,859Feb-032,854Mar-032,855Apr-032,857May-032,859Jun- 032,863Jul-032,869Aug-032,871Sep-032,875Oct-032,883Nov- 032,886Dec-032,890Jan-042,894Feb-042,904Mar-042,918Apr- 042,929May-042,933Jun-042,938Jul-042,942Aug-042,944Sep- 042,950Oct-042,951Nov-042,957Dec-042,965Jan-052,966Feb- 052,973Mar-052,975Apr-052,975May-052,980Jun-052,987Jul- 052,987Aug-052,990Sep-052,989Oct-052,986Nov-052,989Dec- 052,989Jan-062,999Feb-062,999Mar-063,003Apr-063,003May- 063,003Jun-063,003Jul-063,000Aug-063,000Sep-063,003Oct- 063,010Nov-063,012Dec-063,014Jan-073,015Feb-073,013Mar- 073,016Apr-073,018May-073,023Jun-073,024Jul-073,028Aug- 073,034Sep-073,035Oct-073,038Nov-073,039Dec-073,031Jan- 083,031Feb-083,033Mar-083,026Apr-083,026May-083,021Jun- 083,011Jul-083,006Aug-082,996Sep-082,989Oct-082,984Nov- 082,975Dec-082,977Jan-092,969Feb-092,967Mar-092,964Apr- 092,964May-092,963Jun-092,967Jul-092,972Aug-092,973Sep- 092,978Oct-092,977Nov-092,979Dec-092,978Jan-102,974Feb- 102,967Mar-102,973Apr-102,976May-102,976Jun-102,979Jul- 102,981Aug-102,985Sep-102,989Oct-102,995Nov-102,998Dec- 102,999Jan-113,000Feb-113,001Mar-112,998Apr-112,992May- 112,988Jun-112,984Jul-112,977Aug-112,972Sep-112,968Oct- 112,962Nov-112,960Dec-112,963Data source: U.S. Department of Transportation (miles driven) and, Polk Research (vehicle age). Miles Driven and Average Vehicle Age Distance traveled 1995 1996 1997 1998 1999 2000 2001 2002 2003 2004 2005 2006 2007 2008 2009 2010 2011 2.3260000000000001 2.407 2.4460000000000002
- 51. 2.536 2.5910000000000002 2.649 2.7370000000000001 2.7679999999999998 2.8330000000000002 2.8690000000000002 2.9420000000000002 2.9870000000000001 3 3.028 3.0059999999999998 2.972 2.9809999999999999 Average age 8.4 8.5 8.6 8.8000000000000007 8.8000000000000007 8.9 8.9 9 9.1 9.4 9.5 9.6999999999999993 9.8000000000000007 10 10.3 10.6 10.8 Distance traveled (trillion miles) Average Vehicle Age (years) Ex9_Repurchase & ROIC$ 000, except share repurchases in $ millions1995199619971998199920002001200220032004200520 0620072008200920102011Share repurchases$0$0$29$235$640$366$699$891$848$427$578$762 $849$1,300$1,124$1,467Net income$167,165$195,008$227,903$244,783$267,590$175,526$ 428,148$517,604$566,202$571,019$569,275$595,672$641,606$ 657,049$738,311$848,974AdjustmentsInterest expense1,9698,84318,20445,31276,830100,66579,86084,79092, 804102,443107,889119,116116,745142,316158,909170,557Rent expense30,62639,07856,41096,20095,700100,39799,032110,665 118,087150,645143,888152,523165,121181,308195,632213,846 Tax effect(12,185)(18,018)(27,911)(52,184)(66,445)(78,106)(68,073 )(74,006)(79,081)(87,588)(92,881)(98,795)(102,346)(117,929)( 128,983)(137,962)After-tax return$187,575$224,911$274,606$334,111$373,675$298,482$5 38,967$639,054$698,012$736,519$728,172$768,516$821,126$8 62,744$963,869$1,095,415Average debt$53,952$146,400$371,734$716,704$1,069,139$1,237,670$1 ,209,960$1,370,681$1,708,048$1,865,550$1,859,504$1,896,388 $2,092,809$2,488,450$2,817,693$3,130,084Average equity775,146970,3951,188,6331,312,9291,157,990929,196777,
- 52. 670531,443272,576281,200430,268436,364316,444(101,694)(58 5,920)(996,499)Rent x 6183,756234,468338,460577,200574,200602,381594,195663,99 3708,521774,706863,331915,138990,7261,087,8481,173,7921,2 83,076Average capital lease obligations0000000000027,54459,57559,41371,52287,468Pre- tax invested capital$1,012,854$1,351,263$1,898,826$2,606,833$2,801,329$ 2,769,246$2,581,824$2,566,116$2,689,144$2,921,456$3,153,10 2$3,275,434$3,459,553$3,534,017$3,477,088$3,504,130ROIC1 8.5%16.6%14.5%12.8%13.3%10.8%20.9%24.9%26.0%25.2%23. 1%23.5%23.7%24.4%27.7%31.3%Effective Tax Rate37.4%37.6%37.4%36.9%38.5%38.8%38.1%37.9%37.5%34. 6%36.9%36.4%36.3%36.4%36.4%35.9%Note: ROIC is calculated as the sum of net income and tax-adjusted interest and rent expenses divided by the sum of average debt, average equity, six times rent expense (to approximate capitalizing rent), and average capital lease obligations.Data source: AutoZone annual reports AutoZone’s Share Repurchases and ROIC Share repurchases 1996 1997 1998 1999 2000 2001 2002 2003 2004 2005 2006 2007 2008 2009 2010 2011 0 0 28.745999999999999 234.602 639.92499999999995 366.09699999999998 698.98299999999995 891.09500000000003 848.10199999999998 426.85199999999998 578.06600000000003 761.88699999999994 849.19600000000003 1300.002 1123.655 1466.8019999999999 ROIC 1996 1997 1998 1999 2000 2001 2002 2003 2004 2005 2006 2007 2008 2009 2010 2011 0.18519455505759524 0.16644514447340705 0.1446189081608131 0.12816727523878865 0.13339220808828336 0.10778456805656289 0.20875440028672923 0.24903539590786553 0.25956655813703933 0.25210681880488633 0.23093824960360473 0.23463026332523743 0.23735044390500662
- 53. 0.24412571520559256 0.27720593379985026 0.31260680611117803 Share Repurchase Amount ($ millions) Returns Ex10_Industry StructureYearIndustryTop 10 Auto Parts Stores200135,23830%200235,59031%200335,35732%200435,4 0534%200535,69036%200635,85038%200736,22441%200836,1 5242%200935,70844%201035,42745%Top 10 StoresPos.StoresCompany14728AutoZone23657O'Reilly Auto Parts33627Advance Auto Parts41500General Parts / CARQUEST51035Genuine Parts / NAPA6630Pep Boys7406Fisher Auto Parts8273Uni-Select9155Replacement Parts10128Auto-Wares GroupNote: The top 10 companies (stores) as of August 2010: AutoZone (4,728), O’Reilly Auto Parts (3,657), Advance Auto Parts (3,627), General Parts/CARQUEST (1,500), Genuine Parts/NAPA (1,035), Pep Boys (630), Fisher Auto Parts (406), Uni-Select (273), Replacement Parts (155), and Auto-Wares Group (128).Data source: AAIA Factbook and SEC filings Aftermarket Auto Parts Industry Industry 2001 2002 2003 2004 2005 2006 2007 2008 2009 2010 35238 35590 35357 35405 35690 35850 36224 36152 35708 35427 Top 10 Auto Parts Stores 2001 2002 2003 2004 2005 2006 2007 2008 2009 2010 0.3 0.31 0.32 0.34 0.36 0.38 0.41 0.42 0.44 0.45 Total Stores for Inudstry Concentration of Top 10 Retailers