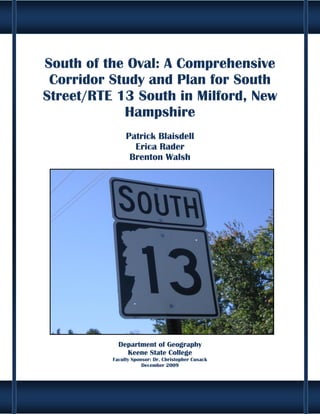
1. South of the Oval: A Comprehensive
Corridor Study and Plan for South
Street/RTE 13 South in Milford, New
Hampshire
Patrick Blaisdell
Erica Rader
Brenton Walsh
Department of Geography
Keene State College
Faculty Sponsor: Dr. Christopher Cusack
December 2009
i
2. Acknowledgements
We would like to extend our sincere thoughts and gratitude toward the following people for
their invaluable assistance throughout the duration of this study. Without their generosity this
project could not have been accomplished. Our appreciation goes out to, Bill Parker Town of
Milford Community Development Director, Sarah Marchant, Town of Milford Planner and GIS
Coordinator, Chris Costantino Town of Milford Conservation Commission, Captain Stephan
Toom, Operations Coordinator Milford Police Department, Marti Noel, Town of Milford
Assessor, Matt Waitkens, Field Data/Transportation Planner II Nashua Regional Planning
Commission, and Stephanie Tetley, Town of Milford Assessing Department Coordinator. We
would also like to especially thank our professor, Dr. Christopher Cusack, Ph.D. Professor of
Geography, Keene State College, for his persistent guidance and assistance enabling this study
to become a success.
ii
3. Abstract
This transportation corridor analysis analyzes a wide array of current land use and
infrastructure issues along the South Street/RTE 13 South corridor commencing from
downtown Milford to the Brookline town line. The intent of this examination is to validate the
relatively high development potential of the corridor affirmed by the Town of Milford Planning
Board and Community Development Department. This study incorporates use of GIS mapping,
statistical tests in SPSS, relevant research, and structural and expert oriented surveys. The
expert’s survey was administered to 68 Milford Officials to collect valuable opinionated
information concerning the corridor. The structural survey physically assessed the corridor to
provide relevant insight toward the aesthetics and developmental characteristics of the byway.
Overall, the results of these examinations and analyses confirm the presence of minor
developmental potential along the South Street/RTE 13 South corridor.
iii
4. Table of Contents
Chapter I: Intent of Study........................................................................................................................... 1
A. The Roots and Concerns of Suburbanization ...................................................................................... 2
B. Fundamentals of Corridor Studies ...................................................................................................... 3
C. Purpose Behind the South Street/RTE 13 South Corridor Study and Plan ......................................... 5
D. Methodology ....................................................................................................................................... 7
Chapter II: Analysis of Successful Planning ............................................................................................... 9
A. Principles of Land Use Planning ........................................................................................................ 10
B. Development Process........................................................................................................................ 13
C. Principles of Smart Growth ............................................................................................................... 15
D. Successful Corridor Studies ............................................................................................................... 17
Chapter III: Historical Overview of Milford ............................................................................................. 20
A. Relative Location and Geography of Milford .................................................................................... 21
B. The “Mil” in Milford .......................................................................................................................... 23
C. The Birth of the “Granite Town” ....................................................................................................... 26
D. Commercialization of Milford ........................................................................................................... 27
Chapter IV: Demography of New Hampshire and Milford ..................................................................... 32
A. Analysis of Population Trends in New Hampshire and Milford 1800-2020...................................... 33
B. Age/Sex Structure of New Hampshire and Milford .......................................................................... 39
Chapter V: Transportation in Milford ...................................................................................................... 42
A. The Milford Oval ............................................................................................................................... 43
B. Existing Transportation Routes of Milford ........................................................................................ 45
C. Development of Case Study Street ................................................................................................... 47
Chapter VI: Current Land Attributes Abutting Corridor.......................................................................... 49
A. Existing Land Uses and Regulations ................................................................................................. 50
B. Natural Constraints Inhibiting Development .................................................................................. 57
C. Assessed Property Value of Lots Adjacent to Corridor .................................................................... 61
Chapter VII: Current Transportation Issues............................................................................................. 66
A. Analysis of Corridor Traffic Capacity ................................................................................................ 67
iv
5. B. Pedestrian/Bicycle Amenities........................................................................................................... 73
C. Corridor Visual Analysis .................................................................................................................... 78
Chapter VIII: Analysis of Survey ............................................................................................................... 88
A. Analysis of Personal Insight .............................................................................................................. 89
B. Examination of Descriptive Statistics ............................................................................................... 91
Chapter IX: An Effective and Efficient Vision for the Future .................................................................. 96
A. Developmental Capability of South Street/RTE 13 South Corridor ................................................. 97
B. Recommendations to Foster Development .................................................................................. 100
C. Future Considerations .................................................................................................................... 108
Literature Cited....................................................................................................................................... 111
v
6. List of Figures
Figure 1 Relative Location of South Street/RTE 13 South .......................................................................... 6
Figure 2 Methodology Process ................................................................................................................... 8
Figure 3 Components of Land Use Planning ............................................................................................. 11
Figure 4 Relative Location of Milford, New Hampshire ........................................................................... 22
Figure 5 Upper Souhegan River in Autumn .............................................................................................. 23
Figure 6 The Souhegan Cotton Mill, Circa Mid-Eighteenth Century ........................................................ 25
Figure 7 Remnants of Mill Along Great Brook .......................................................................................... 26
Figure 8 Hitchiner Manufacturing Co., INC Gas Turbine Operations Sector ............................................ 30
Figure 9 Percent Population Change of New Hampshire 1950-2000 ...................................................... 36
Figure 10 Historical Population Trends of New Hampshire 1800-2020 ................................................. 38
Figure 11 Historical Population Trends of Milford 1800-2020 ................................................................ 38
Figure 12 Age/Sex Structure of New Hampshire ...................................................................................... 41
Figure 13 Age/Sex Structure of Milford ................................................................................................... 41
Figure 14 The Milford Oval During Summer ............................................................................................ 44
Figure 15 Existing Transportation Routes in Milford ............................................................................... 46
Figure 16 South Street/RTE 13 South and RTE 101 Intersection ............................................................. 48
Figure 17 Zoning Districts of Milford ....................................................................................................... 52
Figure 18 Vacant Lot Just North of RTE 101 Intersection ........................................................................ 53
Figure 19 Single Family Residential Home Near Colburn Road ............................................................... 54
Figure 20 Existing Land Usage North of RTE 101 Intersection ................................................................ 56
Figure 21 Existing Land Usage South of RTE 101 Intersection ................................................................. 56
Figure 22 Wetland Along Western Side of South Street ......................................................................... 58
Figure 23 Roach Wildlife Preserve ........................................................................................................... 59
Figure 24 Natural Constraints North of RTE 101 Intersection ................................................................. 60
Figure 25 Natural Constraints South of RTE 101 Intersection ................................................................. 60
Figure 26 Factors Determining Assessed Property Value ........................................................................ 61
Figure 27 Percentage of Parcels Within Estimated Value Range ............................................................ 63
Figure 28 Assessed Value of Parcels North of RTE 101 Intersection ....................................................... 64
vi
7. Figure 29 Assessed Value of Parcels South of RTE 101 Intersection ....................................................... 64
Figure 30 Traffic Counter Locations North of RTE 101 Intersection ........................................................ 69
Figure 31 Traffic Counter Locations South of RTE 101 Intersection ......................................................... 69
Figure 32 Estimated Traffic Volume During Average Workday 2009 and 2020 ...................................... 71
Figure 33 Percent Accident Occurrences Along South Street/RTE 13 South 2004-2008 ........................ 72
Figure 34 Sidewalk Along South Street, Near Lincoln Street Intersection .............................................. 74
Figure 35 Trail Head of Granite Rail Trail ................................................................................................. 75
Figure 36 Shoulder Along RTE 13 South, Near Old Brookline Road ........................................................ 76
Figure 37 Pedestrian and Bicycle Accommodations North of RTE 101 Intersection ............................... 77
Figure 38 Pedestrian and Bicycle Accommodations South of RTE 101 Intersection ............................... 77
Figure 39 Relative Method of Visually Assessing Corridor ...................................................................... 78
Figure 40 Assessed Study Areas and Segments ....................................................................................... 79
Figure 41 Study Area 1 Segment A, High Street Intersection Looking South .......................................... 80
Figure 42 Study Area 1 Segment B, Lincoln Street Intersection Looking South ...................................... 81
Figure 43 Study Area 1 Segment C, Just North of RTE 101 Intersection Looking North ......................... 82
Figure 44 Study Area 2 Segment A, Just South of RTE Intersection Looking South ................................ 83
Figure 45 Study Area 2 Segment B, Just North of Old Brookline Road Looking South ............................ 84
Figure 46 Study Area 3 Segment A, Just North of Colburn Road Looking South ..................................... 85
Figure 47 Study Area 3 Segment B, At Brookline Town Line Looking North ........................................... 86
Figure 48 Reasons For Residing in Milford ............................................................................................... 90
Figure 49 Utilization Habits of South Street/RTE 13 South Corridor ........................................................ 91
Figure 50 Percent Perceived Economic Status of Milford ........................................................................ 92
Figure 51 Suitable Developmental Capability North of RTE 101 Intersection ......................................... 99
Figure 52 Suitable Developmental Capability South of RTE 101 Intersection ......................................... 99
Figure 53 Recommended Rezoned Districts North of RTE 101 Intersection .......................................... 102
Figure 54 Recommended Rezoned Districts North of RTE 101 Intersection .......................................... 102
Figure 55 Infrastructure Improvements Oval to Entrance of Granite Rail Trail ..................................... 105
Figure 56 Infrastructure Improvements Granite Rail Trail to Brookline Town Line ............................... 107
vii
8. List of Tables
Table 1 Top Ten Employing Companies in Milford ................................................................................... 31
Table 2 Land Use Statistics of Parcels Abutting Corridor ......................................................................... 55
Table 3 Chi Square Test Results for Economic Perception of Milford ...................................................... 92
Table 4 Two Sample Difference of Means Results of Positive Economic Change of Corridor ................ 93
Table 5 Independent Two Sample Difference of Means of Attitudes Toward Rezoning Corridor ......... 95
viii
10. A. The Roots and Concerns of Suburbanization
One of the most prominent centripetal forces binding a particular society together is the
city, which is essentially a permanently settled administrative district. These territorially
bounded regions constitute the buildings, culture, economy, government, industry, and
transportation of a particular society. For centuries, individuals have been attracted to these
crucial necessities as a means for survival. The result of this mass influx of people descending
on these urban oriented settlements has ultimately relinquished congestion, pollution, and a
growing sense of loathe toward these once fundamental utopias. However, the desirable
ideology to sprawl from these overcrowded conurbations was ultimately undermined by
inadequate transportation networks in the early twentieth century (Owen 1972, 1).
The revolutionary invention of the combustion engine in the early twentieth century
essentially cultivated motorized vehicles which virtually propelled planners in urban America to
coin and enact efficient transportation networks. The mid-century attack on Pearl Harbor
coincided with the American involvement in World War II led to large scale public works
projects aimed at interconnecting the nation via improved and new road networks. The
triumphant victory of the United States, spurred a number of monumental social and economic
changes. With soldiers returning from war, a relatively high demand for family oriented housing
was initiated, and newly formed families sought to migrate out of the congested cities and
settle within the rural regions of America. A prime contributor to accomplish this goal was the
Interstate Highway Act of 1956, which resulted in the construction of a number of efficient
byways throughout the nation. This ultimately encouraged landowners and developers to
coincide to commence large scale suburban developments projects located within the
2
11. proximity of these major byways (Porterfield and Hall 1995, ix).
This concept of urban sprawl reaching small towns is a recurring theme to this day.
Consequently, regional planners seek methods to successfully accommodate growing
populations while simultaneously instilling a community oriented society. However in order to
sustain the economy, each region needs a number of businesses to provide jobs, tax revenue,
and mandatory commodities. One eminent consideration is locating suitable amenities within
the town to produce these developments. The process of incorporating these economic
supplements is typically conceived via comprehensive corridor studies and plans (Porterfield
and Hall 1995, ix).
B. Fundamentals of Corridor Studies
These imperative studies are performed along transportation routes that serve
expanding metropolitan areas and inhabitants of a region. Throughout the twentieth and
twenty first century, transportation planning in the United States has become increasingly
implemented. Corridor studies are commonly used by the Federal Highway Administration and
the Federal Transit Administration. These agencies purposely utilize this concept to examine
innovative ideas for infrastructure change, expansion and preservation (U.S. Department of
Transportation 2009). Corridor studies can be conducted on two different yet interchangeable
levels. The first being corridor subareas, which examine specific stretches of road where
notable issues have arisen and need addressing. These include changes in land use, zoning
ordinances, traffic volume, road accessibility, and pedestrian walkways. The second form of
regional studies take several corridor subarea studies into consideration in order to make
decisions that impact an entire county or region of a state. Both corridor types (regional and
3
12. subarea) rely on one another in order to comprehensively plan for present and future facilities
and growth patterns (Smith 1999 15-18).
Corridor studies are not uniform, as all corridor studies are different in some way, shape
or form. A corridor study needs to be tailored specifically to the area or region that particular
study defines. However there are several basic guidelines defined in the Guidebook for
Transportation Corridor Studies that should be taken into account while conducting such a
study. The first notion to consider is to never state a problem in terms of a solution. For
example, a phrase that should never be said is “there is a significant need for a widening of a
specific road”. This provides a solution before a specific problem is even introduced. The next
step is to establish current problems as well as any future problems that may take place over
the existence of the corridor. Problems need to be stated as specifically as possible, this is done
to insure legitimacy and accuracy of the problem. In addition to problems, alternatives and
solutions need to be presented for each of these issues that are stated. Not only do problems
need to be stated specifically they must also be understandable for the general public and town
officials (Smith 1999, 15-18).
Agencies or groups conducting corridor studies must have an agreement on the
problems at hand prior to the initiation of the project. This fundamental step aids in the
elimination of controversy amongst the community. The last guideline to incorporate is that the
problem statement of the study needs to be documented so as to meet the requirements of
subsequent environmental documentation. These general guidelines provide a base for corridor
studies; this base is then built upon as a result of tailoring the study to a specific area and
community (Smith 1999, 17-18).
4
13. A corridor study is essentially a formulated plan that supplies extensive information on
certain subjects and issues. This provides the public and town officials with sufficient evidence
to validate notable background information. This information is prepared so that a competent
decision is reached when considering important policies and regulation changes. Corridor
studies are a catalyst for urban planning projects as they address new issues and bring them to
the attention of the community. The alternatives provided to issues of a corridor study must be
developed after a thorough analysis of problems that have arisen in the past, are arising now,
and problems that have a great potential to arise in the future along the corridor.
Problems are imperative to corridor studies; they contribute to the reasoning behind
why improvements are being initially considered. Community involvement provides goals,
objectives and policies that are important as well. This ultimately defines the important factors
to the community and town officials. Corridor studies intend to encompass all aspects of the
issues and problems presented; this requires a collaboration of several differing groups of a
town or region in order to view these issues from all angles and make well rounded decisions
(Smith 1999, 20-22).
C. Purpose Behind the South Street/RTE 13 South Street Corridor Study and Plan
The Town of Milford Community Development Department has recently undertaken
numerous Master Plan updates within the Economic Development and Traffic/Transportation
chapter to foster development. A key contributor is the Town of Milford Planning Board which
is reviewing design standards for rezoning, redevelopment and new development schemes.
This collaborative effort analyzed several regions of the town for developmental suitability.
After weighing these various current developmental conditions and implications, it was
5
14. concluded that South Street/RTE 13 South and the abutting parcels could potentially
supplement the inevitable growth of the future (Bill Parker, Personal Communication, 2009).
The section of highway under exhaustive examination runs south of the Oval to the
Brookline border and is classified into two distinct names. This byway is referred as South Street
south of the Oval toward the RTE 101 intersection. This road then becomes RTE 13 south of the
RTE 101 intersection toward the Brookline town line. Figure 1 depicts the relative location and
relative length of South Street/RTE 13 South within Milford. To disclose the extent of
developmental capability of this corridor, the Town of Milford concluded that a comprehensive
South Street/RTE 13 South corridor study and plan must be devised to provide realistic
solutions toward these beneficial propositions. The practicality of the scores of developable lots
adjacent to the corridor bestows a considerable high opportunity to capitalize on the strategic
location of this heavily utilized byway (Bill Parker, Personal Communication, 2009).
Figure 1 Relative Location of South Street/RTE 13 South.
6
15. The process of realizing these beneficial propositions requires the extensive analysis of a
number of relevant subject matters. Areas under discussion include all portions of South
Street/RTE 13 south of the Oval to the Brookline town line and parcels abutting the
thoroughfare. A historical and contemporary assessment of the economy, demographics, and
transportation of the case study town will provide preliminary background factors influencing
the current development capability of the corridor. Numerous fundamentals of efficient urban
design and sustainable planning enactments will be emphasized identifying the necessary
measures to legitimize the effectiveness of this study.
The initial purpose of this study intends to identify current issues in land use ordinances
and usages, natural constraints, abutting parcel value, transportation capacity, alternative
means of transportations, physical attributes, and personal insight from town officials. Potential
conflicts that could arise without the proper implementation of this effective planning initiative
are addressed providing feasible recommendations to realize development potential and
reconfiguration of the corridor. The completion of this imposed corridor study and plan
requires the comprehension of a wide array of resources providing accuracy and validate these
pragmatic limitations (Bill Parker, Personal Communication, 2009).
D. Methodology
The first step of completing this imperative planning measure was to compile a wide
array of pertinent publications, personal interviews, journals, and documents pertaining to the
fundamentals of successfully devising corridor studies. These resources will be incorporated
throughout the extent of this study revealing invaluable fundamentals toward recognizing
effective planning schemes. Statistical data were acquired and illustrated from a number of
7
16. reputable sources complementing the accuracy of background research. Synthesized GIS maps
generated via ArcMap 9.2, provide adequate spatial analysis of the various resources.
Results from field work are incorporated within this study to assess the physical and
informal attributes of the corridor. The photography of a number of notable features
throughout the corridor are utilized to realistically illustrate the numerous issues and elements
of this byway. Informative surveys were devised and distributed to town officials providing
relevant insight and considerations concerning the reasonable development capacity of the
study area. These surveys were the key component in producing descriptive data in SPSS testing
for statistical significant differences between responses. Figure 2 outlines the integral factors
employed and interpreted providing viable solutions toward fostering the development of
Milford.
Figure 2 Methodolgy Process.
8
18. The decisive fundamentals and approaches utilized when creating an effective corridor
study must be thoroughly understood before engaging in the completion of this important
planning measure. Achieving this task requires the analysis of effective land use planning,
development, smart growth tactics, and recognizing the magnitude of success of other notable
corridor studies. All aspects of these relevant resources are briefly outlined and presented so as
to provide an accurate method for realizing the developmental potential of the South
Street/RTE 13 South corridor.
A. Principles of Land Use Planning
It is the obligatory mission for community leaders to identify adverse setbacks which can
potential diminish the efficiency of a municipality. The rapidly developing suburban regions of
the United States requires the coexistence of officials and the general public to propose
effective planning endeavors to minimize the extent of these costs. This attentive planning
investment is essentially directed through land use planning. The goal of this method includes
providing the community with healthier neighborhoods, enhanced transportation networks,
land stability, and economic security (Robart 1989, 1).
Additionally, these fundamental planning processes speculate infill sites which could
potentially foster the economy of the community. The practice of achieving this effective
community oriented utopia is applied through zoning, subdivisions, and setback ordinances.
The integration of these three land use components is illustrated in Figure 3. Ultimately these
planning fundamentals permit municipalities to direct their future by revising and adopting
these practical tactics (Robart 1989, 1).
10
19. Land Use
Planning
Setback
Zoning Subdivisions
Ordinances
Figure 3 Components of Land Use Planning.
(Source: Robart 1989, 1).
One prominent cornerstone of preventing land exploitation and unreasonable
development practices is through zoning ordinances. These regulations are conceived into
administered ordinances by zoning boards and may be approved through town residents in
annual voting amendments. These land use principles have the ability to dictate lot sizes,
overlay districts, variances, and building and road design. These defined planning initiatives can
potentially hinder the value of land and private residences based on these imposed limitations
of land usage. The process of amending zoning ordinances is a relatively flexible process
permitting local authorities to contest the constantly changing social and economic
circumstances of a particular region (Meshenberg 1976, 1).
The main function of this planning plot is to segregate land into definite boundaries
based on trends in current land usage. This essentially prevents foreseeable conflictions
between the various development types within the region. These mandates aim to instill
beneficial development practices while preserving the character of the community. The typical
land usage classifications systems in the United States include industrial, commercial and
residential zoning. Each zoning district contains entirely different administered regulations
11
20. controlling the magnitude of feasible developments within the numerous regions of a
municipality. These districts can also be integrated endorsing diversified land usage maximizing
the relative beneficial values of developments. Overall, the proper guidance and order of these
effective planning initiatives allows effective land use management which is rapidly becoming
an apparent vital element toward accommodating the persistently rising population
(Meshenberg 1976, 1).
The procedure of dividing preexisting lots into one or more parcels through a
subdivision is a viable land use application implemented by land owners increasing
development capability. The concept of subdivisions also consists of lot line adjustments,
permitting two or more land owners to propose modifications to their boundaries. This
practical land usage scheme endorses landowners to draft and request the creation of feasible
lots applicable for development. This profitable system attracts families, entrepreneurs, and
public officials to directly purchase these lots to supplement their specific land use
modification. These ordinances are generally formulated by planning boards or private interests
and are primarily approved based on the intention that they will substantially benefit the
community. Each municipality establishes distinctive regulations on the site design, surrounding
streets, and utilities within the subdivision proposal. Ultimately, the intent of subdivisions
directly aims to expand and configure accommodative developmental projects to sustain the
persistent growth of communities (Meshenburg 1976, 33).
Before a proposed site plan of the project can be approved and implemented, the
developer must regard the regional mandatory setback ordinances before excavating the land.
These regulatory land use planning regulations are devised by local planning boards which
12
21. establish minimum distances a structure can be from a road, water body, floodplain or lot line.
The general distance these developments can be from these features ranges from 20 to 50 feet.
This preliminary process is determined through the particular setback line of the parcel and
depth of the front yard within the district regulation of the ordinance. Private residences are
generally enforced by considerably far setbacks to sanction increased privacy discouraging the
anguish between neighbors (Meshenburg 1976, 30).
Structures built before the twentieth century usually contains considerably low set
backs from the road, which is directly attributed from the lack of planning initiatives in that
time period. This ultimately equates to considerable issues inhibiting planners to enact road
widening projects to alleviate traffic congestion. Contesting these prominent dilemmas has led
to the pioneering of eminent domain allowing the town to seize private land to construct
feasible development projects that intends to benefit the community. Overall, these imperative
land use planning initiatives advocate efficient design measures to reduce conflicts
(Meshenburg 1976, 30).
B. Development Process
The process of modifying the natural landscape to erect viable structures is a relatively
complicated process requiring the mutual cooperation between land owners and administrative
officials. The overall purpose of establishing developmental endeavors is to introduce a
demanded and embraced ingredient into the community, consequently providing profitable
investment opportunities for the land developer. Although the ramifications of a development
can substantially attribute the rejuvenation of the economy, these schemes can only be
achieved based on the desired system of growth outlined by a specific town. In order for
13
22. landowners to accomplish this business venture, they contract a number of competent
designers and planners to formulate optimum alternatives inducing town officials to validate
their projects (Porterfield and Hall 1995, 3).
The preliminary step for land developers to meet their investment is to understand the
specific land use ordinances of the town and state clarifying the logistics of the development.
Once this is verified, a realtor group is hired advising the land developers to purchase suitable
land with extensive road frontage and minimal natural constraints. Once an enviable parcel is
identified, the land developer contracts a land surveying firm which then hires other competent
professionals ensuring the client the project will be a success (Porterfield and Hall 1995, 3).
To accurately portray potential conflicts and the design of the future development, the
land surveying firm generates a site plan with consideration toward mandated guidelines of the
town and state. These blueprints toward development validation are drawn to scale which
illustrate lot lines, abutting streets, building sites, open space, buildings, topography, wetlands,
parking, and utility lines of the proposed project. Generally the land surveyors require the
services of engineers to assist the production of private roads to supplement efficient
transportation within the development site (Porterfield and Hall 1995, 3).
State and town environmental officials require all parcels with intent of development to
have a preliminary test pit conducted to identify the level of land suitability. This process
requires soil scientists or septic designers to excavate and test soil samples for water content
and mineral composition. This ultimately determines the water table of the lot, which can act as
a deterring factor toward completing developments. This examination also identifies the
appropriateness for constructed septic systems to accommodate the high capacity of waste
14
23. products produced by the future patrons of the development. After the soils have been
analyzed for these environmental factors, the soil scientist concludes the extent of
development capability (Meshenburg 1976, 31).
If the soil is not a wetland, the site plan should be approved by the planning board and
the abutting land owners at a relatively low cost. However, remnants of soil that are a wetland,
pose a considerable task for the developer based on environmental regulations. One method of
combating this impairment is applying for a dredge and fill permit to fill in the wetland.
Accordingly, this sometimes obliges the developer to create a conservation easement within
another parcel preventing development in the future. Once these mandatory procedures are
approved, the land developer hires the services of a construction company to create the
desired structures. Overall, the extensive process of following these integral proceedings allows
communities to filter out unethical and unnecessary developments which could potentially
devastate the community (Meshenburg 1976, 14).
C. Principles of Smart Growth
The landscape of an American metropolis is an ever changing reflection related to
current trends in economy, population, and adequate living accommodations. The recent
inclination of people migrating to suburban settings has ultimately left a deteriorating impact
on the urban atmosphere. This recurring theme of urban sprawl has directly relinquished scores
of vacant lots, sapping inner city developments, unmaintained transportation routes, increased
poverty, low quality educational institutions, and leading to impairment of the general welfare
and considerable tax deficits. The idea and implementation of smart growth into American
cities has been the response of planners to the overlying problem of sprawling populations
15
24. (Daniels and Bowers 1997).
This concept was first implemented in the state of Hawaii in 1961, when the state was
divided into four land use categories including urban, rural, agricultural, and conservation.
Hawaii is a state where sprawl of communities is limited by the geographic location of the state
and overriding land uses. A considerable portion of the land constituting Hawaii is unsuitable
for development due to volcanic soils and activity. Due to the rapid population increase of
Hawaii, regional planners were obligated to adopt the concepts of smart growth compared to
the minuscule amount of land in other American states (Daniels and Bowers 1997).
Smart growth is intended to reduce if not eliminate population sprawl within
metropolitan boundaries. Smart growth has several key purposes, the first being limiting and
controlling the external expansion of new development to minimize settlements and their
impact on the surrounding area. The next purpose is to improve public transportation systems
as well as pedestrian walkways in order to reduce the use of private vehicles in and around the
town or city. Smart growth aims to divert public costs of new development onto users and
consumers, rather than the general community who may not utilize those facilities. This type of
planning has been widely implemented along roadways and bridges, instead of all of the tax
payers supporting the cost of the bridge or road, only the people who travel along the road pay
(Downs 2004).
The development of infill sites, the subdividing of public and private land as well as
revitalizing existing neighborhoods is another way smart growth reduces sprawl. Aesthetics, a
substantial attribute of smart growth, includes gateway design through planting trees, scrubs,
or flowers along streets, parks and sidewalks. This reduces the sense of enclosure and produces
16
25. a barrier to the street encouraging pedestrians and bicyclists to utilize these alternative means
of transportation. These key purposes are general implications of smart growth, however in
order for a city, town or metropolitan area to truly integrate smart growth, a specific set of
goals and purposes have to be tailored for the specific situation of the area. Overall, smart
growth is not set in stone; it is dependent upon the community and regional perspectives of an
area (Downs 2004).
D. Successful Corridor Studies
Successful corridor studies are the fundamental basis for enhancing transportation
measures and redeveloping lots adjacent to a particular portion of a highway. These planning
initiatives encompass a number of prominent factors prospecting valid recommendations
toward realizing the beneficial implications of development. The ultimate success of a corridor
study is directly related to the ample identification and implementation of solutions to promote
community efficiency.
The imposed challenges of traffic congestion and supplementing the economy of the
Davenport, Iowa, metropolitan area along a seven mile corridor along I-74 were adequately
identified to contend these imminent concerns. This planning initiative was a collaborative
effort first employed in 2000 by the Illinois and Iowa Department of Transportation. This stretch
of highway is heavily congested in both directions, particularly near the narrow bridges along
the Mississippi River and other tributaries. The recognized issues that were predetermined
include insufficient road design, roadway curves, limited sight range of drivers, absence of
shoulders on the bridges, minimal space between the various on and off ramps along the route,
narrow lanes, and increasing commuter times. This resulted in more than three times the
17
26. amount of car crashes compared to the average seven mile stretch in other American interstate
corridors (Iowa Department of Transportation and Illinois Department of Transportation 2000).
One form of addressing this concern was proposing viable pedestrian and bike
accommodations along the sides of the bridge to minimize traffic congestion. Another method
was dispersing traffic counters along various regions of the corridor to determine trends and
deviations in traffic flow. High numbers of traffic volumes indicated the regions of the corridor
needed to be addressed first to foster traffic efficiency. Future traffic counts were then
estimated to propose transportation enhancement projects to accommodate the inevitable
population growth. Other proposed improvements along the corridor include widening ramp
terminals, off ramps, and resurfacing sections of the byway. To date, only major transportation
issues were alleviated due to a set annual funding through transportation departments of the
two states. As the years pass these planning initiatives will be completed along sections of the
corridor to supplement the economy and transportation of the Davenport metropolitan region
(Iowa Department of Transportation and Illinois Department of Transportation 2000).
Another successful transportation and economic revival scheme was the Route 101
Wilton, Milford, and Amherst corridor study completed by the Nashua Regional Planning
Commission. The initial goal was to identify the repercussions of traffic congestion throughout
this corridor by assessing traffic volumes, pedestrian and bicycle accommodations, economy,
land use and regulations, natural constraints, and physical attributes of the corridor. Some of
the prominent issues identified include suitable infill sites, specific sections of narrow
roadways, and conflicting conservation land. After analyzing these notable concerns of the
corridor, a number of feasible recommendations were proclaimed to foster traffic efficiency
18
27. and foster development of the Souhegan Valley (New Hampshire Route 101 Corridor Plan
Amherst, Milford, Wilton Final Report 2002).
One noteworthy improvement project was constructing adequate overpasses and road
reconfiguration projects. Appropriate traffic management for heavily congested areas included
installing traffic lights and rotaries. The construction of bike lanes along the shoulder and
widening sidewalks in various portions of the corridor were advocated to promote the
utilization of alternative means of transportation. Gateway accessibility projects including
dispensing trees, flowers, and stone walls along segments of the corridor were recommended
to augment the beautification of the region. The portion of land encompassing the BROX
property in Milford was suggested to be rezoned from residential A to intergraded commercial
industrial to maximize development potential. Ultimately the relative costs of these immense
public works projects were outlined by the Nashua Regional Planning Commission for state and
town officials to potentially adopt these integral enactments (New Hampshire Route 101
Corridor Plan Amherst, Milford, Wilton Final Report 2002).
Overall, these effective planning principles advocate the vigilant evaluation of
development within a particular municipality. A number of these recommendations are taken
into consideration when devising effective methods of mitigating traffic congestion and
capitalizing on developmental endeavors along the corridor. A number of these facts are
incorporated as beneficial resources throughout the duration of the South Street/RTE 13 South
Corridor Study and Plan. Ultimately, these viable sets of information formulate a rendition of
the developmental potential of this byway.
19
29. The overall complexity of contemporary Milford, New Hampshire, has been directly
attributed to the numerous historical events, inhabitants, and initiatives which have ultimately
shaped the existence of the town. To accurately convey these accounts, a comprehensive
analysis and interpretation of these feats is purveyed. Sufficient background information
pertaining to the progression of New Hampshire is analyzed to validate the current origin and
administration of Milford. Before an inclusive explanation of the overall foundation of Milford
can be attained, a proper examination and visual illustration of the physical components of the
region is interpreted.
A. Relative Location and Geography of Milford
Milford is located within the central portion of southern New Hampshire and
Hillsborough County and encompasses a total of 25.4 square miles. Milford is strategically
located 11 miles from Nashua and 16 miles from Manchester, which has had an immense effect
on the development of the town. The towns abutting Milford include Brookline, Amherst, Mont
Vernon, Mason, Hollis, Wilton, and Lyndeborough. The village districts of South Milford, East
Milford, and Richardson constitute Milford with distinctive administrative authority over the
entirety of the town. Another regional characteristic of Milford is its situation within the
Souhegan Valley of central New Hampshire. This physical classification of Milford ranges from
roughly 814 feet at Boynton Hill to 200 feet located within the central portion of town. The
relative location of Milford is illustrated by Figure 4. The detailed map of downtown Milford
portrays the integral economic, cultural, and crossroads hub of the town (The Milford Civic Club
1940, 3-32).
21
30. Figure 4 Relative Location of Milford, New Hampshire.
The main drainage basin for Milford is the Souhegan River, a tributary of the Merrimack
River that flows in an easterly fashion. One noteworthy tributary of the Souhegan River within
the premises of Milford is Great Brook, which empties into the Souhegan River near Union
Square. The relative topography of the river banks is steep, which has produced a
predominance of fertile soil. These nutrient rich soils have directly influenced the diverse lush
forests, meadows, and agricultural flora encompassing Milford. The main geologic composition
of Milford is deposits of igneous granite rocks buried beneath the crust. Figure 5 illustrates the
water table of the Souhegan River during the peak of autumn. This prime example of the
22
31. importance of a river permitting a thriving agricultural oriented society was the basis for the
settlement patterns of the first colonists of New Hampshire (The Milford Civic Club 1940, 11).
Figure 5 Upper Souhegan River in Autumn (Source: Authors 2009).
B. The “Mil” in Milford
The first solidified settlement within present day Milford occurred in 1741, with the
grant of a 500 acre parcel to the heirs of veterans serving in the Narragansett War. The first
inhabitants of present day Milford called their new home Narragansett Three or Souhegan
West settled on the banks of the Souhegan River after a long expedition in 1738. One
prominent forefather of this region was carpenter John Sheppard, who was commissioned by
the citizens to build a gristmill and sawmill on the banks of the Souhegan River in exchange for
121 acres. The proximity of a ford in the river adjacent to the Sheppard Mill eventually
influenced the coining of this region as Milford. The pioneering of the waterwheel in the mid-
23
32. eighteenth century allowed the force of the river to be manipulated to essentially turn gears
powering mechanisms. Like many other towns in New England, Milford utilized the power of
water to establish saw and grist mill endeavors. This provided the town with precisely split
boards and crushed agricultural products to accommodate the growing population (Ramsdell
1901, 284-287).
The journey of the shift from a mercantile trading and farming society of Milford to a
profitable manufacturing industry had a monumental impact on the economy of this town. The
innovative concept of mass producing products efficiently and effectively was directly
attributed to the Industrial Revolution. Milford initially adopted this concept in June 1814 with
the construction of “The Cotton and Woolen Manufacturing Company” which would boost the
economy of the town for the next century. This noteworthy event initiated the erection of
numerous cotton mills along the Souhegan River to spur completion and produce an abundance
of clothing for trade. These immense textile mills required scores of labor to meet quota
essentially attracting thousands of people to labor and reside within the premises of Milford
(Ramsdell 1901, 284-300).
One notable cotton factory located in Milford in the eighteenth century was “The
Souhegan Cotton Mill”. This iconic mill was established in 1848 along the south side of the
Souhegan River and soon became one of the leading contributors toward the economy of
Milford. The workers of this once vital industry constructed a number of the buildings within
the proximity of this mill which are still apparent to this day. One of the most recognizable
concerns of cotton mills was inadequate safety ordinances, ultimately leaving the Souhegan
24
33. Cotton Mill in ashes. The physical appearance of this generic mill circa mid-eighteenth century
is depicted by Figure 6 (Thompson 2002, 28).
Figure 6 The Souhegan Cotton Mill, Circa Mid-Eighteenth Century (Source: Thompson
2002).
During the latter half of the twentieth century, nearly all manufacturing mills within
Milford went out of commission due to foreign competition. The unhealthy dust, humidity, and
occasional accidents in the textile mills also contributed to the demise of these once prominent
economic capstones. Although this industry is no longer a vital component of the economy of
Milford, the historical mark left on the landscape remains to this day. A number of the
manufacturing mills within Milford have either been dismantled, leaving the remnants of the
foundation, or have been adaptively reused to compensate for their large size and amenities. A
quick glimpse into Union Square reveals a number of these historic landmarks. The illustration
25
34. of the foundation of a mill along Great Brook within Figure 7 portrays the relative mark of this
dominant industry once ensued (Wright 1979, 232-234).
Figure 7 Remnants of Mill along Great Brook (Source: Authors 2009).
C. The Birth of the “Granite Town”
Another crucial economic factor which facilitated the development of Milford was the
exploitation and extraction of abundant granite vessels beneath the soil. Before 1810, only
small deposits of granite had been harvested for the underpinnings of bridges and walls
throughout town. The first major discovery of granite influenced landowners throughout
Milford to excavate the earth to find the precious ore below. However, inadequate
transportation routes within Milford undermined potential trade value of this commodity
(Ramsdell 1901, 298-300).
26
35. The completion of the Wilton Railroad Line in 1850 permitted mass quantities of granite
to be efficiently transported to various regions of the United States substantially increasing the
economy of Milford. Author Winifred Wright claimed that “It has been said that there is hardly
a city or town in the United States that does that contain some Milford granite in the form of a
statue, monument, building, stone or trim, curbing, or paving blocks in the street” (Wright
1979, 205). The magnitude of this compelling statement advocates the tremendous impact the
granite industry had on Milford. The high demand for this chopped and polished product
attracted thousands of workers to reside in Milford. The predominance of granite has a direct
impact of nicknaming Milford the “Granite Town of the Granite State” (Wright 1979, 205-208).
During the peak years of operation, between 1890-1930, there were more than 20
commissioned granite quarries. One prominent granite quarry in Milford was the Lovejoy
Granite Quarry established in 1894. The quarry was abandoned in 1950 once a substantial
portion of the quarry was depleted inheriting the company with financial woes. Along with the
demise of the Lovejoy Granite Quarry during the latter years of the twentieth century, a
number of the other granite ventures were succumbed to depleted resources and financial
turmoil. There is currently one functioning granite quarry left in the once flourishing granite-
enriched community. Although this once iconic symbol of Milford is nearly depleted, the legacy
and importance toward developing the town of Milford will live on (Wright 1978, 219).
D. Commercialization of Milford
After World War II, the economic contributors of Milford changed to fill the void left by
the declining granite and textile industry. At the same time, the population throughout the
country expanded with the return of soldiers, causing a demand for affordable housing.
27
36. Improvements in infrastructure across the United States had a major impact of suburban
developments, and led retail businesses to be built in the suburbs to accommodate these new
developments. The pioneering of one-stop shopping centers was conceived after commercial
zoning was introduced to confine environmental pollution, bright lights, and traffic congestion
into a single location. Land owners along these new efficient transportation routes sought to
subdivide and sell their land to developers to create these retail endeavors.
The concept of one stop shopping involves an open area of shops which are arranged in
rows with sidewalks and large parking lots to serve their patrons. These community oriented
shopping centers permit convenient shopping because they are generally located roughly ten
minutes away from all locations in a town. These shopping centers generally have a large
anchor store and numerous smaller stores specializing in a wide array of retail commodities.
Developers examine traffic counts, ecology, population, access, shape of the site, driving time
to site, and regional economy as crucial considerations toward developing land. The strategic
position of Milford and location of the transportation routes allowed this small town to flourish
into a prominent anchor town attracting people from a number of smaller towns requiring
these services (Hines 1985, 41-55).
The improvement in traffic access along Elm Street/RTE 101A during the mid twentieth
century reduced traffic congestion in this region and increased the usage of traveling west to
RTE 101 and east toward Nashua. This road construction permitted developers to capitalize on
the prospective development schemes of the vacant land adjacent to this road. The Town of
Milford changed the zoning in this area to mixed land use to encourage landowners to
subdivide and sell their land to developers. Prospective development ventures in Milford
28
37. increased tax revenue, essentially boosting the budget of the Town of Milford. The first
commercialized development in Milford was “The Milford Shopping Plaza” constructed in 1956
along Elm Street/RTE 101A. The success of the Plaza attracted a number of other developers to
build shopping plazas, restaurants, and service industries along this byway. These compact
shopping endeavors allowed the local citizens of Milford to conveniently indulge in the diverse
shops within the area. These businesses further supplemented the growth of Milford by
drawing in citizens from smaller towns around Milford to participate in shopping. This region of
Milford continues to blossom with commercial business to this day which ultimately enhances
the economy of Milford (Wright 1978, 59-355).
Another industry which propelled the economy of Milford in the latter half of the
twentieth century is the machine shop industry. The first machine shop was established in
Milford in 1949 with the construction of the O.K. Tool Company. As the years passed, this
organization merged with other regional machine shops to increase their revenue and
economic influence in Milford. They specialized in a wide variety of tools including grinders,
cutters, and automobile parts. This successful venture sparked a number of other machine
shops to be established in Milford, which continues to bind the economy of the town together
(Wright 1979, 236-238).
An important machine shop within Milford is the Hitchiner Manufacturing Company,
headquartered along Elm Street/RTE 101A. The company utilizes the business tactic of precision
investment centered on cost saving abilities to ultimately produce a wide variety of metal
products. Hitchiner Manufacturing employees 750 people, making it the largest employer in
Milford (NH Community Profile 2009). The Gas Turbine Operation Sector of this successful
29
38. venture is depicted in Figure 8. As long as this vital economic contributor continues to thrive,
Milford will endure a reliable source of employment and revenue (Wright 1979, 237-239).
Figure 8 Hitchiner Manufacturing Co., INC Gas Turbine Operation Sector (Source: Authors
2009).
The current industries contributing to the economy of Milford are ultimately dependent
on the demand and overall importance of these products. Table 1 illustrates the top 10
employing organizations in Milford. Five of these organizations are machine shops, the other
five industries are considered service based which also plays a major factor in the functioning of
Milford. The Town of Milford has experienced great changes in the past two hundred years
which has contributed to the overall complexity of its contemporary society. The relative
stability of the economic base of Milford throughout history has been directly based on the
ability to adjust and diversify industry bases to compensate for declining economies. Overall,
30
39. these integral industries will continue to attract customers from around the Souhegan Valley
via their invaluable services and products.
Table 1 Top Ten Employing Companies in Milford.
Year
Company Name Product/Service # of Employees Established
Hitchiner Ferrous/Non-Ferrous 750 1946
Manufacturing Castings
Milford School District Education 200 1794
Alene Candles Candles 185 1995
Hendrix Wire & Cable High Voltage Power Cables 180 1957
Norton Company Industrial Ceramics 160 1957
Harborside Healthcare Elder Care Service 145 N/A
Spear Pressure Sensitive Labels 90 N/A
Hampshire Paper Paper 90 1978
Corporation
Airmar Technology Ultrasonic Transducers 80 1981
Corparation
NPC, Inc. Diamond Tools and Coring 80 1972
Source: New Hampshire Community Profile (2009).
While contemporary Milford is the focal economic hub of the Souhegan Valley, Milford
Community Development Director Bill Parker has identified a number of factors hindering
development. The current economic crisis of the United States has had an immense affect on
the development of new homes, commercial and industrial developments in Milford. New
family residential building permits decreased from 30 in 2007 to 21 in 2008. To combat these
economic foes, the Town of Milford Community Development completed a number of planning
accomplishments in 2008 in attempt to revitalize the economy and foster development in
Milford. Ultimately, as the population and demand for necessary commodities inevitably
increase over time, this town will enact these measures to sustain the growth of the Granite
Town (Town of Milford Annual Report 2009, 23-24).
31
41. Population growth of this region has been directly attributed to migration, economy,
and a consistent increase in natural growth. Analysis of these key contributors will be conveyed
through graphical representations of population growth trends in New Hampshire and Milford
1800-2020. Another component outlined in this section is the shifting urban and rural patterns
throughout these years with comprehensive analysis of each impending factor. The estimated
population for the decades of 2010 and 2020 of the two political regions is interpreted to
disclose the inevitable growth of the future. Overall, this section is simplified into three time
periods allowing extensive analysis of the population trends for these two regions.
A. Analysis of Population Trends 1800-2020
Examination of population trends in New Hampshire 1800-1899 reveal that the
population in New Hampshire was increasing at a stagnant pace due to a relatively high rural
population attributed to inadequate transportation inhibiting large scale communities to
flourish. The birth of the Industrial Revolution ultimately changed the perspective of migrating
from rural to urban areas to labor in the mills of cities. A considerable amount of these laborers
were immigrants from Europe and Canada seeking a new life in the United States. However
after 1840, New Hampshire would receive an important means of transportation that would
allow a massive expansion in migrating and population increase (Hobart 1985, 6-15).
The first railroad tracks laid in the Granite State occurred in 1836 with the Lowell line
frequently stopping in Nashua and Manchester. This monumental event influenced the
construction of other lines linking the higher populated cities to the desolate regions of New
Hampshire. The magnitude of importance from the railroad directly impacted the urban
population of New Hampshire to dramatically rise from 3.3% in 1800 to 10% in 1840. This
33
42. increase in urbanization was directly related to the demand for workers to labor in these
manufacturing plants to increase production of commodities. These stable and profitable
organizations within the cities influenced the urban population in New Hampshire to increase
from 10% in 1840 to 47% in 1890. Overall, there was a 2143% increase in population between
these two time periods which would solidify the foundation of New Hampshire in the twentieth
century (Hobart 1985, 6-15).
Analyzing the overall population trends between these two geo-political regions 1800-
1899 reveals that Milford experienced a slightly slower rate of population than New Hampshire
in general. The relative size of the Souhegan River as a tributary of the Merrimack River
inhibited a high number of mills to thrive along the banks due to lower amount of water flowing
to power the equipment. However, Milford experienced a 298% population increase in this
time period (Hobart 1985, 6-15).
Examination of population trends in New Hampshire 1900-1949 discloses that within
this time period population increased at a minimal pace due to the decline of the
manufacturing industry in the state. The demise of this once prominent industry was directly
related to the rapid industrialization of the southern United States with attractive benefits and
cheaper methods of processing goods. This resulted in a high emigration of New Hampshire
residents to venture south to begin a new life. The Great Depression was another notable
contributor leading to families bearing fewer children relating to the rising cost of living (Hobart
1985, 17-20).
Comparing trends in population between New Hampshire and Milford 1900-1949
reveals that Milford has a slightly slower rate of population growth. The granite and textile
34
43. industry which once supported the economy of Milford was rapidly declining due to national
competition. This halted the immigration to Milford and an out flow of residents moving to
other regions of the country. Overall, there was an 11% increase in population between these
two time periods. Although the developmental trends of these two regions were in a
considerable state of demise, the drastic social and economic changes following the Second
World War would essentially increase these assets of the regions (U.S. Census Bureau 2000).
Following this monumental event, the major contributor to this massive population
influx was the rapid rise in young population, known as the Baby Boom era, persisting from
roughly 1946 to 1964. Ultimately this caused an expansion of urban areas into rural areas with
rapid housing developments. This drastic change in rural to urban population was quite evident
in New Hampshire with the increased development of many of the smaller towns. An accurate
concept of urbanization, according to the United States Census Bureau, includes all areas over
50,000 and clusters of 2,500-49,000 inhabitants (U.S. Census Bureau 2000).
The illustration of percent population change in New Hampshire 1950-2000 within
Figure 9 vividly displays the rapid suburbanization of the Granite State. A considerable number
of towns in southern and central New Hampshire experienced a relatively high percent
population change during this time period. Although this figure reveals that these towns are
rapidly expanding, they experienced a population change of a few thousand inhabitants which
attributed to a high percent population change. Further analysis of Figure 9 reveals that the
heavily populated cities of Nashua and Manchester experienced a relatively low percent
population change. Although these graphical representations may convey these cities are
declining, they experienced a demographic change of over twenty thousand new residents
35
44. attributing to a relatively low percent population change. Overall, the urban population of New
Hampshire decreased from 57% in 1950 to 51% in 2000 (U.S. Census Bureau 2000).
Figure 9 Percent Population Change in New Hampshire 1950-2000.
(Source: U.S. Census Bureau 2000).
36
45. Analysis of population trends in New Hampshire 1950-2020 reveals that population
trends within this time period increased substantially due to a considerable high birth rate and
immigration. The construction of interstate and major state roads in New Hampshire directly
influenced the higher populated states of New England to migrate to the Granite State. These
individuals were seeking to escape the congested life in the cities and were attracted to the low
taxes of the state. Another impending factor of the rapid percent population change was the
construction of high tech industrial parks situated in southern New Hampshire. This resulted in
the construction of family oriented developments in southern New Hampshire from the high
influx of job opportunities permitting people working in Massachusetts to commute to work.
The 2010 and 2020 estimated population in New Hampshire calculated by The New Hampshire
Department of State Planning essentially conveys that this region will persistently rise in the
number of inhabitants due to these notable factors. Examination of Figure 10 reveals a 163%
increase in population in these time periods which is directly related to these ensuing
demographic trends (Hobart 1985, 22-29).
Examination of population variations in New Hampshire and Milford 1950-2020 reveals
that that Milford experienced an even faster rate of change population compared to New
Hampshire in general. During this time period, Milford saw a rapid increase in commercialized
retail business and industrial parks, contributing to increased population. The proximity of
Milford to the Massachusetts border, substantially contributed to the 321% population
increase. These individuals were also attracted to the relatively low property tax and lack of
income tax in the Granite State. Figure 10 and 11 depict these population changes (U.S. Census
Bureau 2000).
37
46. Figure 10 Historical Population Trends in New Hampshire 1800-2020.
(Source: New Hampshire Department of State Planning 2009).
Figure 11 Historical Population Trends of Milford 1800-2020
(Source: Population History of Milford 2009).
38
47. B. Age/Sex Structure of New Hampshire and Milford
The demographic characteristics pertaining to a specific society are directly linked to
social aspects, the economy, and health aspects. The magnitude of these attributes signifies the
relative level of development directly linked to the overall age and sex composition of the
society. One method for visually portraying these differences is devising population pyramids to
compare the age and sex statistics of the society. These graphs essentially disclose these trends
by classifying the percentage of people within each applicable gender into the explicit age
category. The overall appearance of these generated age-structure diagrams indicates the
relative growth of the population through the fertility and mortality rate of each age cohort. To
present an accurate depiction of this demographic model, the production of population
pyramids contrasting the 2000 age/sex structure of New Hampshire and Milford reveal these
potential deviations (Cutter and Renwick 2004, 95).
The age/sex structures depicted within these figures reveals a relatively constrictive
shape displaying lower percentages of younger people on the bottom with slightly higher
numbers of older populations on top of the pyramid (Cutter and Renwick 2004, 95). According
to the United States Census Bureau, there were 1,235,786 people living within New Hampshire
during 2000. Figure 12 resembles a relatively constrictive shape with a few notable outliners. A
majority of the population depicted in this pyramid reveals that most of the residents of New
Hampshire are between the ages of 30-54. One perceptible outliner was the population
between the ages of 20-29 was slightly lower than the abutting age category. The overall
scheme of this graphical representation reveals that New Hampshire will contain considerably
more people on top and less people on bottom within the next 10-30 few decades. This is a
39
48. result of the baby boomers living longer due to the advancement of modern medicine.
Ultimately, Figure 12 reveals that New Hampshire is experiencing a slight population increase
due to the social acceptance of bearing fewer children and an influx of migrants (U.S. Census
Bureau 2000).
According to the United States Census Bureau, there were 13,535 residents in Milford in
the year 2000. Analyzing the shape of Figure 13 reveals that the age/sex structure of Milford
follows a similar pattern with minor exceptions. One noteworthy distinction is people between
the ages of 20-24 are substantially lower than the same age group for New Hampshire.
Inhabitants of Milford between the ages 30-44 are also considerably higher compared to New
Hampshire, implying that the Granite Town will be composed of an older generation within the
next 10-30 years. Overall, the comparison of the age/sex composition of Milford and New
Hampshire discloses that Milford is experiencing a slight population growth with a slightly older
population (U.S. Census Bureau 2000).
The persistent population expansion in this region has resulted in a number of varied
implications directly related to these new residents. The several decades of this demographic
explosion has resulted in the increased development of land, education, affordable housing,
infrastructure, and ample workers sustaining the crucial industries. These necessities have been
made possible by increased tax revenue permitting state and local agencies to implement
effective planning measures. Ultimately the ability of identifying issues from this rising
population by community planners will allow the Granite State to successfully accommodate
these beneficial building blocks of the future.
40
49. Figure 12 Age/Sex Structure of New Hampshire.
(Source: U.S. Census Bureau 2000).
Figure 13 Age/Sex Structure of Milford.
(Source: U.S. Census Bureau 2000).
41
51. A. The Milford Oval
The iconic New England common, situated within the center of town, symbolizes the
heart of a community serving as an optimum location for prominent events, access to shops,
and linkage to transportation routes. Commons are generally designed in a concentric manner
with a beautified public park including monuments, picnic benches, and bandstands endorsing
community involvement. They are surrounded by a rotary connecting the major transportation
routes of a town. They are generally state or prominent local roads anchoring residents to
utilize these imperative means of infrastructure and commercialized shops. Numerous
pedestrian friendly sidewalks abut the curb permitting access to local shops, administrative
buildings, and branch alongside major roads reducing traffic congestion. Overall, these
traditional urban design structures are the focal economic, transportation, and event hub of a
New England community (Calthorpe 1993, 91).
Milford is no exception to this general theme of New England landscape containing a
town common nicknamed the Oval. The land constituting the Oval was originally a gift to the
town in 1784 by William Crosby, enabling the public to maintain a common meeting place for
events, administrative buildings, and prime economic contributors. This rotary comprising the
Oval links the major transportation routes of Milford together with a number of pedestrian
friendly accommodation to alleviate traffic. The illustration in Figure 14 portrays the physical
appearance and structure of the Oval in a summer afternoon. Since the creation of the Oval,
there have been numerous annual events which have ultimately developed the identity of the
Granite Town (Wright 1979, 451).
43
52. Figure 14 The Milford Oval During Summer (Source: Authors 2009).
Indulging in local events broadens the comprehension of the culture and tradition of a
specific community. Some noteworthy methods of this enrichment process include attending
community yard sales, plays, sporting events, parades, and listening to the music of local artists.
These events are generally sponsored by the town government and nonprofit organizations
which articulate these means of spreading local pride to the onlookers. There are a number of
these events sponsored by a wide array of participants who ultimately bind the community and
draw in money from tourists.
One utilization of the centralized location of the Oval is the annual Fourth of July and
Labor Day parade celebrating the freedom of America. The bandstand within the Oval is home
to a series of yearly concerts lead by local musicians and artists. One of the most attractive
events is an abundance of Christmas decorations and lights ultimately spreading the holiday
44
53. spirit to the spectators (Wright 1979, 455). The highly anticipated Milford Pumpkin Festival is
one of the most popular events held within the confines of the Oval. This event symbolizes the
fall harvest with vivid displays of jack-o-lanterns, corn, gourds, and stalks of wheat. Some of the
notable events of the annual Milford Pumpkin Festival include pumpkin painting, pumpkin
catapulting, pumpkin weigh in, live music, haunted hay rides, and scary movies shown at the
legendary Amato Center. Overall, this captivating event binds the community together and
brings in a considerable amount of capital from the thousands of spectators celebrating the
spirit of autumn (Milford Do-IT 2009).
B. Existing Transportation Routes in Milford
Transportation is one of the most important components of a society allowing
communication, commerce, and travel between various regions. The incorporation of
transportation networks within Milford has essentially allowed this small town to develop into
a vibrant town over the course of time. Maintained roads are the main mode of transportation
within Milford allowing these important aspects to function. The main intersection of roads
within Milford is the Oval connecting RTE 101A/13 together. Another major route in Milford is
RTE 101 located at the southern end of town and is considered the main throughway for
eastern and western travel in New Hampshire. These highways are essentially easements
owned and maintained in trust by the State of New Hampshire for the public to utilize. The New
Hampshire Department of Transportation classifies these roads as Class II roads that are
essentially secondary state highway systems. These roads usually contain segments of two to
three lanes and permit high speed travel to decrease traffic congestion. These transportation
routes are typically intended for nonlocal passengers who seek quick and efficient means of
45
54. transportation through towns. These roads play a considerable role in connecting the people of
Milford to various regions of the country (Local Government Center 2004, 56).
Milford also contains of a number of Class V, or local roads, which are classified by the
NHDOT as town owned and maintained roads. These roads are ordinarily located within
residential regions of the town enabling local passengers to venture to other regions of the
town. These roads usually contain two lanes with an enforced speed limit of 30-40 miles per
hour to promote safety in these residential regions of town. The illustrations of the numerous
varieties of roads within Milford are depicted within Figure 15. Ultimately, these vital
transportation routes of Milford allow passengers to travel efficiently travel to regions within
the town and beyond (Local Government Center 2004, 57).
Figure 15 Existing Transportation Routes of Milford.
46
55. C. Development of Case Study Street
South Street as it is called today is known to have existed prior to 1787, at which time it
was identified as “the Road to Brookline”. The records for the town illustrate South Street
commencing south from what is currently Union Street to about where Union Street presently
intersects South Street. The road then followed Old Brookline Road to the intersection of
Melendy Road; after there the road continued where Ruonala Road is all the way to Brookline,
New Hampshire. After about 85 years, several straightening and renaming efforts the “Road to
Hollis” also called “Water Street” was officially renamed by the board of Selectman on March
12, 1872, to be South Street (Town of Milford Road List N-Z 2001).
South Street endured several more changes before it reached the current state it is
today. On January 23, 1948, South Street no longer would intersect Union Street, the selectman
decided that it would continue to the intersection of Federal Hill Road. As of 1953, RTE 13 was
constructed in order to create a direct connection road between Union Square and the
Brookline border (Town of Milford Road List N-Z 2001).
The RTE 101 bypass was constructed along South Street/RTE 13 South to enhance
transportation efficiency within this region. This monumental event ultimately encouraged
landowners to subdivide their land for the construction of numerous single family homes. The
strategic location of Milford and accommodative transportation route spurred developers to
create mass commercialized businesses along this route in the late twentieth century. This was
essentially a result of portions of this corridor being rezoned to encourage development to
facilitate the economy. The relative physical appearance of South Street/RTE 13 is visually
conveyed in Figure 16. Overall, this historic linkage of the major northern to southern byway in
47
56. Milford is poised to be subjected to increased development and road maintenance due to the
strategic location within New Hampshire (Bill Parker, Personal Communication, 2009).
Figure 16 South Street/RTE 13 South and RTE 101 Intersection (Source: Authors 2009).
The Town of Milford will likely grow at a moderate pace, based on the increasing
demand for residential, commercial, and industrial development. Furthermore, this will relay a
substantial amount of stress within the South Street/RTE 13 South corridor due to the
increasing consideration of high developmental potential. Without adequate planning
measures, this concern could ultimately relinquish scores of unpractical development,
pedestrian safety, roadway capacity, road maintenance, and traffic congestion. Ultimately,
identification and implementation of these existing concerns will direct the Town of Milford in a
positive direction.
48
58. The connection between transportation routes, land use, and the environment is an
important consideration in the redevelopment of any corridor. Analysis of these conflicting
factors by constructing land use plans can reveal feasible solutions toward prospering the
economy of a region. This procedure will be replicated for the South Street/RTE 13 South
corridor and plan to devise and prospectively implement an effective land use plan. This
proposal aims to accommodate the persistent growth of the community by identifying existing
land use ordinances, uses, natural constraints, and value of the parcels abutting the corridor. A
comprehensive analysis of these elements will potentially disclose trends, deficiencies,
locational and spatial characteristic for specific regions of the corridor. Overall, the resultant
factors of this land use guide will ultimately provide realistic development capacity solution for
the Granite Town (Nashua Regional Planning Commission 2006, IV-1).
A. Existing Land Uses and Regulations
The land use regulations formulated by the Town of Milford Planning Board aspire to
promote the public health, safety, morals, and general welfare of the inhabitants of Milford.
The determining factor in solidifying these eminent privileges is weighing the current land
usage to establish definite zoning districts deterring possible conflictions. The current zoning
districts of Milford include commercial, industrial, intergraded commercial-industrial, limited-
commercial, residential A, residential B, and residential R. The existing zoning, subdivisions, and
setback ordinances manipulating land usage varies depending on each zoning district. These
land use regulations are outlined in Appendix A to properly identify restrictions on
development capability in the future. This classification system limits the impingement of new
developments from interfering with extant developments, fulfilling the preservation of the
50
59. small town atmosphere of Milford. The examination of existing zoning regions constituting
tracts of land adjacent to the South Street/RTE 13 South corridor aims to reveal the restraining
factors toward future development endeavors (Procos 1976, 6-8).
The largest zoning district encompassing these tracts of land is commercial dominating
either side of the corridor extending south of the Oval to the RTE 101 overpass. Beginning at
the RTE 101 intersection to Colburn Road is predominately intergraded commercial-industrial
zoning with two residential R zoning districts parcel outliers. This district then follows the side
of the intergraded commercial-industrial district down to the Brookline town line of either side
of the corridor. The importance of these two zoning districts being located relatively close to
the corridor permits potential fiscal economic opportunity due to the relative location of RTE
101 and the citizens of the residential R district (Town of Milford Planning Department 2009,
20-35).
One noteworthy exception zoning regulation pertaining to this corridor outlined in
ordinance 10.02.04, is the restriction of constructing self storage units in residential R district.
All self storage units site plans seeking approval by the planning board must be located 50 feet
from the lot line, contain a 15 foot landscaped buffer, and be considered outside storage units.
Figure 17 color coordinates the various zoning districts of the South Street/RTE 13 corridor with
the abutting parcels to analyze the current trends in prospective development schemes.
Overall, the mandated zoning districts within the tracts of land adjacent to the corroder reveals
a relatively segregated land use design to protect the general welfare of the community for
years to come (Town of Milford Zoning Ordinance 2009, 227-128).
51
60. Figure 17 Zoning Districts of Milford.
The relative complexity of the land utilization within a specific municipality is directly
attributed to the extent of development limitation administered by town officials. Analyzing
trends and variations of land usage among parcels abutting a particular corridor can ultimately
locate suitable infill sites and realistic subdivisions endorsing supplemental economic
endeavors. The process will be replicated for the proper identification of the current land usage
of parcels adjacent to the South Street/RTE 13 South corridor. Ultimately this prospectively
determines suitable sites which will be a necessary component to accommodate the growth of
the region.
Examination of the existing land usage of parcels adjoining this limited access byway
reveals substantially diverse schemes. The prominent land functions within these parcels
52
61. include commercial, industrial, multifamily residential, permanent open space, recreation,
municipal facility, single family residential, and vacant. The relative land use designation
between the Oval and Lincoln Street reveals a major concentration of multifamily residential
and commercial parcels. The two elongated parcels just before Lincoln Street is an abandoned
railroad track also serving as a pedestrian utilized trail (Town of Milford Department of Planning
and GIS 2009).
The land usages extending downward from Lincoln Street parallel to Phillips Way are
dispersed with commercial, municipal facility, single and multifamily residential. These lots are
considerably larger than the preceding portion of the corridor based on the interests of single
families demanding a higher sense of enclosure. Three parcels running adjacent to the byway
are owned by the Town of Milford which is also the headquarters of the Public Works
Department. Figure 18 depicts a vacant lot just north of the RTE 101 intersection (Town of
Milford Department of Planning and GIS 2009).
Figure 18 Vacant Lot Just North of RTE 101 Intersection (Source: Authors 2009).
53
62. The overall land use composition of the parcels abutting the corridor parallel to Phillips
Way toward the RTE 101 overpass, are mainly concentrated with large tracts of single family
residential, vacant, permanent open space, and commercial. These parcels are generally
undeveloped containing dense forest cover increasing the potential for developmental
endeavors. The permanent open space abutting RTE 101 contains the 12 acre Smith Well Site
which is a privately owned parcel (Town of Milford Department of Planning and GIS 2009).
The land use designation of lots abutting the corridor from the RTE 101 bypass to
Colburn Road consist of commercial, industrial, single family residential, and recreational. The
immense recreational tract of land situated near the RTE 101 intersection is the Burns Rock
property which serves a wide array of outdoor activities. Figure 19 displays a single family
residential home located near Colburn Road. Overall, these parcels all contain considerable
extendable road frontage which could be a suitable location for future development (Town of
Milford Department of Planning and GIS 2009).
Figure 19 Single Family Residential Home Near Colburn Road (Source: Authors 2009).
54
63. The final examined land usage of the parcels abutting the corridor runs from Colburn
Road to the Brookline town line. The predominant land usage within this segment is designated
single family residential and permanent open space. There are also parcels with the land usage
commercial, multifamily residential, and vacant. The one commercial tract is a farmstand which
was approved for incorporation into the overwhelming single family residential land usage
sector (Town of Milford Department of Planning and GIS 2009).
A number of the lots within this section are extensively narrow and protracted which
poses a presenting difficultly to enact subdivisions. Table 2 portrays the specific number of
parcels and acreage of each designated land usage. The color coordinated land usage of all
parcels along the corridor is depicted in Figure 20 and 21 to reveal the overall diversity of land
utilization along the corridor. The examination of the overall scheme of land usage abutting the
corridor reveals a proportion of single family residential and recreational dominated landscape.
Overall, the variations and trends concerning the existing land usage encompassing the parcels
abutting this corridor discloses the extent of the development potential within this region
(Town of Milford Department of Planning and GIS 2009).
Table 2 Land Use Statistics of Parcels Abutting Corridor
Land Use # Parcels Acreage
Single Family Residential 51 118.6
Commercial 35 57.7
Multi Family Residential 24 21.8
Vacant 11 32.4
Permanent Open Space 5 66.2
Municipital Facility 4 17.3
Recreation 3 94.8
Industrial 3 6.5
Total 136 520.5
Source: GIS Maps and Data (2009).
55
64. Figure 20 Existing Land Usage North of RTE 101 Intersection.
Figure 21 Existing Land Usage South of RTE 101 Intersection.
56
65. B. Natural Constraints Inhibiting Development
The interaction between humans and the natural environment can result in a negative
impact on these resources. To mitigate the extent of these detrimental effects, environmental
organizations have enacted action plans to properly utilize and sustain these crucial amenities.
As the population of Milford increases, the demand for optimal developable parcels encourages
land owners to capitalize on the natural environment for profit. Although a specific lot may
contain considerable road frontage and suitable space for developments, natural constraints
dominating the landscape can substantially diminish the opportunity for this endeavor to be
ratified (Wolf 1982, 252-260).
One prominent resource receiving protective rights from land development are water
bodies in the form of rivers, streams, lakes, ponds, wetlands, aquifers, and floodplains. The
Town of Milford Planning Department mandates all new structures must be located out of a 25
foot buffer from every stream, pond, and wetland reducing conflictions between these two
elements. Large water bodies such as lakes, which are more heavily impacted by environmental
degradation, are protected by a 50 foot buffer so as to reduce polluting runoff (Town of Milford
Zoning Ordinances 2009, 47-48).
However, these ordinances can be contradicted by the New Hampshire Department of
Environmental Services permitting the filling of a specific wetland if the cause of the
development is practical. Another loophole of filling wetland is creating conservation
easements. The formation of these preserved tracts of land is another natural constraint
inhibiting development. The proper identification of the development potential within the
tracts of land adjacent to South Street/RTE 13 South corridor requires a thorough analysis of
57
66. the existing water resources and preserved land within the study area. Overall, this ultimately
yields developmental limitations based on the trends and variations of the natural constraints
(Constantino, Personal Interview, 2009).
Analysis of natural constraints encompassing the western portion of the parcels north of
the RTE 101 intersection reveals a large stretch of water resources directly attributed to the
drainage basin of the Great Brook. A majority of the wetland along this stretch are located at
the back end of the parcels exhibiting higher development potential. The two abutting parcels
of conserved land stretching from the beginning of the RTE 101 intersection extending down
the Granite Rail Trail relative to Walnut Street are another inhibiter of development. Figure 22
depicts a wetland adjacent to South Street located near the Public Works facility. Overall, the
presence of natural constraints along the eastern side of the parcels north of the RTE 101
intersection discloses no apparent restrictions in development.
Figure 22 Wetland Along Western Side of South Street (Source: Authors 2009).
58