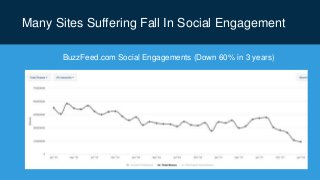
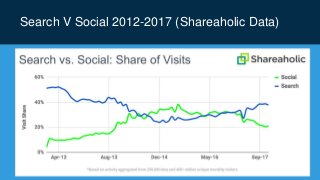
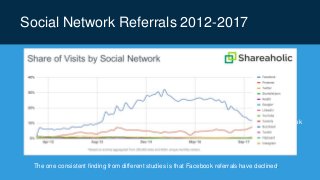
www.buzzsumo.com
Content Trends 2018
Median Shares of an Article in 2015
8
Median Shares in 2017 (Sample of 100m articles)
4
Majority of content gets very low shares
Only 5% of
Content
Gets
More Than
343 Shares
90% 5%
Social Shares 2017
Social Shares
Top 1 percent 2,409
Top 5 percent 343
Top 10 percent 62
Median 4
In 2017 you only needed 62 shares to be in the top 10% of posts
Many Sites Suffering Fall In Social Engagement
BuzzFeed.com Social Engagements (Down 60% in 3 years)
Why?
1. Growth in content publication and competition
2. Rise in private sharing
3. Facebook algorithm changes and fall in
engagement
1. Growth In Content Competition
Number of posts published on Wordpress.com
Content Views Have Fallen
Pageviews of posts published on Wordpress.com
Content Saturation Of Popular Topics
40,000 Articles a Week
Published About Bitcoin
In December 2017
As content competition increases typically
average shares decline
Data for Machine Learning from BuzzSumo.com
2. A Rise In Private Sharing
Data from GetSocial
3. Facebook Changes
Facebook v Google Referral Traffic (2012-15)
Facebook v Google Referral Traffic (2017-18)
Google
Facebook
Search V Social 2012-2017 (Shareaholic Data)
Google
Facebook
Beyond Publishers: Jumpshot Data
Google always drove the majority of web-wide
traffic referrals but this has further increased.
Oct 2016 59.2%
May 2017 62.6%
https://www.slideshare.net/randfish/inside-googles-numbers-in-2017
Social Network Referrals 2012-2017
Google
Facebook
The one consistent finding from different studies is that Facebook referrals have declined.
Facebook Changed Its Algorithm
You’ll Never Guess What Happened Next
“Last year we made an update to News Feed to
reduce stories from sources that consistently post
clickbait headlines that withhold and exaggerate
information.
Today, we are making three updates that build on this
work so that people will see even fewer clickbait
stories in their feeds”
Facebook May 2017
Former Top “What Happened” Headlines
3.1m
Facebook
Engagements
2.2m
1.9m
1.7m
“What Happened” Headlines Since May 2017
Facebook
Engagements
246k
242k
186k
172k
PlayBuzz Facebook Engagement Pre-2017
Facebook
Engagements
8.6m
6.4m
6.3m
6m
Top PlayBuzz Facebook Engagement 2017
Facebook
Engagements
195k
144k
142k
103k
BuzzFeed Listicles
Pre-2017 June-Dec 2017
Article Total Shares Article Total Shares
26 Pictures That Will Make You Re-
Evaluate Your Entire Existence
21 Things You Know Only If You've
Been Best Friends For 10 Years
26 Reasons Kids Are Pretty Much
Just Tiny Drunk Adults
41 Camping Hacks That Are
Borderline Genius
2.6m
2.2m
2.2m
2m
21 Photos That Show Just How Bad
The Flooding In Houston Really Is
9 Tweets Only People Who Shop At
Aldi Can Truly Understand
47 Things You'll Immediately
Understand If You Were A Teen In
The Late '90s
85 People Who Are Sexier Than Blake
Shelton
0.53m
0.4m
0.27m
0.2m
Fall in
Number of
Big Viral Posts
Total & Average Shares Upworthy Content
Total Shares of BuzzFeed Content
Social Engagements down 60% in 3 years
Financial Times Commentary on Latest FB Changes
Buffer – Top Posts Pre 2017
Buffer – Top Posts 2017
Average Shares of
Social Media Examiner Articles
However, some sites are bucking the trend……
Average Shares of New York Times
Content Treble
Financial Times - 21 February 2018
New York Times Political Posts
A Flight To Quality?
Seven of the top ten most shared articles on
Harvard Business Review over the last five years
were published in 2017. The other three were
published in 2016.
The two most shared posts from The Economist
over the last 5 years were both published in 2017.
Growth in LinkedIn Sharing
LinkedIn recently told Digiday that
comments, likes and shares on the platform
are up more than 60 percent year-on-year,
due to product updates, new features and
analytics.
https://digiday.com/media/publishers-eye-
linkedin-facebooks-reliability-falters/
Growth in LinkedIn Sharing
LinkedIn Shares of Forbes.com content
Growth in LinkedIn Sharing
LinkedIn Shares of BusinessInsider.com content
Backlinks
The median number of backlinks in our sample
of 100m posts published in 2017 was zero.
In fact over seventy percent of all content
published was never linked to from another
domain.
Authoritative Evergreen Content
Consistently Gains Shares and Links
Implications for Marketers
Be clear on your objectives for content and social media.
Social may be better for engagement than referrals.
Don’t chase shares with viral content and headlines
Build your authority early
Build your audience and direct distribution models
User generated content
Implications for Marketers
You need a promotion strategy
Focus on high quality content to gain shares and links
Less maybe more
SEO arguably more important than ever
LinkedIn may offer opportunities for B2B marketers
Thank you.
BuzzSumo.com
@steverayson

Content Trends 2018 - BuzzSumo Research Report

  • 1.
  • 2.
    Median Shares ofan Article in 2015 8
  • 3.
    Median Shares in2017 (Sample of 100m articles) 4
  • 4.
    Majority of contentgets very low shares Only 5% of Content Gets More Than 343 Shares 90% 5%
  • 5.
    Social Shares 2017 SocialShares Top 1 percent 2,409 Top 5 percent 343 Top 10 percent 62 Median 4 In 2017 you only needed 62 shares to be in the top 10% of posts
  • 6.
    Many Sites SufferingFall In Social Engagement BuzzFeed.com Social Engagements (Down 60% in 3 years)
  • 7.
    Why? 1. Growth incontent publication and competition 2. Rise in private sharing 3. Facebook algorithm changes and fall in engagement
  • 8.
    1. Growth InContent Competition Number of posts published on Wordpress.com
  • 9.
    Content Views HaveFallen Pageviews of posts published on Wordpress.com
  • 10.
    Content Saturation OfPopular Topics 40,000 Articles a Week Published About Bitcoin In December 2017
  • 11.
    As content competitionincreases typically average shares decline Data for Machine Learning from BuzzSumo.com
  • 12.
    2. A RiseIn Private Sharing Data from GetSocial
  • 13.
  • 14.
    Facebook v GoogleReferral Traffic (2012-15)
  • 15.
    Facebook v GoogleReferral Traffic (2017-18) Google Facebook
  • 16.
    Search V Social2012-2017 (Shareaholic Data) Google Facebook
  • 17.
    Beyond Publishers: JumpshotData Google always drove the majority of web-wide traffic referrals but this has further increased. Oct 2016 59.2% May 2017 62.6% https://www.slideshare.net/randfish/inside-googles-numbers-in-2017
  • 18.
    Social Network Referrals2012-2017 Google Facebook The one consistent finding from different studies is that Facebook referrals have declined.
  • 19.
    Facebook Changed ItsAlgorithm You’ll Never Guess What Happened Next “Last year we made an update to News Feed to reduce stories from sources that consistently post clickbait headlines that withhold and exaggerate information. Today, we are making three updates that build on this work so that people will see even fewer clickbait stories in their feeds” Facebook May 2017
  • 20.
    Former Top “WhatHappened” Headlines 3.1m Facebook Engagements 2.2m 1.9m 1.7m
  • 21.
    “What Happened” HeadlinesSince May 2017 Facebook Engagements 246k 242k 186k 172k
  • 22.
    PlayBuzz Facebook EngagementPre-2017 Facebook Engagements 8.6m 6.4m 6.3m 6m
  • 23.
    Top PlayBuzz FacebookEngagement 2017 Facebook Engagements 195k 144k 142k 103k
  • 24.
    BuzzFeed Listicles Pre-2017 June-Dec2017 Article Total Shares Article Total Shares 26 Pictures That Will Make You Re- Evaluate Your Entire Existence 21 Things You Know Only If You've Been Best Friends For 10 Years 26 Reasons Kids Are Pretty Much Just Tiny Drunk Adults 41 Camping Hacks That Are Borderline Genius 2.6m 2.2m 2.2m 2m 21 Photos That Show Just How Bad The Flooding In Houston Really Is 9 Tweets Only People Who Shop At Aldi Can Truly Understand 47 Things You'll Immediately Understand If You Were A Teen In The Late '90s 85 People Who Are Sexier Than Blake Shelton 0.53m 0.4m 0.27m 0.2m
  • 25.
  • 26.
    Total & AverageShares Upworthy Content
  • 27.
    Total Shares ofBuzzFeed Content Social Engagements down 60% in 3 years
  • 29.
    Financial Times Commentaryon Latest FB Changes
  • 30.
    Buffer – TopPosts Pre 2017
  • 31.
    Buffer – TopPosts 2017
  • 32.
    Average Shares of SocialMedia Examiner Articles
  • 33.
    However, some sitesare bucking the trend……
  • 34.
    Average Shares ofNew York Times Content Treble
  • 35.
    Financial Times -21 February 2018
  • 36.
    New York TimesPolitical Posts
  • 37.
    A Flight ToQuality? Seven of the top ten most shared articles on Harvard Business Review over the last five years were published in 2017. The other three were published in 2016. The two most shared posts from The Economist over the last 5 years were both published in 2017.
  • 38.
    Growth in LinkedInSharing LinkedIn recently told Digiday that comments, likes and shares on the platform are up more than 60 percent year-on-year, due to product updates, new features and analytics. https://digiday.com/media/publishers-eye- linkedin-facebooks-reliability-falters/
  • 39.
    Growth in LinkedInSharing LinkedIn Shares of Forbes.com content
  • 40.
    Growth in LinkedInSharing LinkedIn Shares of BusinessInsider.com content
  • 41.
    Backlinks The median numberof backlinks in our sample of 100m posts published in 2017 was zero. In fact over seventy percent of all content published was never linked to from another domain.
  • 42.
  • 43.
    Implications for Marketers Beclear on your objectives for content and social media. Social may be better for engagement than referrals. Don’t chase shares with viral content and headlines Build your authority early Build your audience and direct distribution models User generated content
  • 44.
    Implications for Marketers Youneed a promotion strategy Focus on high quality content to gain shares and links Less maybe more SEO arguably more important than ever LinkedIn may offer opportunities for B2B marketers
  • 45.