SlideShare a Scribd company logo
1 of 2
Download to read offline
Why multidimensional?
Traditional costing models are mostly
based on a single dimension output like
‘products’ or ‘customers’. Because of this
single dimensionality, some cost
allocations might not reflect a true cause
and effect relation to the output and can
lead to wrong decisions.
A traditional example is the cost of the
sales force. If the cost model contains only
one dimension, say product, you might
want to allocate sales force costs as an
overhead to all products based on say
sales value; or worse on the costs of each
product. This can lead to high cost
products being ‘over-priced’ where
perhaps the sales force actually spends
more time on less costly products. This
‘cross subsidising’ effect can lead to
wrong decisions.
Of course cost of a product is hardly ever
the real driver for sales costs so in a
multidimensional approach you analyse
what a sales force does. It spends time
and money on existing clients, on specific
sales channels or countries and perhaps
also on specific products such as a
marketing campaign. In order to prevent
cross subsidising you want to allocate
costs with the right ‘driver’ to the right
‘dimension’. In an example from a
Telecoms business the time spent on the
UK market was first allocated to the
object ‘UK market’. Next the costs were
allocated to those transactions that
occurred in the UK, based on the best
available driver, say sales volume.
The same sales department also incurred
costs on a world wide marketing
campaign for ‘Smart phones’. In the
multidimensional cost model these costs
were first allocated to the object ‘Smart
phones’ of dimension ‘Product group’ and
then to only those transactions that
involved smart phones.
So instead of allocating sales costs with one
driver two steps were used as well as better
drivers to the transactions. This resulted in
a more accurate cost allocation with less
cross subsidising.
Why transaction based?
Sales transactions or order lines are facts.
The more facts in your cost model the
better accepted are the results of the
calculations which get used to improve
decision making. The transaction files are
the life blood of the organisation containing
valuable dimension information that is easy
to obtain to update the model at any time.
Data mining: better decisions.
Once the allocations to the transactions are
done, the user can analyse the ‘result cube’
in many ways using all dimensions, driver
values and cost-per-dimension result fields.
Interactive slicing and dicing of the result
cube leads to a better understanding of the
true causes of profit and loss from the
multidimensional perspective.
The output is automatically generated as a
pivot table within Costperform or can be
analysed via OLAP tools such as QlikView.
#1: CostPerform’s multidimensional costing
function leads to improved profitability
CostPerform has a great new function to handle large data sets of sales transactions or order lines. In
many organizations, these types of transaction files are not only easily available but they also contain
valuable cost driver information for analyzing multiple ‘dimensions’ such as Product, Customer, Sales
channel, Country and so forth. With this function you can pull or push costs via these dimensions to the
most granular level available - your individual transactions. The flexible pivot function within
CostPerform runs on the ‘result cubes’ so you can slice and dice to explore the true profitability from the
multidimensional perspective. Better information for better performance improvement decisions.
How does it work?
Via a scheduled task this function is
designed to work automatically to:
 Import transactions, update attributes
definitions and values.
 Calculate and update the cost model for
each dimension instance found in the
transaction file.
CostPerform’s USP
CostPerform is not competing with Big
Data analysis tools that are designed to
find hidden relationships in existing
mountains of data. CostPerform delivers a
new piece of ‘calculated’ information that
is missing from the data. CostPerform
provides profitability information at the
detailed granularity level found in the
transaction data. This new insight into
true profitability from multidimensional
perspectives leads to better decisions
about where to focus on improving
profitability.
Traditional one dimensional costing
methods are no longer fit-for-purpose. For
today’s more rigorous needs CostPerform
does the job……and more.
The new multidimensional functionality in
Costperform can take data feeds directly
from your transaction files and is also the
ideal partner to work hand in hand with
all the leading edge Big Data tools so that
‘profitability’ could be one of the most
valuable pieces of information added to
the data set.
Conclusion.
If you want to know the true cause of
profit & loss then simply feed your
transactions into CostPerform, run the
model and start slicing and dicing on all
dimensions until you find the right areas
to improve your profitability.
Info: +44 (0)3 303 305 307 www.costperform.co.uk enquiries@costperform.co.uk
Example pivot table: Margin by Country, Channel, Customer Group
How it works
The Meta model contains a special layer
called Transaction layer. This special layer
cannot contain objects but knows where
it’s ‘objects’ (transactions) are stored.
Transactions are never loaded into
memory. If a model contains a
transaction layer the calculation starts to
process the related transaction table.
As a result, all members of each
dimension are inputted or updated into
the cost model as an object in a layer
designated as the ‘Dimension layer’.
For all selected values in the transaction
table, the calculation sums each value per
member of each dimension. These values
are stored per object in (generated)
attributes and can be used as a cost or
distribution driver.
Once the driver values are updated, the
cost model is calculated. The end user has
to make sure the allocations or
(preferably) distribution to the members
of the dimensions are defined.
For all dimension members that receive
cost, the calculator distributes the costs
for each member from each dimension to
the transactions using any available
driver. As a result, each transaction
contains costs-per-dimension results as
well as total costs and margin.
The transaction import task takes care of:
 Creating the transaction table
 Importing the transactions
 Updating the meta model attributes
 Updating the cost model for each
dimension member found in the
transaction table.
Handling Big Data files
The capacity to process transactions is only limited by time and database capacity.
We’ve tested the multidimensional function with a transaction file of 100,000,000
lines containing the data describing:
 4 dimensions (product, client, channel and country)
 3 cost driver values (number of products, income and weight)
In just over 2 hours on a SQL server database the update process performed the
following steps:
 100,000,000 lines were imported into a CostPerform database table.
 Per each of the 4 dimensions, 3 values were summed for each member of each
dimension. This resulted in 3 x 4 =12 queries
 Each unique occurrence within each dimension (all product ids, client id etc) was
inserted as object or updated in the target CostPerform cost model.
 The cost model was calculated
 The results per transaction were stored in the database table.
 Each transaction contains the original transaction and the result-set
 The result set consists of the ‘Cost per dimension’, a total cost value and a
margin value
 In total 600,000,000 values were updated.
 In total, the result-set contains 1,300,000,000 fields
A big advantage of this function is that internal memory usage is stable, regardless
of the number of transactions to process.
#2: Putting CostPerform’s multidimensional
costing function through its paces
CostPerform has a great new function to handle large data sets of sales transactions or order lines. These
days the sheer volume of transactions in the business would be part of the data set that is now called ‘Big
Data’. In many organisations, this type of ‘transaction file’ is not only easily available but also contains
valuable driver information (volumes, sales value…) and multiple ‘dimensions’ such as Product, Customer,
Sales channel, Country of sale and so forth. With the ‘transaction layer’ option added to a model, CostPerform
can access the Big Data in the company and auto-update cost models straight from the transactions and
calculate the latest costs per dimension, total costs and margin. The transactions are stored in the
CostPerform database, ready to be analysed in the pivot function and be picked up by any OLAP tool for
analysis. This multidimensional costing approach is very well suited for organisations that want to:
 understand true costs and profitability on the highest possible level of granularity;
 auto-update their cost models by transactions and have year to date cost
information in order to make better operational improvement decisions.
Info: +44 (0)3 303 305 307 www.costperform.co.uk enquiries@costperform.co.uk
Analysing 1,300M results
A result-set of 1,300M fields requires
specialised OLAP tools. For example using
QlikView on top of the result-set gave the
following satisfactory outcomes:
 Loading and compressing took 45
minutes
 Opening without re-compressing took
only 30 seconds
 Slicing and dicing, selecting and clicking
with almost no delay
Example QlikView multidimensional analysis

More Related Content

Viewers also liked

Aplicación de luz infrarroja
Aplicación de luz infrarrojaAplicación de luz infrarroja
Aplicación de luz infrarrojaGaby Valdiviezo
 
CARTA DEL DIRECTOR EJECUTIVO DE LA UNION INTERNACIONAL CONTRA LA TUBERCULOSI...
CARTA DEL DIRECTOR EJECUTIVO  DE LA UNION INTERNACIONAL CONTRA LA TUBERCULOSI...CARTA DEL DIRECTOR EJECUTIVO  DE LA UNION INTERNACIONAL CONTRA LA TUBERCULOSI...
CARTA DEL DIRECTOR EJECUTIVO DE LA UNION INTERNACIONAL CONTRA LA TUBERCULOSI...Carlos Roberto Leal Escalante MSc.
 
Rourke 2013 promo
Rourke 2013 promoRourke 2013 promo
Rourke 2013 promoWKM3rd
 
Rolladen Targeted by Attorney General for Deceptive Practices - Fort Lauderda...
Rolladen Targeted by Attorney General for Deceptive Practices - Fort Lauderda...Rolladen Targeted by Attorney General for Deceptive Practices - Fort Lauderda...
Rolladen Targeted by Attorney General for Deceptive Practices - Fort Lauderda...earthykey876
 
Vision International People Group
Vision International People GroupVision International People Group
Vision International People GroupIgor Vasilev
 
Spargelwanderung 2015
Spargelwanderung 2015Spargelwanderung 2015
Spargelwanderung 2015erhard renz
 
Certificado introduçao ao sistema eumet
Certificado introduçao ao sistema eumetCertificado introduçao ao sistema eumet
Certificado introduçao ao sistema eumetRobson Santana silva
 
Vision International People Group
Vision International People GroupVision International People Group
Vision International People GroupIgor Vasilev
 
Introducción a la tecnología Capitulo 3
Introducción a la tecnología Capitulo 3Introducción a la tecnología Capitulo 3
Introducción a la tecnología Capitulo 3Selina VR
 

Viewers also liked (12)

Aplicación de luz infrarroja
Aplicación de luz infrarrojaAplicación de luz infrarroja
Aplicación de luz infrarroja
 
Crono cal dif 2013
Crono cal dif 2013Crono cal dif 2013
Crono cal dif 2013
 
AwardLetter
AwardLetterAwardLetter
AwardLetter
 
BE#
BE#BE#
BE#
 
CARTA DEL DIRECTOR EJECUTIVO DE LA UNION INTERNACIONAL CONTRA LA TUBERCULOSI...
CARTA DEL DIRECTOR EJECUTIVO  DE LA UNION INTERNACIONAL CONTRA LA TUBERCULOSI...CARTA DEL DIRECTOR EJECUTIVO  DE LA UNION INTERNACIONAL CONTRA LA TUBERCULOSI...
CARTA DEL DIRECTOR EJECUTIVO DE LA UNION INTERNACIONAL CONTRA LA TUBERCULOSI...
 
Rourke 2013 promo
Rourke 2013 promoRourke 2013 promo
Rourke 2013 promo
 
Rolladen Targeted by Attorney General for Deceptive Practices - Fort Lauderda...
Rolladen Targeted by Attorney General for Deceptive Practices - Fort Lauderda...Rolladen Targeted by Attorney General for Deceptive Practices - Fort Lauderda...
Rolladen Targeted by Attorney General for Deceptive Practices - Fort Lauderda...
 
Vision International People Group
Vision International People GroupVision International People Group
Vision International People Group
 
Spargelwanderung 2015
Spargelwanderung 2015Spargelwanderung 2015
Spargelwanderung 2015
 
Certificado introduçao ao sistema eumet
Certificado introduçao ao sistema eumetCertificado introduçao ao sistema eumet
Certificado introduçao ao sistema eumet
 
Vision International People Group
Vision International People GroupVision International People Group
Vision International People Group
 
Introducción a la tecnología Capitulo 3
Introducción a la tecnología Capitulo 3Introducción a la tecnología Capitulo 3
Introducción a la tecnología Capitulo 3
 

Similar to CostPerform’s multidimensional costing function leads to improved profitability

Three Requirements for an Effective Cost Management System
Three Requirements for an Effective Cost Management SystemThree Requirements for an Effective Cost Management System
Three Requirements for an Effective Cost Management System3C Software
 
The future of software pricing excellence transaction pricing management
The future of software pricing excellence transaction pricing managementThe future of software pricing excellence transaction pricing management
The future of software pricing excellence transaction pricing managementVishal Sharma
 
Business Optix - what we do
Business Optix - what we doBusiness Optix - what we do
Business Optix - what we domitch3p
 
A Blueprint for DAM, MAM Cost Avoidance
A Blueprint for DAM, MAM Cost AvoidanceA Blueprint for DAM, MAM Cost Avoidance
A Blueprint for DAM, MAM Cost AvoidanceCognizant
 
Economics of crm 3
Economics of crm 3Economics of crm 3
Economics of crm 3ajitjoshiin
 
Unit of Value: A Framework for Scaling
Unit of Value: A Framework for ScalingUnit of Value: A Framework for Scaling
Unit of Value: A Framework for ScalingGreylock Partners
 
Emerging concept in information system
Emerging concept in information systemEmerging concept in information system
Emerging concept in information systemmeenakshi24
 
Dominos slx case study
Dominos slx case studyDominos slx case study
Dominos slx case studyamtansu
 
CATALOG DE SERVICII redus eng
CATALOG DE SERVICII redus engCATALOG DE SERVICII redus eng
CATALOG DE SERVICII redus engDalia Anghel
 
Impact ECS for Manufacturing
Impact ECS for ManufacturingImpact ECS for Manufacturing
Impact ECS for Manufacturing3C Software
 
Managing Business Operations (MBO) Report - Cost: the price of value creation
Managing Business Operations (MBO) Report - Cost: the price of value creationManaging Business Operations (MBO) Report - Cost: the price of value creation
Managing Business Operations (MBO) Report - Cost: the price of value creationNeha Kumar
 
Proposal for Point of Sale and Inventory Management Systems
Proposal for Point of Sale and Inventory Management SystemsProposal for Point of Sale and Inventory Management Systems
Proposal for Point of Sale and Inventory Management SystemsMacWolf1
 
techo pdf.pdf
techo pdf.pdftecho pdf.pdf
techo pdf.pdfTechoERP
 
Activity based costing
Activity based costingActivity based costing
Activity based costingPraveen Ojha
 
Customer and Product Profitability for Distributors
Customer and Product Profitability for DistributorsCustomer and Product Profitability for Distributors
Customer and Product Profitability for Distributors3C Software
 
What is copa master data
What is copa master dataWhat is copa master data
What is copa master dataRajeev Kumar
 

Similar to CostPerform’s multidimensional costing function leads to improved profitability (20)

Three Requirements for an Effective Cost Management System
Three Requirements for an Effective Cost Management SystemThree Requirements for an Effective Cost Management System
Three Requirements for an Effective Cost Management System
 
The future of software pricing excellence transaction pricing management
The future of software pricing excellence transaction pricing managementThe future of software pricing excellence transaction pricing management
The future of software pricing excellence transaction pricing management
 
Business Optix - what we do
Business Optix - what we doBusiness Optix - what we do
Business Optix - what we do
 
A Blueprint for DAM, MAM Cost Avoidance
A Blueprint for DAM, MAM Cost AvoidanceA Blueprint for DAM, MAM Cost Avoidance
A Blueprint for DAM, MAM Cost Avoidance
 
Economics of crm 3
Economics of crm 3Economics of crm 3
Economics of crm 3
 
Unit of Value: A Framework for Scaling
Unit of Value: A Framework for ScalingUnit of Value: A Framework for Scaling
Unit of Value: A Framework for Scaling
 
Emerging concept in information system
Emerging concept in information systemEmerging concept in information system
Emerging concept in information system
 
Dominos slx case study
Dominos slx case studyDominos slx case study
Dominos slx case study
 
Teamcenter Product Cost Fact Sheet
Teamcenter Product Cost Fact SheetTeamcenter Product Cost Fact Sheet
Teamcenter Product Cost Fact Sheet
 
CATALOG DE SERVICII redus eng
CATALOG DE SERVICII redus engCATALOG DE SERVICII redus eng
CATALOG DE SERVICII redus eng
 
01 intro qa
01 intro qa01 intro qa
01 intro qa
 
Impact ECS for Manufacturing
Impact ECS for ManufacturingImpact ECS for Manufacturing
Impact ECS for Manufacturing
 
Managing Business Operations (MBO) Report - Cost: the price of value creation
Managing Business Operations (MBO) Report - Cost: the price of value creationManaging Business Operations (MBO) Report - Cost: the price of value creation
Managing Business Operations (MBO) Report - Cost: the price of value creation
 
IT in retail
IT in retailIT in retail
IT in retail
 
Proposal for Point of Sale and Inventory Management Systems
Proposal for Point of Sale and Inventory Management SystemsProposal for Point of Sale and Inventory Management Systems
Proposal for Point of Sale and Inventory Management Systems
 
techo pdf.pdf
techo pdf.pdftecho pdf.pdf
techo pdf.pdf
 
Activity based costing
Activity based costingActivity based costing
Activity based costing
 
Customer and Product Profitability for Distributors
Customer and Product Profitability for DistributorsCustomer and Product Profitability for Distributors
Customer and Product Profitability for Distributors
 
What is copa master data
What is copa master dataWhat is copa master data
What is copa master data
 
Where to build cost model
Where to build cost modelWhere to build cost model
Where to build cost model
 

CostPerform’s multidimensional costing function leads to improved profitability

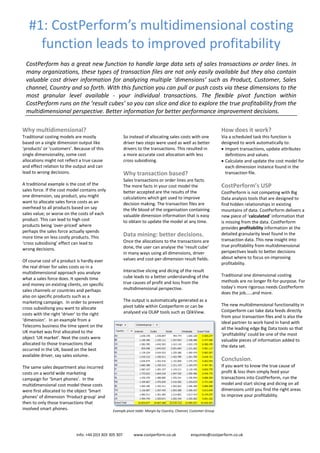
  • 1. Why multidimensional? Traditional costing models are mostly based on a single dimension output like ‘products’ or ‘customers’. Because of this single dimensionality, some cost allocations might not reflect a true cause and effect relation to the output and can lead to wrong decisions. A traditional example is the cost of the sales force. If the cost model contains only one dimension, say product, you might want to allocate sales force costs as an overhead to all products based on say sales value; or worse on the costs of each product. This can lead to high cost products being ‘over-priced’ where perhaps the sales force actually spends more time on less costly products. This ‘cross subsidising’ effect can lead to wrong decisions. Of course cost of a product is hardly ever the real driver for sales costs so in a multidimensional approach you analyse what a sales force does. It spends time and money on existing clients, on specific sales channels or countries and perhaps also on specific products such as a marketing campaign. In order to prevent cross subsidising you want to allocate costs with the right ‘driver’ to the right ‘dimension’. In an example from a Telecoms business the time spent on the UK market was first allocated to the object ‘UK market’. Next the costs were allocated to those transactions that occurred in the UK, based on the best available driver, say sales volume. The same sales department also incurred costs on a world wide marketing campaign for ‘Smart phones’. In the multidimensional cost model these costs were first allocated to the object ‘Smart phones’ of dimension ‘Product group’ and then to only those transactions that involved smart phones. So instead of allocating sales costs with one driver two steps were used as well as better drivers to the transactions. This resulted in a more accurate cost allocation with less cross subsidising. Why transaction based? Sales transactions or order lines are facts. The more facts in your cost model the better accepted are the results of the calculations which get used to improve decision making. The transaction files are the life blood of the organisation containing valuable dimension information that is easy to obtain to update the model at any time. Data mining: better decisions. Once the allocations to the transactions are done, the user can analyse the ‘result cube’ in many ways using all dimensions, driver values and cost-per-dimension result fields. Interactive slicing and dicing of the result cube leads to a better understanding of the true causes of profit and loss from the multidimensional perspective. The output is automatically generated as a pivot table within Costperform or can be analysed via OLAP tools such as QlikView. #1: CostPerform’s multidimensional costing function leads to improved profitability CostPerform has a great new function to handle large data sets of sales transactions or order lines. In many organizations, these types of transaction files are not only easily available but they also contain valuable cost driver information for analyzing multiple ‘dimensions’ such as Product, Customer, Sales channel, Country and so forth. With this function you can pull or push costs via these dimensions to the most granular level available - your individual transactions. The flexible pivot function within CostPerform runs on the ‘result cubes’ so you can slice and dice to explore the true profitability from the multidimensional perspective. Better information for better performance improvement decisions. How does it work? Via a scheduled task this function is designed to work automatically to:  Import transactions, update attributes definitions and values.  Calculate and update the cost model for each dimension instance found in the transaction file. CostPerform’s USP CostPerform is not competing with Big Data analysis tools that are designed to find hidden relationships in existing mountains of data. CostPerform delivers a new piece of ‘calculated’ information that is missing from the data. CostPerform provides profitability information at the detailed granularity level found in the transaction data. This new insight into true profitability from multidimensional perspectives leads to better decisions about where to focus on improving profitability. Traditional one dimensional costing methods are no longer fit-for-purpose. For today’s more rigorous needs CostPerform does the job……and more. The new multidimensional functionality in Costperform can take data feeds directly from your transaction files and is also the ideal partner to work hand in hand with all the leading edge Big Data tools so that ‘profitability’ could be one of the most valuable pieces of information added to the data set. Conclusion. If you want to know the true cause of profit & loss then simply feed your transactions into CostPerform, run the model and start slicing and dicing on all dimensions until you find the right areas to improve your profitability. Info: +44 (0)3 303 305 307 www.costperform.co.uk enquiries@costperform.co.uk Example pivot table: Margin by Country, Channel, Customer Group
  • 2. How it works The Meta model contains a special layer called Transaction layer. This special layer cannot contain objects but knows where it’s ‘objects’ (transactions) are stored. Transactions are never loaded into memory. If a model contains a transaction layer the calculation starts to process the related transaction table. As a result, all members of each dimension are inputted or updated into the cost model as an object in a layer designated as the ‘Dimension layer’. For all selected values in the transaction table, the calculation sums each value per member of each dimension. These values are stored per object in (generated) attributes and can be used as a cost or distribution driver. Once the driver values are updated, the cost model is calculated. The end user has to make sure the allocations or (preferably) distribution to the members of the dimensions are defined. For all dimension members that receive cost, the calculator distributes the costs for each member from each dimension to the transactions using any available driver. As a result, each transaction contains costs-per-dimension results as well as total costs and margin. The transaction import task takes care of:  Creating the transaction table  Importing the transactions  Updating the meta model attributes  Updating the cost model for each dimension member found in the transaction table. Handling Big Data files The capacity to process transactions is only limited by time and database capacity. We’ve tested the multidimensional function with a transaction file of 100,000,000 lines containing the data describing:  4 dimensions (product, client, channel and country)  3 cost driver values (number of products, income and weight) In just over 2 hours on a SQL server database the update process performed the following steps:  100,000,000 lines were imported into a CostPerform database table.  Per each of the 4 dimensions, 3 values were summed for each member of each dimension. This resulted in 3 x 4 =12 queries  Each unique occurrence within each dimension (all product ids, client id etc) was inserted as object or updated in the target CostPerform cost model.  The cost model was calculated  The results per transaction were stored in the database table.  Each transaction contains the original transaction and the result-set  The result set consists of the ‘Cost per dimension’, a total cost value and a margin value  In total 600,000,000 values were updated.  In total, the result-set contains 1,300,000,000 fields A big advantage of this function is that internal memory usage is stable, regardless of the number of transactions to process. #2: Putting CostPerform’s multidimensional costing function through its paces CostPerform has a great new function to handle large data sets of sales transactions or order lines. These days the sheer volume of transactions in the business would be part of the data set that is now called ‘Big Data’. In many organisations, this type of ‘transaction file’ is not only easily available but also contains valuable driver information (volumes, sales value…) and multiple ‘dimensions’ such as Product, Customer, Sales channel, Country of sale and so forth. With the ‘transaction layer’ option added to a model, CostPerform can access the Big Data in the company and auto-update cost models straight from the transactions and calculate the latest costs per dimension, total costs and margin. The transactions are stored in the CostPerform database, ready to be analysed in the pivot function and be picked up by any OLAP tool for analysis. This multidimensional costing approach is very well suited for organisations that want to:  understand true costs and profitability on the highest possible level of granularity;  auto-update their cost models by transactions and have year to date cost information in order to make better operational improvement decisions. Info: +44 (0)3 303 305 307 www.costperform.co.uk enquiries@costperform.co.uk Analysing 1,300M results A result-set of 1,300M fields requires specialised OLAP tools. For example using QlikView on top of the result-set gave the following satisfactory outcomes:  Loading and compressing took 45 minutes  Opening without re-compressing took only 30 seconds  Slicing and dicing, selecting and clicking with almost no delay Example QlikView multidimensional analysis