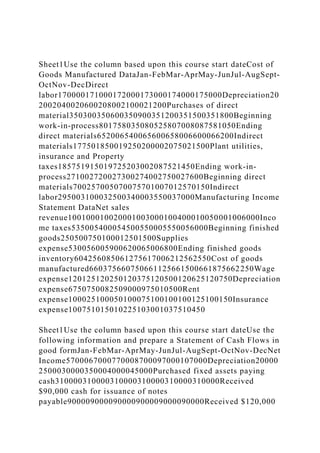
Sheet1Use the column based upon this course start dateCost of Goods Manufactured DataJan-FebMar-AprMay-JunJul-AugSept-OctNov-DecDirect labor170000171000172000173000174000175000Depreciation202002040020600208002100021200Purchases of direct material350300350600350900351200351500351800Beginning work-in-process801758035080525807008087581050Ending direct materials652006540065600658006600066200Indirect materials177501850019250200002075021500Plant utilities, insurance and Property taxes185751915019725203002087521450Ending work-in-process271002720027300274002750027600Beginning direct materials700257005070075701007012570150Indirect labor295003100032500340003550037000Manufacturing Income Statement DataNet sales revenue100100010020001003000100400010050001006000Income taxes535005400054500550005550056000Beginning finished goods250500750100012501500Supplies expense530056005900620065006800Ending finished goods inventory604256085061275617006212562550Cost of goods manufactured660375660750661125661500661875662250Wage expense120125120250120375120500120625120750Depreciation expense6750750082509000975010500Rent expense100025100050100075100100100125100150Insurance expense100751015010225103001037510450
Sheet1Use the column based upon this course start dateUse the following information and prepare a Statement of Cash Flows in good formJan-FebMar-AprMay-JunJul-AugSept-OctNov-DecNet Income5700067000770008700097000107000Depreciation200002500030000350004000045000Purchased fixed assets paying cash310000310000310000310000310000310000Received $90,000 cash for issuance of notes payable900009000090000900009000090000Received $120,000 cash for issuance of common stock120000120000120000120000120000120000Paid $20,000 for purchase of treasury stock200002000020000200002000020000Ending cash balance50000650008000095000110000125000Class Start DateJan-FebMar-AprMay-JunJul-AugSept-OctNov-DecAssets201720162017201620172016201720162017201620172016Current assets:Cash50000200006500020000800002000095000200001100002000012500020000Accounts receivable750008500075000850007500085000750008500075000850007500085000Inventory100000800001000008000010000080000100000800001000008000010000080000Long-term assetsPlant assets430000120000430000120000430000120000430000120000430000120000430000120000Accumulated depreciation120009000120009000120009000120009000120009000120009000Total Assets667000314000682000314000697000314000712000314000727000314000742000314000LiabilitiesCurrent liabilitiesAccounts payable320002000032000200003200020000320002000032000200003200020000Accrued liabilities860001500086000150008600015000860001500086000150008600015000Long-term liabilitiesNotes payable900000900000900000900000900000900000Total liabilities208000350002080003500020800035000208000350002080003500020800035000Stockholders equityCommon stock220000100000220000100000220000100000220000100000220000100000220000100000Retained earnings219000179000219000179000219000179000219000179000219000179000219000179000Treasury stock200000200000200000200.
Presentation by Andreas Schleicher Tackling the School Absenteeism Crisis 30 ...
Sheet1Use the column based upon this course start dateCost of Good.docx
1. Sheet1Use the column based upon this course start dateCost of
Goods Manufactured DataJan-FebMar-AprMay-JunJul-AugSept-
OctNov-DecDirect
labor170000171000172000173000174000175000Depreciation20
2002040020600208002100021200Purchases of direct
material350300350600350900351200351500351800Beginning
work-in-process801758035080525807008087581050Ending
direct materials652006540065600658006600066200Indirect
materials177501850019250200002075021500Plant utilities,
insurance and Property
taxes185751915019725203002087521450Ending work-in-
process271002720027300274002750027600Beginning direct
materials700257005070075701007012570150Indirect
labor295003100032500340003550037000Manufacturing Income
Statement DataNet sales
revenue100100010020001003000100400010050001006000Inco
me taxes535005400054500550005550056000Beginning finished
goods250500750100012501500Supplies
expense530056005900620065006800Ending finished goods
inventory604256085061275617006212562550Cost of goods
manufactured660375660750661125661500661875662250Wage
expense120125120250120375120500120625120750Depreciation
expense6750750082509000975010500Rent
expense100025100050100075100100100125100150Insurance
expense100751015010225103001037510450
Sheet1Use the column based upon this course start dateUse the
following information and prepare a Statement of Cash Flows in
good formJan-FebMar-AprMay-JunJul-AugSept-OctNov-DecNet
Income5700067000770008700097000107000Depreciation20000
2500030000350004000045000Purchased fixed assets paying
cash310000310000310000310000310000310000Received
$90,000 cash for issuance of notes
payable900009000090000900009000090000Received $120,000
2. cash for issuance of common
stock120000120000120000120000120000120000Paid $20,000
for purchase of treasury
stock200002000020000200002000020000Ending cash
balance50000650008000095000110000125000Class Start
DateJan-FebMar-AprMay-JunJul-AugSept-OctNov-
DecAssets20172016201720162017201620172016201720162017
2016Current
assets:Cash5000020000650002000080000200009500020000110
0002000012500020000Accounts
receivable75000850007500085000750008500075000850007500
0850007500085000Inventory10000080000100000800001000008
0000100000800001000008000010000080000Long-term
assetsPlant
assets430000120000430000120000430000120000430000120000
430000120000430000120000Accumulated
depreciation120009000120009000120009000120009000120009
000120009000Total
Assets66700031400068200031400069700031400071200031400
0727000314000742000314000LiabilitiesCurrent
liabilitiesAccounts
payable3200020000320002000032000200003200020000320002
00003200020000Accrued
liabilities860001500086000150008600015000860001500086000
150008600015000Long-term liabilitiesNotes
payable900000900000900000900000900000900000Total
liabilities208000350002080003500020800035000208000350002
080003500020800035000Stockholders equityCommon
stock220000100000220000100000220000100000220000100000
220000100000220000100000Retained
earnings2190001790002190001790002190001790002190001790
00219000179000219000179000Treasury
stock200000200000200000200000200000200000Total
stockholders
equity45900027900045900027900045900027900045900027900
0459000279000459000279000Total stockholders equity and
3. liabilities667000314000667000314000667000314000667000314
000667000314000667000314000
Sheet1Use the column based upon this course start
dateBreakeven ChartJan-FebMar-AprMay-JunJul-AugSept-
OctNov-DecSale
Price$12.00$14.00$16.00$18.00$20.00$22.00Variable
costs$2.00$4.00$6.00$8.00$10.00$12.00Fixed
Costs$12,000.00$14,000.00$16,000.00$18,000.00$20,000.00$2
2,000.00
Running Head: “COMPARATIVE FINANCIAL STATEMENT”
2
“COMPARATIVE FINANCIAL STATEMENT” 2
“Comparative Financial Statement”
Tamara Golson
Accounting 205 Principles of Accounting I
Instructor Keith Graham
April 13,2020
Comparative Financial Statement
Different companies have embraced the importance of financial
statements as a tool for reviewing, analyzing and gauging their
past, present and even predicting the future financial
performance. There are different techniques commonly used
during preparation of financial statements. The paper below
describes the comparative financial statements for Coca-Cola
4. Company, Keurig Dr. Pepper Inc. and PepsiCo companies.
“Company Overview”
Coca-Cola Company is a beverage company based in Atlanta,
Georgia. It is popular for the production of non-alcoholic
carbonated beverages, concentrates and syrups, which it markets
and sells in different parts of the world. The company produce
over 500 brands of the beverages it markets from over 200
countries in the world. Other than the non-alcoholic carbonated
drinks, the company also produces, markets and distributes
other kinds of drinks such as water and enhanced water, juice,
ready tea and coffee as well as sports and energy drinks. The
company has been facing quite a number of challenges within
the beverage industry, among them being competition. The
industry has been characterized with a number of companies
that have been able to attract a large share of the market, thus
posing a threat to Coca-Cola Company. Amongst the main
competitors are Nestle and PepsiCo companies which are also
popular for the production and distribution of non-alcoholic
beverages within the market.
Keurig Dr. Pepper Inc is based in Plano, Texas. The company is
also popular for retailing, manufacturing and marketing non-
alcoholic carbonated drinks, tea, juice, mixer, water and other
quality drinks. The organization founded its bottling and supply
system in 2006 after acquiring full possession of Seven Up
Bottling Group/Dr. Pepper, which was the largest independent
bottling organization in the America. Since then, the
organization has established other major independent bottling
and distribution enterprises. With the diversification of the
beverage products offered by the company, Dr Pepper has been
able to acquire more than 50% of the market share within the
beverage industry in the USA. The company has also gained
access to a high population of prospective customers within the
region as well as in other parts of the world Amongst the largest
opposers for the company include Coca-Cola Company and
PepsiCo.
PepsiCo company is also a beverage company based in the USA.
5. It is also popular for the production, marketing and distribution
of non-alcoholic carbonated drinks in different parts of the
world. This company also offers juices, waters, teas, smoothies
as well as other premium drinks. There are different brands of
beverages that are made within the organization. The company
has a sturdy manufacturing portfolio and has grown steadily
over the years through expanding the portfolio. This has seen it
towards becoming one of the fastest growing beverage
companies within the industry and hence increased market
share. The main target consumers for the company are young
beverage connoisseurs. The company faces competition from
other beverage companies like Keurig Dr. Pepper Inc. Company.
Ratio Analysis
Current Ratio is acquired by dividing the current assets with
current liabilities. Quick ratio is acquired by dividing the sum
of cash and accounts receivables with the current liabilities.
For Coca-Cola Company
Current year 2017
current ratio
quick ratio
gross profit percentage
inventory turnover
accounts receivable turnover
asset turnover ratios
1.34
1.25
64.20%
4.99
9.66
0.40
For Keurig Dr. Pepper Inc
Current year 2017
current ratio
quick ratio
gross profit percentage
inventory turnover
6. accounts receivable turnover
asset turnover ratios
1.64
1.46
64.20%
7.52
10.67
0.73
For PepsiCo
Current year 2018
current ratio
quick ratio
gross profit percentage
inventory turnover
accounts receivable turnover
asset turnover ratios
0.99
0.75
55.85%
1.70
10.67
0.17
Current Ratio is acquired by dividing the current assets with
current liabilities. Quick ratio is acquired by dividing the sum
of cash and accounts receivables with the current liabilities.
“Discuss potential liquidity issues based on your calculations of
the current and quick ratios”
There are different potential liquidity issues based on the
calculations of the current and quick ratios for the
organizations. For instance, the issues are likely to arise in a
situation where the companies are unable to converts assets into
cash without losing capital or revenue during the process.
“Are there any factors that could be erroneously influencing the
results of the ratios?”
There are different reasons that could affect the ratios such as
occurrences of off-season lulls. They tend to affect the
7. profitability of the companies as well s the activity analyses,
especially for the seasonal products offered by the company.
Other factors include revenue changes and seasonal inventory.
Some product sales may artificially reduce or increase the worth
of the organizational assets.
“Liquidity issues of the three companies.”
Coca-Cola Company is the most challenged company as far as
liquidity of its assets is concerned, as compared with the
competitor companies, that is PepsiCo and Dr. Pepper Inc. For
instance, the financial statement for Keurig Dr. Pepper indicates
that the company has debt and cash proceeds, which indicates a
need for improvement. The company has less than a quarter debt
coverage, which means that the company faces the issue of
efficient operations. The lack of liquidity within the
organization also indicates inefficiency of the current asset
management practices.
“Comparison of Accounting Methods”
“Explain the difference between the allowance method and the
direct write off method for accounts receivable. Document the
method used for each of the three companies.”
When an organization uses the direct write off method for
accounts receivable, the bad debt is charged as an expense
especially for the reason that an invoice will not be paid. On the
other hand if the company uses the allowance method, the
approximated amount of projected future bad debt is charged to
a reserve account immediately the sale has been done. This
makes the difference between the two methods of accounts
receivable (Miller-Nobles, Mattison & Matsumura, 2018).
Coca-Cola uses the allowances method of accounts receivable.
It assesses the collectability of its sales account receivables
according to different factors such as the particular sector in
which the client operates. This helps the company to gauge the
ability of the client to meet the organizational financial
obligations. Based on the results, the company will then reserve
a particular amount of cash as reserve for future bad debts. This
reduces the recognized receivable to the approximated number
8. of collectibles that the company had identified. Other than the
client’s identification of probable bad debts, Coca-Cola
company also records an allowance for doubtful accounts with
accordance to the past trends of company losses. The company
also takes note of the past trend due to the outstanding account
receivables (Keurig Dr Pepper, Inc., 2018).
Keurig Dr. Pepper also utilizes the allowance method of
accounts receivables. The company does not need collateral on
its account receivables. It identifies the needed allowance for
doubtful accounts based on factors such as the client’s credit
history and financial stability, the sector under which the client
operates, as well as the economic trends within the industry.
However, it is important to note that the level of allowances can
also be affected by the fluctuations within the industry,
bankruptcy of the client and also arising of client credit issues.
The company charges the account balances against the
allowances after determining the receivables that might not be
recovered. Keurig Dr. Pepper Inc. has never recorded losses
related to credit.
On the other hand, PepsiCo sells its products on cash or credit
terms. The credit terms are based on the local and sector
practices and demand payment within one month after
delivering products within the USA and up to 3 months for
international deliveries. The company allows for discounts for
early payments. The company estimates and reserves for bad
debt according to the past trends, analysis of client’s
information as well as aging of the account receivables. The
company classifies bad debt expense within sales and the other
expenses in the income statement (PepsiCo, 2016).
“Explain the difference between the straight line, double
declining balance and the unit-of-production depreciation
methods. Document the method used for each of the three
companies.”
Straight line refers to the depreciation method in which the
value of an asset depreciates by equal amount for different
accounting periods. On the other hand, double-declining balance
9. method allocates a higher rate of depreciation in the initial
accounting periods of an asset than in the later periods. Units of
production depreciation method depreciates the value of an
asset according to the specific product of output. All the three
companies use the straight line method of depreciation.
“Explain the difference between LIFO and FIFO and document
the method used for each of the three companies.”
Products recently added into a company’s inventory and are
unsold but accounted for are identified as FIFO (First In First
Out) products while those that were added into the inventory
before, are unsold but have been accounted for are identified as
LIFO (Last In First Out). FIFO method is used by the Coca-Cola
Company for the finished products and manufacturing
resources. Keurig Company uses both methods. It uses LIFO for
its subsidiaries and FIFO for costs of the inventories. On the
other hand, PepsiCo Company determines the inventory cost
using LIFO method.
“Explain the different categories of intangible assets and
document the method used for each of the three companies.”
There are different categories of intangible assets including
trademarks, patents, copyrights and goodwill. Trademarks offer
companies with the right to brand visualization such as trade
dress, patents provide the companies with rights to design
innovative products, copyrights safeguards the creative and
intellectual rights of the company while goodwill is the outcome
when a company takes over another establishment or takes their
assets. Coca-Cola company uses goodwill as indicated by the
use of its stock prices plus outstanding debt to establish its
market value as well as multiple earnings before deductions of
taxes, interests and remuneration based on appropriate industry
data (“United States and Securities Exchange Commission,”
2017). On the other hand, Keurig Dr. Pepper has most of its
intangible assets as a balance of brands with indefinite useful
lives. The intangible assets in PepsiCo Company are categorized
as equipment, property and plant recorded at historical costs.
Recommendation
10. From the above analysis, I would recommend investment on
Keurig Dr. Pepper Inc especially for the reason that the
company has diversified a lot of products under its brand. It is
also a popular company in different parts of the world, and has
a wide range of sales and distribution network. The company is
also known to be friendly to its clients and commits to offering
high quality products to its clients.
References
Keurig Dr Pepper, Inc. (2018). Form 10-K/A: Keurig Dr Pepper
Inc (Links to an external site.)Links to an external
site. [Amendment to previously filed 10-K annual report].
Retrieved from
http://app.quotemedia.com/data/downloadFiling?webmasterId=1
01533&ref=12139293&type=PDF&symbol=DPS&companyNam
e=Dr+Pepper+Snapple+Group+Inc&formType=10-
K%2FA&dateFiled=2018-03-20
Miller-Nobles, T. L., Mattison, B. L., & Matsumura, E. M.
(2018). Horngren’s accounting (12th ed.). Retrieved from
https://pearson.com
PepsiCo. (2016). 2016 PepsiCo annual report (Links to an
external site.)Links to an external site. [Report]. Retrieved from
http://www.pepsico.com/docs/album/annual-reports/pepsico-inc-
2016-annual-report.pdf?sfvrsn=0
United States and Securities Exchange Commission.
(2017). Form 10-K: The Coca-Cola Company (Links to an
external site.)Links to an external site. [Annual report].
Retrieved from http://coca-cola-ir.prod-
use1.investis.com/~/media/Files/C/Coca-Cola-
IR/documents/financial-reports/2017-annual-report-on-form-
10k.pdfAppendix
11. Running Head:
“
COMPARATIVE FINANCIAL STATEMENT
”
1
“
Comparative Financial Statement
”
Tamara Golson
Accounting 20
5
Principles of Ac
counting I
Instructo
r Keith Graham
April 13,2020
Running Head: “COMPARATIVE FINANCIAL STATEMENT”
1