MYANMAR RESOURCE GOVERNANCE INDEX 2017
•
2 likes•245 views

http://resourcegovernanceindex.org/ 2017 Resource Governance Index Measuring the quality of governance in the oil, gas and mining sectors of 81 countries. http://resourcegovernanceindex.org/country-profiles/MMR/mining http://resourcegovernanceindex.org/country-profiles/MMR/oil-gas http://resourcegovernanceindex.org/about/global-report

Recommended
More Related Content
Similar to MYANMAR RESOURCE GOVERNANCE INDEX 2017
Similar to MYANMAR RESOURCE GOVERNANCE INDEX 2017 (20)
More from MYO AUNG Myanmar
More from MYO AUNG Myanmar (20)
Recently uploaded
Recently uploaded (20)
MYANMAR RESOURCE GOVERNANCE INDEX 2017
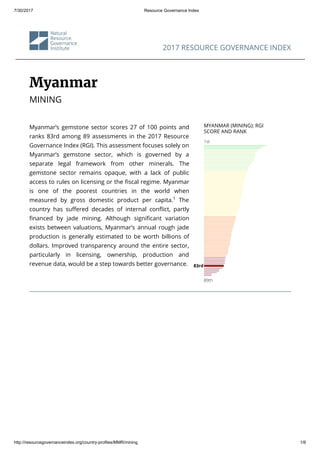
- 1. 7/30/2017 Resource Governance Index http://resourcegovernanceindex.org/country-profiles/MMR/mining 1/6 2017 RESOURCE GOVERNANCE INDEX Myanmar MINING Myanmar’s gemstone sector scores 27 of 100 points and ranks 83rd among 89 assessments in the 2017 Resource Governance Index (RGI). This assessment focuses solely on Myanmar’s gemstone sector, which is governed by a separate legal framework from other minerals. The gemstone sector remains opaque, with a lack of public access to rules on licensing or the scal regime. Myanmar is one of the poorest countries in the world when measured by gross domestic product per capita. The country has su ered decades of internal con ict, partly nanced by jade mining. Although signi cant variation exists between valuations, Myanmar’s annual rough jade production is generally estimated to be worth billions of dollars. Improved transparency around the entire sector, particularly in licensing, ownership, production and revenue data, would be a step towards better governance. MYANMAR (MINING): RGI SCORE AND RANK 1st 89th 1 83rd
- 2. 7/30/2017 Resource Governance Index http://resourcegovernanceindex.org/country-profiles/MMR/mining 2/6 MYANMAR (MINING): RGI AND COMPONENT SCORES VALUE REALIZATION 33 /100 REVENUE MANAGEMENT 30 /100 ENABLING ENVIRONMENT 19 /100 COMPOSITE 27 /100 Average Index results summary MYANMAR’S GEMSTONE LICENSING SYSTEM IS AMONG THE MOST POORLY GOVERNED IN THE WORLD Myanmar’s gemstone sector governance is poor in both value realization and revenue management, and the country’s index performance is worsened by a failing enabling environment. Licensing is the weakest element within value realization, with a score of four of 100, placing Myanmar’s gemstone mining sector second-to-last, above Turkmenistan, in the ranking. The government has virtually no transparency requirements and discloses almost no information related to the licensing process, contracts or the identities of those with ultimate nancial interests in the gemstone sector and trading companies. The latest Extractive Industries Transparency Initiative (EITI) country report contains an incomplete list of gem and jade licenses, including some details on blocks and license holders. Most of these permits have since expired and the identities of companies that won rights more recently have not been disclosed. The government has committed to requiring disclosure of bene cial owners of gemstone mining permit holders through its EITI bene cial ownership disclosure roadmap.
- 3. 7/30/2017 Resource Governance Index http://resourcegovernanceindex.org/country-profiles/MMR/mining 3/6 MYANMAR (MINING): SUBCOMPONENT SCORES Best index score Value realization Value realization LicensingTaxation Localim pact State-ow ned enterprises 0 20 40 60 80 100 Revenue m anagem ent Revenue m anagem ent N ationalbudgeting Subnationalresource revenue s... Sovereign w ealth funds 0 20 40 60 80 100 Enabling environm ent Enabling environm ent Voice and accountability G overnm ente ectiveness Regulatory qualityRule oflaw Controlofcorruption Politicalstability and absenc... O pen data 0 20 40 60 80 100 Myanmar’s governance is poor in revenue management. The government only discloses the total annual budget, while revenues from natural resources and projections for gemstones are not available, despite the fact that gemstones are the largest mining sector contributor to government revenue. In the context of Myanmar’s peace process, resource- rich, con ict-a ected regions of the country have called for greater sharing of natural resource revenues and management responsibilities. Governance challenges evidenced by
- 4. 7/30/2017 Resource Governance Index http://resourcegovernanceindex.org/country-profiles/MMR/mining 4/6 the index results point to a need to improve transparency on actual and estimated revenues as the rst step toward designing a revenue sharing system that distributes bene ts equitably and allows oversight of compliance with these rules. MYANMAR (MINING): LAW AND PRACTICE SCORES Gap Myanmar performs satisfactorily in governance of local impacts as a result of provisions included in the general environmental law for disclosure of environmental and social impact assessments and procedures for rehabilitation of closed mining projects. These requirements are vague, however, and do not provide clear guidance for the gemstone sector; as a result, indicators measuring practices in this area all achieve failing scores. Myanmar demonstrates the widest gap between legal framework and implementation in local impact among all assessments in the index. Lack of adequate oversight of gemstone operations has reportedly led to human rights violations and environmental disasters. Law Practice 0 20 40 60 80 100 State-owned enterprise governance MYANMAR GEMS ENTERPRISE REMAINS OPAQUE, RANKING GLOBALLY 21ST AMONG 22 STATE-OWNED MINING ENTERPRISES GLOBALLY With a failing score of 16 of 100, the Myanmar Gems Enterprise (MGE) ranks in the bottom ten of all state-owned enterprises (SOE) assessed in the index, and lowest of those in the Asia-Paci c region. In addition to MGE, military-controlled companies hold interests in gemstone mining, which has kept the sector in the hands of the country’s former ruling elite. Gemstones can be sold through “the Emporium,” a semi-annual trade event organized by the MGE and the Myanmar Gems and Jewellery Entrepreneurs Association (MGJEA), the country’s primary industry group, or through private transactions. Myanmar’s SOE law and gemstone law do not contain rules on how the MGE joint ventures or private operators should sell gemstones, which are mostly exported to China or Thailand. Name of state-owned enterprise State ownership level Revenue (USD) Score (/100) Rank (/74 SOEs) Rank (/22 mining SOEs) Myanmar Gems Enterprise 100% N/A 16 68 21
- 5. 7/30/2017 Resource Governance Index http://resourcegovernanceindex.org/country-profiles/MMR/mining 5/6 Governance performance across oil, gas and mining sectors THE OIL AND GAS SECTOR OUTPERFORMS THE GEMSTONE SECTOR IN LICENSING AND SOE GOVERNANCE The licensing process for gemstone mining in Myanmar is the least transparent of all countries in the index with a score of four of 100, whereas the oil and gas sector’s license awards are somewhat more transparent, scoring 24 of 100 and ranking 67th among 89 assessments. The competitive bidding rounds organized by Myanmar Oil and Gas Enterprise (MOGE) in 2013 and 2014 were signi cantly more transparent than previous rounds. SOEs play a central role in the licensing process in both sectors but details on the process, other than nal results, are rarely published. Transparency around how much the government collects from both sectors and how these revenues ow to the national budget is poor. Aggregate information on revenues collected from extractive companies is disclosed through EITI, but only a fraction of gemstone companies and their payments were included in the EITI country report. In both sectors, taxes and payments are collected by several agencies; MOGE and MGE collect most revenues, though the Internal Revenue Department of the Ministry of Planning and Finance, the Ministry of Natural Resources and Environmental Conservation and the Ministry of Energy and Electrical Power, and (for gemstones), the General Administration Department, also collect forms of tax. There are de cits between audit requirements and practices; for example, extractive companies are not audited by the national tax agency. Results of audits conducted by the O ce of the Auditor General (OAG) on the di erent tax- collecting agencies, including the SOEs MOGE and MGE, are not disclosed to the public. Furthermore, military-controlled holding companies MEC and UMEHL, which also work in the gemstone sector, have historically been exempt from the OAG audit. Di erences between the two sectors emerge in the governance of SOEs. The EITI country report discloses the cost of non-operational activities, revenues transferred to the government, and the cost of non-operational activities and production volume and value for MOGE. However, it includes only an aggregate gure on MGE’s payments to government. MYANMAR: OIL & GAS VS. MINING SCORES
- 6. 7/30/2017 Resource Governance Index http://resourcegovernanceindex.org/country-profiles/MMR/mining 6/6 MYANMAR: OIL & GAS VS. MINING SCORES 100 80 60 40 20 0 20 40 60 80 100 CompositeComposite MMIINNIINNGGOOIILL && GGAASS 100 80 60 40 20 0 20 40 60 80 100 Value realizationValue realization Licensing Taxation Local impact State-owned enterprises 100 80 60 40 20 0 20 40 60 80 100 Revenue managementRevenue management National budgeting Subnational resource reve... Sovereign wealth funds What is the Resource Governance Index? The 2017 RGI assesses how 81 resource-rich countries govern their oil, gas and mineral wealth. The index composite score is made up of three components. Two measure key characteristics of the extractives sector – value realization and revenue management – and a third captures the broader context of governance — the enabling environment. These three overarching dimensions of governance consist of 14 subcomponents, which comprise 54 indicators calculated by aggregating 133 questions and external data. Independent researchers, overseen by NRGI, in each of the 81 countries completed a questionnaire to gather primary data on value realization and revenue management. For the third component, the RGI draws on external data from over 20 international organizations. The assessment covers the period 2015-2016. For more information on the index, how it was constructed, and references to external data, review the RGI Methodology.
- 7. 2017 Resource Governance Index Myanmar (mining) 83rd COLOMBIA (MINERÍA): CALIFICACIÓN Y CLASIFICACIÓN EN EL IGR Bueno (>75) Satisfactorio (60-74) Débiles (45-59) Pobre (30-44) Defecto (<29) ၂၀၁၇ခု သယံဇာတ စီမံခန္႔ခြဲမႈ အၫႊန္းကိန္း (RGI) အရ ျမန္မာႏိုင္ငံ၏ ေက်ာက္မ်က္ရတနာ က႑သည္ အမွတ္ ၁၀၀ အနက္ ၂၇ မွတ္ရွိၿပီး အကဲျဖတ္ခ်က္ ၈၉ ခုတြင္ အဆင့္ ၈၃ ေနရာတြင္ ရွိသည္။ ယင္း အကဲျဖတ္ခ်က္သည္ ျမန္မာႏိုင္ငံ၏ ေက်ာက္မ်က္က႑ တစ္ခုတည္းတြင္သာ မူတည္ ေဆာင္ရြက္ျခင္းျဖစ္ၿပီး၊ အျခားဓာတ္သတၳဳမ်ားမွ သီးျခားတရားဝင္ မူေဘာင္က လႊမ္းမိုးထားသည္။ ေက်ာက္မ်က္က႑သည္ ပြင္႔လင္း ျမင္သာမႈ မရွိေသးဘဲ ရွိေနဆဲျဖစ္ၿပီး၊ လိုင္စင္ခ်ထား ေပးမႈ သို႔မဟုတ္ ဘ႑ာေရး စီမံခန္႔ခြဲျခင္းဆိုင္ရာ စည္းမ်ဥ္း စည္းကမ္းမ်ားကို ျပည္သူမ်ားသိရွိခြင့္ မရွိေပ။ ျပည္တြင္း အသားတင္ထုတ္လုပ္မႈႏွင့္ တစ္ဦးခ်င္း ဝင္ေငြမ်ားအရ ျမန္မာႏိုင္ငံသည္ ကမၻာ့အဆင္းရဲဆုံး ႏိုင္ငံမ်ားတြင္ အပါအဝင္ျဖစ္သည္။ ျမန္မာႏိုင္ငံသည္ ျပည္တြင္းစစ္၏ဒဏ္ကို ဆယ္စုႏွစ္ေပါင္း မ်ားစြာခံစားရလ်က္ရွိသည္။ စစ္ကုန္က်စရိတ္၏ တစ္စိတ္တစ္ ေဒသကို ေက်ာက္စိမ္းတူးေဖာ္ျခင္းမွ ရယူသံုးစြဲသည္။ တန္ဖိုးခန္႔မွန္းရာတြင္ ကြာဟမႈ မ်ားစြာရွိေသာ္လည္း ျမန္မာႏိုင္ငံ၏တစ္ႏွစ္ ေက်ာက္စိမ္းထုတ္လုပ္မႈမွာ ေဒၚလာသန္းေထာင္ေပါင္းမ်ား စြာရွိသည္ဟု ေယဘုယ်အားျဖင့္ ခန္႔မွန္းထားသည္။ က႑ တစ္ခုလံုး အထူးသျဖင့္ လိုင္စင္ခ်ထားေပးမႈ၊ ပိုင္ဆိုင္မႈ၊ ထုတ္လုပ္မႈႏွင့္ အခြန္အတုတ္ဆိုင္ရာ အခ်က္အလက္မ်ားတြင္ ပိုမိုပြင့္လင္းျမင္သာရွိလာမႈသည္ ပိုမိုေကာင္းမြန္ေသာစီမံခန္႔ခြဲမႈအတြက္ ေျခလွမ္းတစ္ရပ္ ျဖစ္လာႏိုင္ေပသည္။ ျမန္မာ ေက်ာက္မ်က္တူးေဖာ္ျခင္း - RGI ႏွင့္ အစိတ္အပိုင္း အမွတ္မ်ား ျမန္မာ (သတၱဳတူးေဖာ္ေရး) 30 ျမန္မာ - RGI ရမွတ္ႏွင့္ အဆင့္ အၫႊန္းကိန္း စုစုေပါင္း အက်ဥ္း ျမန္မာႏိုင္ငံ၏ ေက်ာက္မ်က္လိုင္စင္ ခ်ထားေပးမႈစနစ္သည္ ကမၻာေပၚတြင္ အညံ့ဖ်င္းဆံုး စီမံခန္႔ခြဲမႈမ်ားတြင္ အပါအဝင္ျဖစ္သည္။ ျမန္မာႏိုင္ငံ၏ ေက်ာက္မ်က္က႑ စီမံခန္႔ခြဲမႈသည္ တန္ဖိုးသတ္မွတ္ရာတြင္သာမက အခြန္အတုတ္ စီမံခန္႔ခြဲမႈတြင္ပါ ညံ့ဖ်င္းလွသည္။ သဘာဝ ပတ္ဝန္းက်င္ကို ထိန္းသိမ္းေစာင့္ေရွာက္ရန္ ပ်က္ကြက္မႈေၾကာင့္ တိုင္းျပည္၏ အၫႊန္းကိန္း တြက္ခ်က္မႈမွာ ပိုမိုညံ့ဖ်င္း သြားရသည္။ လိုင္စင္ ခ်ထားေပးမႈသည္ တန္ဖုိးသတ္မွတ္မႈတြင္ အားအနည္းဆံုး အခ်က္ျဖစ္ၿပီး အမွတ္ ၁၀၀ တြင္ ေလးမွတ္သာရသည္။ ထို႔ေၾကာင့္ ျမန္မာႏိုင္ငံ၏ ေက်ာက္မ်က္တူးေဖာ္ေရးက႑သည္ တာမစ္နစၥတန္ၿပီးလွ်င္ ဒုတိယေျမာက္ အညံ့ဖ်င္းဆံုး ျဖစ္သည္။ အစိုးရ၏ ကိုင္တြယ္စီမံမႈမွာ ပြင့္လင္း ျမင္သာမႈ မရွိသေလာက္နီးပါးျဖစ္ကာ၊ ေက်ာက္မ်က္က႑၊ ေရာင္းဝယ္ေရး ကုမၸဏီမ်ားရွိ လိုင္စင္ ထုတ္ေပးမႈလုပ္ငန္းစဥ္၊ စာခ်ဳပ္မ်ား သို႔မဟုတ္ ရင္းႏွီးျမႇဳပ္ႏွံသူမ်ား၏ အေထာက္အထားမ်ားႏွင့္ ပတ္သက္သည့္ အခ်က္အလက္မ်ားမွာလည္း ထုတ္ျပန္ေၾကညာမႈ မရွိသေလာက္ပင္ျဖစ္သည္။ ေနာက္ဆံုးထုတ္ျပန္ခဲ့ေသာ ေကာက္ႏုတ္ထားသည့္ လုပ္ငန္းမ်ား ပြင့္လင္းျမင္သာမႈဆိုင္ရာ ကနဦးလုပ္ငန္းစဥ္ (EITI) ႏိုင္ငံအစီရင္ခံစာတြင္ ေက်ာက္မ်က္ႏွင့္ ေက်ာက္စိမ္းလိုင္စင္ စာရင္းမွာမျပည့္စံုဘဲ၊ လုပ္ကြက္ႏွင့္ လုိင္စင္ရရွိထားသူအခ်ိဳ႕သာ ပါဝင္သည္။ ယင္းလိုင္စင္မ်ား၏ အမ်ားစုမွာ သက္တမ္းကုန္ဆံုး ၿပီးျဖစ္သည္။ မၾကာေသးမီက လိုင္စင္ရရွိခဲ့သည့္ကုမၸဏီမ်ား၏ စာရင္းကိုလည္း ထုတ္ျပန္ ေၾကညာျခင္း မရွိေသးေပ။ အစိုးရ သည္ ယင္း၏ EITI အက်ိဳးခံစားခြင့္ ပိုင္ဆိုင္မႈ ထုတ္ျပန္ေရး အစီအစဥ္မွတစ္ဆင့္ ေက်ာက္မ်က္တူးေဖာ္ေရးလုပ္ငန္း ပါမစ္ရရွိထားသူမ်ားကို ေဖာ္ထုတ္ရန္ ကတိျပဳထားသည္။ ေကာင္း သင္႔ ညံ႔ ဖ်င္း က်ရံွုး ၂၀၁၇ခု သယံဇာတ စီမံခန္႔ခြဲမွု အညႊန္းကိန္း VALUE REALIZATION 33/100 REVENUE MANAGEMENT 30/100 ENABLING ENVIRONMENT 19/100 COMPOSITE 27/100 စုစုေပါင္း တန္ဖိုးသတ္မွတ္ျခင္း အခြန္ေငြစီမံခန္႔ခြဲမွု သဘာ၀ပတ္၀န္းက်င္ ထိန္းသိမ္းျခင္း
- 8. 2017 Resource Governance Index 2 2017 Índice de la Gobernanza de Recursos Naturales: Colombia (minería)၂၀၁၇ခု သယံဇာတ စီမံခန္႔ခြဲမႈ အၫႊန္းကိန္း - ျမန္မာ (သတၱဳတူးေဖာ္ေရး) အခြန္အတုတ္စီမံခန္႔ခြဲမႈတြင္ ျမန္မာအစိုးရ၏ ကိုင္တြယ္မႈမွာ ညံ့ဖ်င္းလွသည္။ အစိုးရအခြန္ကို ေက်ာက္မ်က္က႑မွ အမ်ားဆံုးရရွိေသာ္ျငားလည္း အစိုးရသည္ ႏွစ္စဥ္ဘတ္ဂ်က္စုစုေပါင္း ကိုသာထုတ္ျပန္ေၾကညာၿပီး၊ သဘာဝသယံဇာတမ်ားႏွင့္ ေက်ာက္မ်က္စီမံကိန္းမ်ားမွရရွိေသာ အခြန္မ်ားစာရင္းကို မထုတ္ျပန္ေပ။ ျမန္မာႏိုင္ငံ၏ ၿငိမ္းခ်မ္းေရး လုပ္ငန္းစဥ္တြင္ ႏိုင္ငံအတြင္း သယံဇာတၾကြယ္ဝၿပီး တိုက္ပြဲမ်ားျဖစ္ပြားလ်က္ရွိသည့္ ေဒသမ်ားသည္ သဘာဝသယံ ဇာတမ်ားရရွိေသာ အခြန္မ်ားႏွင့္ စီမံခန္႔ခြဲမႈတာဝန္မ်ား ပိုမိုရရွိရန္ ေတာင္းဆိုထားသည္။ ညီတူညီမွ် အက်ိဳး ခံစားခြင့္ရွိၿပီး ယင္းစည္းမ်ဥ္းမ်ားႏွ င့္အညီလည္းျဖစ္ေသာ အခြန္ခြဲေဝမႈစနစ္ေရးဆြဲခ်မွတ္ေရးအတြက္ ကနဦးေျခလွမ္းအျဖစ္ အမွန္တကယ္ ရရွိေသာအခြန္မ်ားႏွင့္ ခန္႔မွန္းအခြန္မ်ားဆိုင္ရာတြင္ ပြင့္လင္းျမင္သာမႈ ပိုမိုရွိလာေစရန္အတြက္ လိုအပ္မႈေသာ ယင္းအၫႊန္းကိန္းစုစုေပါင္းအရ ကိုင္တြယ္စီမံရာတြင္ အခက္အခဲမ်ား ရွိေနေၾကာင္းသိႏိုင္သည္။ ျမန္မာ ေက်ာက္မ်က္တူးေဖာ္ျခင္း - တရားေရးမူေဘာင္ႏွင့္ အေကာင္အထည္ေဖာ္မႈရမွတ္မ်ား ျမန္မာ ေက်ာက္မ်က္တူးေဖာ္ျခင္း - တစ္ဝက္တစ္ပ်က္ အစိတ္အပိုင္း ရမွတ္မ်ား 0 20 40 60 80 100 Policy area performance across the extractive's value chain Valuerealization ResourceGovernanceIndex Licensing LocalImpact Taxation State-ownedenterprises Revenuemanagement Subnationalresourcerevenuesharing Nationalbudgeting Sovereignwealthfunds Enablingenvironment Voiceandaccountability Governmenteffectiveness Regulatoryquality Ruleoflaw Politicalstabilityandabsenceofviolence Controlofcorruption Opendata 0 10 20 30 40 50 60 70 80 90 100 Practice Law သ ယ ံဇာတ စီမံခန္႔ခြဲမွုအည ႊန္းက ိန္း လ ုုိင္စင္ခ်ထ ားေပးမွု အခြန္ေက ာက ္ခံျခင္းေဒသ တ ြင္းထ ိခိုက ္မွု ႏုုိင္ငံပုုိင္လ ုုပ္ငန္းမ်ား အခြန္ေငြစီမံခန္႔ခြဲမွု ႏုုိင္ငံေတ ာ္ဘ တ ္ဂ်က ္ခ်ထ ားမွု ႏိုင္ငံေတ ာ္က တ စ္စိတ ္တ စ္ေဒသ ပိုင္ေသ ာအရင္းအျမစ္အခြန္ခြဲေဝျခင္း အခ်ဳပ္အျခာအာဏ ာပိုင္ဓနဥစၥာရန္ပုံေငြ သ ဘ ာဝပတ ္၀န္းက ်င္ထ ိန္းသ ိမ္းျခင္း ျပည ္သ ူ႔သ ေဘ ာထ ားႏွင့္တ ာဝန္ခံမႈ အစိုးရ၏ ၾသ ဇာသ က ္ေရာက ္မႈ ထ ိန္းည ႇိမႈအရည ္အေသ ြးတ ရားဥပေဒစိုးမိုးမႈ အက ်င့္ပ်က ္ျခစားမႈထ ိန္းခ်ဳပ္ျခင္း ႏိုင္ငံေရးတ ည ္ၿငိမ္မႈႏွင့္အၾက မ္းဖက ္မႈမရွိျခင္း ျမင္သ ာေသ ာအခ်က ္အလ က ္မ်ား တ န္ဖုုိးသ တ ္မွတ ္မွု တရားဥပေဒ လိုက္နာမွု
- 9. 2017 Resource Governance Index 3 2017 Índice de la Gobernanza de Recursos Naturales: Colombia (minería)၂၀၁၇ခု သယံဇာတ စီမံခန္႔ခြဲမႈ အၫႊန္းကိန္း - ျမန္မာ (သတၱဳတူးေဖာ္ေရး) သဘာဝပတ္ဝန္းက်င္ႏွင့္ လူမႈေရးထိခိုက္မႈမ်ားအကဲျဖတ္ျခင္းႏွင့္ ၿပီးဆံုးသြားေသာ ေက်ာက္မ်က္တူးေဖာ္ေရးစီမံကိန္းမ်ား ျပန္လည္ထူေထာင္ေရး အတြက္ လုပ္ထံုးလုပ္နည္းမ်ား ထုတ္ျပန္ေရးအတြက္ အေထြေထြသဘာဝ ပတ္ဝန္းက်င္ ဥပေဒတြင္ပါဝင္သည့္ ျပ႒ာန္းခ်က္မ်ားေၾကာင့္ ေဒသတြင္း ထိခိုက္မႈမ်ား ကိုင္တြယ္ေျဖရွင္းမႈတြင္ ျမန္မာ၏ ေဆာင္ရြက္မႈမွာ ေက်နပ္ဖြယ္ရာရွိလာသည္။ သို႔ေသာ္ ယင္းလိုအပ္ခ်က္မ်ားမွာ မတိက်ေသးဘဲရွိၿပီး ေက်ာက္မ်က္က႑အတြက္ ရွင္းလင္းေသာ လမ္းၫႊန္ခ်က္ေပးႏိုင္ျခင္းလည္း မရွိေပ။ ထို႔ေၾကာင့္ ယင္းနယ္ပယ္ရွိ တိုင္းတာမႈလုပ္ငန္းမ်ားမွာ ေက်နပ္ ဖြယ္ရာမရွိေၾကာင္း အၫႊန္းကိန္းမ်ားက ေဖာ္ျပလ်က္ရွိသည္။ ျမန္မာႏိုင္ငံတြင္ အၫႊန္းကိန္းတြင္ ေဖာ္ျပထားေသာ အကဲျဖတ္မႈမ်ား အားလံုး အၾကားရွိ တရားဥပေဒမူေဘာင္ႏွင့္ ေဒသတြင္းထိခိုက္မႈအတြက္ ျပန္လည္ထူေထာင္မႈအၾကား ကြာဟခ်က္မွာ အလြန္ပင္ႀကီးမားလွေပသည္။ ေက်ာက္မ်က္တူးေဖာ္ေရး လုပ္ငန္းမ်ားကို ထိထိေရာက္ေရာက္ႀကီးၾကပ္ကြပ္ကဲမႈမရွိေသာေၾကာင့္ လူ႔အခြင့္အေရး ခ်ိဳးေဖာက္မႈမ်ားႏွင့္ သဘာဝ ေဘးအႏၱရာယ္မ်ား ျဖစ္ေပၚလာရေၾကာင္း အစီရင္ခံစာမ်ားအရ သိရသည္။ ႏိုင္ငံပိုင္လုပ္ငန္းကိုင္တြယ္စီမံမႈ ျမန္မာ့ေက်ာက္မ်က္ရတနာလုပ္ငန္းသည္ ပြင့္လင္းျမင္သာမႈမရွိေသးဘဲ တကမၻာလံုးရွိ ႏိုင္ငံပိုင္ ေက်ာက္မ်က္ရတနာလုပ္ငန္း ၂၂ ခုအနက္ အဆင့္ ၂၁ တြင္ရွိေနသည္။ အဆင့္ ၁၀၀ တြင္ ၁၆ အထိက်ဆင္းသြားေသာေၾကာင့္ ျမန္မာ့ေက်ာက္မ်က္ရတနာလုပ္ငန္း (MGE)သည္ အၫႊန္းကိန္းတြင္ေဖာ္ျပထားသည့္အတို င္း ႏိုင္ငံပိုင္လုပ္ငန္းမ်ားအနက္ ေအာက္ဆံုး ၁၀ ခုထဲတြင္ ပါဝင္ေနၿပီး၊ အာရွ-ပစၥဖိတ္ေဒသတြင္ ေအာက္ဆံုးအဆင့္တြင္ရွိေနေပသည္။ MGE အျပင္ ေက်ာက္မ်က္တူးေဖာ္ေရးလုပ္ငန္းမ်ားတြင္ စစ္တပ္ကတည္ေထာင္ထားသည့္ ကုမၸဏီမ်ားကလည္း ရင္းႏွီးျမႇဳပ္ႏွံမႈမ်ားထည့္ဝင္ထားသည္။ ေက်ာက္ မ်က္ တူးေဖာ္ေရးလုပ္ငန္းသည္ ယခင္စစ္အစိုးရ၏ ဗိုလ္ခ်ဳပ္မ်ားလက္ထဲတြင္ရွိေနသည္။ ေက်ာက္မ်က္ရတနာမ်ားကို MGE ႏွင့္ ႏိုင္ငံ၏အဓိက လုပ္ငန္းအုပ္စုျဖစ္ေသာ ျမန္မာ့ေက်ာက္မ်က္ရတနာလုပ္ငန္းရွင္မ်ားအသင္းတို႔က ပူးေပါင္းျပသသည့္ ႏွစ္လယ္ေက်ာက္မ်က္ ျပပြဲမ်ားတြင္ သို႔မဟုတ္ ပုဂၢလိ ကအေရာင္းအဝယ္လုပ္ငန္းမ်ားတြင္ ေရာင္းခ်သည္။ ျမန္မာႏိုင္ငံ၏ ႏိုင္ငံပိုင္လုပ္ငန္းမ်ား ဥပေဒႏွင့္ ေက်ာက္မ်က္ ဥပေဒတို႔တြင္ MGE ဖက္စပ္လုပ္ငန္းမ်ား သို႔မဟုတ္ ပုဂၢလိကလုပ္ငန္းရွင္မ်ားသည္ ေက်ာက္မ်က္ရတနာမ်ားကို မည္သို႔မည္ပံု ေရာင္းခ်ရမည္ ဟူေသာ စည္းမ်ဥ္း စည္းကမ္းမ်ား မပါဝင္ေပ။ ေက်ာက္မ်က္ရတနာအမ်ားစုကို တရုတ္ သို႔မဟုတ္ ထိုင္းႏိုင္ငံသို႔ တင္ပို႔ေရာင္းခ်သည္။ ေရနံ၊ သဘာဝဓာတ္ေငြ႕ႏွင့္ သတၳဳတူးေဖာ္ေရးက႑မ်ားတြင္ ကိုင္တြယ္စီမံ ေဆာင္ရြက္မႈ လုိင္စင္ခ်ထားေပးျခင္းႏွင့္ ႏိုင္ငံပိုင္လုပ္ငန္းမ်ားကိုင္တြယ္စီမံမႈတြင္ ေရနံႏွင့္ သဘာဝဓာတ္ေငြ႕က႑က ေက်ာက္မ်က္က႑ထက္ ပိုမိုသာလြန္သည္။ ျမန္မာႏိုင္ငံတြင္ ေက်ာက္မ်က္တူးေဖာ္ေရးလုပ္ငန္းအတြက္ လိုင္စင္ခ်ထားေပးေရးလုပ္ငန္းစဥ္သည္ ႏိုင္ငံမ်ားအားလံုးတြင္ အၫႊန္းကိန္း အနည္းဆံုး ျဖစ္ကာ အမွတ္ ၁၀၀တြင္ ၄မွတ္သာရွိသည္။ ေရနံႏွင့္ သဘာဝဓာတ္ေငြ႕ က႑က ပြင့္လင္းျမင္သာမႈအနည္းငယ္ပိုရွိကာ အမွတ္ ၁၀၀တြင္ ၂၄မွတ္ ရရွိကာ ႏိုင္ငံေပါင္း ၈၉ႏိုင္ငံတြင္ အဆင့္ ၆၇ ခ်ိတ္သည္။ ၂၀၁၃ႏွင့္ ၂၀၁၄ခုတို႔တြင္ ျမန္မာ့ေရနံႏွင့္သဘာဝဓာတ္ေငြ႕လုပ္ငန္းက ေခၚယူေသာ ေစ်းၿပိဳင္တင္ဒါမ်ားသည္ ယခင္ေစ်းၿပိဳင္တင္ဒါမ်ားထက္ ပြင့္လင္းျမင္သာမႈမ်ားစြာပိုရွိသည္။ ယင္းက႑ႏွစ္ခုစလံုးတြင္ လိုင္စင္ ခ်ထားေပးျခင္း လုပ္ငန္းစဥ္တြင္ ႏိုင္ငံပိုင္လုပ္ငန္းမ်ားက အဓိကပါဝင္သည္။ သို႔ေသာ္ လိုင္စင္ရသူမ်ားကိုသာ ထုတ္ျပန္ေၾကညာၿပီး လုပ္ငန္းစဥ္ဆိုင္ရာ အေသးစိတ္ အခ်က္အလက္မ်ားကို မရွိသေလာက္ျဖစ္သည္။ ယင္းက႑ႏွစ္ခုစလံုးတြင္ အစိုးရက အခြန္မည္မွ်ေကာက္ခံရရွိသည္၊ ယင္းအခြန္ေငြမ်ားကို ႏိုင္ငံေတာ္ဘတ္ဂ်က္မ်ားထဲသို႔ မည္သို႔စီးဝင္သြားသည္ ဆိုသည္ႏွင့္ပတ္သက္၍ ပြင့္လင္းျမင္သာမႈမွာ မရွိသေလာက္ပင္ျဖစ္သည္။ တူးေဖာ္သည့္ကုမၸဏီမ်ားထံမွ ေကာက္ယူရရွိေသာ အခြန္မ်ားႏွင့္ ပတ္ သက္သည့္ သတင္းမ်ားကို EITI မွတစ္ဆင့္ ထုတ္ျပန္ေၾကညာသည္။ သို႔ေသာ္ EITI ႏိုင္ငံအစီရင္ခံစာတြင္ ေက်ာက္မ်က္ကုမၸဏီမ်ားႏွင့္ ယင္းတို႔က ေပးေခ်ေသာ ေငြမ်ားကိုသာ ေဖာ္ျပထားသည္။ ယင္းက႑ႏွစ္ခုစလံုးတြင္ အခြန္မ်ားႏွင့္ ေပးေခ်ေငြမ်ားကို ေအဂ်င္စီအခ်ိဳ႕က ေကာက္ခံသည္။ အမ်ားစုကို MOGE ႏွင့္ MGE တို႕က စီမံကိန္းႏွင့္ ဘ႑ာေရးဝန္ႀကီးဌာနေအာက္ရွိ ျပည္တြင္းအခြန္မ်ားဦးစီးဌာန၊ သယံဇာတႏွင့္ သဘာဝ ပတ္ဝန္းက်င္ ထိန္းသိမ္းေရး ဝန္ႀကီးဌာနႏွင့္ လွ်ပ္စစ္နွင့္စြမ္းအင္ ဝန္ႀကီးဌာနတို႔မွတစ္ဆင့္လည္းေကာင္း၊ ေက်ာက္မ်က္ ရတနာမ်ား အတြက္ အခြန္မ်ားကို အေထြေထြ အုပ္ခ်ဳပ္ေရးဦးစီးဌာနမွတစ္ဆင့္ လည္းေကာင္း ေကာက္ခံရရွိသည္။ စာရင္းစစ္ေဆးမႈ မ်ားႏွင့္ လက္ေတြ႕ ကိန္းဂဏန္းမ်ားအၾကား ကြာျခားမႈမ်ားရွိပါသည္။ ဥပမာ ထုတ္လုပ္သည့္ကုမၸဏီမ်ားကို အမ်ိဳးသားအခြန္ေအဂ်င္စီက စာရင္း မစစ္ပါ။ SOEs ၊ MOGE ႏွင့္ MGE တို႔အပါအဝင္ အခြန္ေကာက္ခံသည့္အဖြဲ႕အစ ည္းအမ်ိဳးမ်ိဳးႏွင့္ပတ္သက္၍ စာရင္းစစ္ခ်ဳပ္႐ံုးက စာရင္းစစ္သည္။ ယင္းတိို႔ကို ျပည္သူလူထုအား အသိမေပးပါ။ ထို႔ျပင္ စစ္တပ္ပိုင္ကုမၸဏီမ်ား ျဖစ္ၾကသည့္ ျမန္မာ့စီးပြားေရး ေကာ္ပိုေရးရွင္းႏွင့္ ျမန္မာ့စီးပြားေရး ဦးပိုင္လီမိတက္တို႔သည္ ေက်ာက္မ်က္တူးေဖာ္ေရး က႑တြင္ လုပ္ကိုင္ေဆာင္ရြက္လ်က္ရွိေသာ္လည္း သမိုင္းေၾကာင္းတစ္ေလွ်ာက္တြင္ ယင္းတို႔ကို စာရင္းစစ္ခ်ဳပ္႐ံုးက စာရင္းစစ္ျခင္းမွ ကင္းလြတ္ခြင့္ရလ်က္ရွိသည္။ SOEs မ်ားကိုကိုင္တြယ္စီမံရာတြင္ ယင္းက႑ႏွစ္ခုအၾကား ကြဲျပားျခားနားမႈမ်ားရွိေနေပသည္။ EITI ႏိုင္ငံအစီရင္ခံစာတြင္ တူးေဖာ္ေရး မဟုတ္သည့္ လုပ္ငန္းမ်ားအတြက္ ကုန္က်စရိတ္မ်ား၊ အစိုးရထံသို႔ ေပးသြင္းသည့္ အခြန္မ်ား၊ ထုတ္လုပ္မႈပမာဏႏွင့္ MOGE အတြက္တန္ဖိုး စသည္တို႔ကို ေဖာ္ျပထားသည္။ သို႔ေသာ္ MGE က အစိုးရထံသို႔ ေပးသြင္းသည့္ အခြန္စုစုေပါင္း ပမာဏသာ ပါဝင္သည္။
- 10. 2017 Resource Governance Index2017 Índice de la Gobernanza de Recursos Naturales: Colombia (minería) The Natural Resource Governance Institute, an independent, non-profit organization, helps people to realize the benefits of their countries’ oil, gas and mineral wealth through applied research, and innovative approaches to capacity development, technical advice and advocacy. Learn more at www.resourcegovernance.org ၂၀၁၇ခု သယံဇာတ စီမံခန္႔ခြဲမႈ အၫႊန္းကိန္း - ျမန္မာ (သတၱဳတူးေဖာ္ေရး) ျမန္မာ - ေရနံႏွင့္ သဘာဝဓာတ္ေငြ႕ ႏွင့္ ေက်ာက္မ်က္တူးေဖာ္မႈ ရမွတ္မ်ား RGI ဆိုသည္မွာအဘယ္နည္း။ ၂၀၁၇ RGI သည္ ၈၁ ႏိုင္ငံေသာ သဘာ၀သယံဇာတ ၾကြယ္၀ေသာႏိုင္ငံမ်ားက ယင္းတို႔၏ ေရနံ၊ သဘာ၀ဓာတ္ေငြ႕ႏွင့္ ဓာတ္သတၳဳမ်ားကို မည္ကဲ့သို႔ ကိုင္တြယ္စီမံသည္ကို အကဲျဖတ္သည္။ အၫႊန္းကိန္းစုစုေပါင္း ရမွတ္တြင္ ၃မ်ိဳးပါဝင္သည္။ထုတ္လုပ္မႈက႑၏ တိုင္းတာမႈဆိုင္ရာ အဓိက လကၡဏာႏွစ္မ်ိဳးမွာ တန္ဖိုးသတ္မွတ္ျခင္းႏွင့္ အခြန္စီမံခန္႔ခြဲမႈတို႔ျဖစ္သည္။ တတိယလကၡဏာျဖစ္သည့္ သဘာဝပတ္ဝန္းက်င္ ထိန္းသိမ္းမႈတြင္ ပိုမိုက်ယ္ျပန္႔ေသာ ကိုင္တြယ္စီမံမႈပါဝင္သည္။ ယင္းကိုင္တြယ္စီမံမႈဆိုင္ရာ ေပါင္းကူးဖြဲ႕ယွက္ေနေသာ ပမာဏသံုးခုတြင္ အစိတ္အပိုင္း ၁၄ခုျဖင့္ ဖြဲ႕စည္းထားၿပီး ယင္းတို႔တြင္ အၫႊန္းျပကိန္း ၅၁ ခုပါဝင္သည္။ ယင္းတို႔ကို ေမးခြန္းစုစုေပါင္း ၁၃၃ ခုျဖင့္ တြက္ခ်က္သည္။ တန္ဖိုးသတ္မွတ္ျခင္းႏွင့္ အခြန္စီမံခန္႔ခြဲမႈတို႔ႏွင့္ပတ္သက္၍ အဓိကက်ေသာ အခ်က္အလက္မ်ားကို ေကာက္ယူရန္ အတြက္ ၈၁ ႏိုင္ငံအနက္ တစ္ႏိုင္ငံခ်င္းစီမွ NRGI က ႀကီးၾကပ္ေသာ သီးျခားလြတ္လပ္သည့္ သုေတသီမ်ားက ေမးခြန္းတစ္စံု ျပဳစုခဲ့သည္။ တတိယ လကၡဏာအတြက္ RGI သည္ ႏိုင္ငံတကာအဖြဲ႕အစည္း ၂၀ေက်ာ္မွ ျပင္ပအခ်က္အလက္မ်ားကို ေရးဆြဲသည္။ ယင္းအကဲျဖတ္ခ်က္ကို ၂၀၁၅-၂၀၁၆ခုႏွစ္ကာလပါဝင္သည္။ အၫႊန္းကိန္းႏွင့္ ယင္းကိုမည္သို႔ တည္ေဆာက္ခဲ့သည္ဆိုသည္ႏွင့္ပတ္သက္သည့္ အခ်က္အလက္မ်ားအတြက္ RGI နည္းကိုၾကည့္ပါ။ ■ Mining ■ Oil and gas -100 -50 0 50 100 Resource Governance Index Value realization Licensing Taxation Local Impact State-owned enterprises Revenue management National budgeting Subnational resource revenue sharing Sovereign wealth funds Enabling environment Voice and accountability Government effectiveness Regulatory quality Rule of law Control of corruption Political stability and absence of violence Open data သယံဇာတ စီမံခန္႔ခြဲမႈ အၫႊန္းကိန္း တန္ဖိုးသတ္မွတ္မႈ လိုင္စင္ခ်ထားေပးမႈ အခြန္ေကာက္ခံျခင္း ေဒသတြင္း ထိခိုက္မႈ ႏိုင္ငံပိုင္ လုပ္ငန္းမ်ား အခြန္ေငြ စီမံခန္႔ခြဲမွု ႏိုင္ငံေတာ္ဘတ္ဂ်က္ခ်ထားေပးမႈ ႏိုင္ငံေတာ္က တစ္စိတ္တစ္ေဒသ ပိုင္ေသာ အရင္းအျမစ္အခြန္ခြဲေဝျခင္း အခ်ဳပ္အျခာအာဏာပိုင္ ဓနဥစၥာ ရန္ပုံေငြ သဘာဝပတ္ဝန္းက်င္ ထိန္းသိမ္းျခင္း ျပည္သူ႔သေဘာထားႏွင့္ တာဝန္ခံမႈ အစိုးရ၏ ၾသဇာသက္ေရာက္မႈ ထိန္းညႇိမႈ အရည္အေသြး တရားဥပေဒ စိုးမိုးမႈ အက်င့္ပ်က္ျခစားမႈ ထိန္းခ်ဳပ္ျခင္း ႏိုင္ငံေရးတည္ၿငိမ္မႈႏွင့္ အၾကမ္းဖက္မႈမရွိျခင္း ျမင္သာေသာ အခ်က္အလက္မ်ား သတၱဳတူးေဖာ္ေရး ေရနံနွင့္သဘာဝဓါတ္ေငြ႔
- 11. 7/30/2017 Resource Governance Index http://resourcegovernanceindex.org/country-profiles/MMR/oil-gas 1/6 2017 RESOURCE GOVERNANCE INDEX Myanmar OIL & GAS Myanmar’s oil and gas sector scores 31 of 100 points and ranks 77th among 89 assessments in the 2017 Resource Governance Index (RGI). Compared to the country’s gemstones sector, progress in transparency is more visible in the oil and gas sector, which is emerging as a signi cant contributor of revenue to the state’s co ers. According to the rst Myanmar Extractive Industries Transparency Initiative (EITI) report, the oil and gas sector contributed 85 percent of reported revenues from the extractive sector, generating nearly a quarter of the government’s revenues. Some reforms to the role of state-owned enterprises (SOEs) are underway. A failing enabling environment re ects the persistent challenges faced by a country that has su ered decades of internal con ict. Myanmar’s enabling environment is assessed as failing. MYANMAR (OIL & GAS): RGI SCORE AND RANK 1st 89th 77th
- 12. 7/30/2017 Resource Governance Index http://resourcegovernanceindex.org/country-profiles/MMR/oil-gas 2/6 MYANMAR (OIL & GAS): RGI AND COMPONENT SCORES VALUE REALIZATION 44 /100 REVENUE MANAGEMENT 30 /100 ENABLING ENVIRONMENT 19 /100 COMPOSITE 31 /100 Average Index results summary SMALL STEPS TOWARDS BETTER ENVIRONMENTAL CONTROLS AND LICENSING TRANSPARENCY Myanmar’s oil and gas sector achieves its best component score, 44 of 100 points, in value realization, the component that measures a country’s ability to extract value from its natural resource endowment. Myanmar performs satisfactorily in taxation, although in the absence of up-to-date sector legislation, the terms of hydrocarbon extraction lack the force of law and are determined by the National Energy Policy and a model production sharing contract. Reform of the legal framework, including the scal regime, has stalled, and the public cannot hold the government accountable for compliance with contracts because oil and gas contracts are not disclosed.
- 13. 7/30/2017 Resource Governance Index http://resourcegovernanceindex.org/country-profiles/MMR/oil-gas 3/6 MYANMAR (OIL & GAS): SUBCOMPONENT SCORES Best index score Value realization Value realization LicensingTaxation Localim pact State-ow ned enterprises 0 20 40 60 80 100 Revenue m anagem ent Revenue m anagem ent N ationalbudgeting Subnationalresource revenue s... Sovereign w ealth funds 0 20 40 60 80 100 Enabling environm ent Enabling environm ent Voice and accountability G overnm ente ectiveness Regulatory qualityRule oflaw Controlofcorruption Politicalstability and absenc... O pen data 0 20 40 60 80 100 MYANMAR (OIL & GAS): RESOURCE GOVERNANCE TRENDS
- 14. 7/30/2017 Resource Governance Index http://resourcegovernanceindex.org/country-profiles/MMR/oil-gas 4/6 MYANMAR (OIL & GAS): RESOURCE GOVERNANCE TRENDS Myanmar has made progress in transparency, particularly by joining the EITI, which has facilitated disclosure of basic data on reserves, production, and exports of oil, gas and jade. According to the country’s EITI report, the government collected nearly USD 2.7 billion in oil and gas tax and non-tax revenues and another USD 460 million in mining revenues in scal year 2013–2014. In addition, EITI has been a forum for progress in civil society participation in a mostly closed and centrally controlled country. (Myanmar’s enabling environment scores just 19 of 100 points in the index.) Myanmar passed a new environmental law in 2012 with some environmental controls, but further reform of the environmental legal framework is required. Indicators measuring enforcement of laws and actual disclosure achieve failing scores. There are no speci c subnational revenue sharing mechanisms for oil and gas sector revenues. Companies can voluntarily contribute to social development funds, but because local governments’ revenue generation abilities are limited and scal transfers take place on an ad hoc basis, there is demand for a system for sharing resource revenues, particularly in oil-and-gas-rich but poverty-stricken states. Issue Score 2017 RGI Direction Company payment disclosure 77/100 EIA / SIA rule 100/100 State-owned enterprise governance MYANMAR OIL AND GAS ENTERPRISE’S LACK OF TRANSPARENCY HINDERS ACCOUNTABILITY ON PUBLIC REVENUES The Myanmar Oil and Gas Enterprise (MOGE) is the most important extractive industry revenue generator in Myanmar. The government has announced a policy to reform SOEs, granting them greater autonomy, including a right to keep a portion of revenues. MOGE does not disclose information on how it sells the production share it collects from its partnerships. Its reporting and corporate governance practices are failing, as it does not report annually on its nances or operations. The 2016 Myanmar EITI report provides some information on MOGE, including the share of revenues it retains, and that it provides fuel subsidies on behalf of the government.
- 15. 7/30/2017 Resource Governance Index http://resourcegovernanceindex.org/country-profiles/MMR/oil-gas 5/6 Name of state-owned enterprise State ownership level Revenue (USD) Score (/100) Rank (/74 SOEs) Rank (/52 oil & gas SOEs) Myanmar Oil and Gas Enterprise 100% N/A 35 56 39 Governance performance across oil, gas and mining sectors THE OIL AND GAS SECTOR OUTPERFORMS THE GEMSTONE SECTOR IN LICENSING AND SOE GOVERNANCE The licensing process for gemstone mining in Myanmar is the least transparent of all countries in the index with a score of four of 100, whereas the oil and gas sector’s license awards are somewhat more transparent, scoring 24 of 100 and ranking 67 among 89 assessments. The competitive bidding rounds organized by Myanmar Oil and Gas Enterprise (MOGE) in 2013 and 2014 were signi cantly more transparent than previous rounds. SOEs play a central role in the licensing process in both sectors but details on the process, other than nal results, are rarely published. Transparency around how much the government collects from both sectors and how these revenues ow to the national budget is poor. Aggregate information on revenues collected from extractive companies is disclosed through EITI, but only a fraction of gemstone companies and their payments were included in the EITI country report. In both sectors, taxes and payments are collected by several agencies; MOGE and MGE collect most revenues, though the Internal Revenue Department of the Ministry of Planning and Finance, the Ministry of Natural Resources and Environmental Conservation and the Ministry of Energy and Electrical Power, and (for gemstones), the General Administration Department, also collect forms of tax. There are de cits between audit requirements and practices; for example, extractive companies are not audited by the national tax agency. Results of audits conducted by the O ce of the Auditor General (OAG) on the di erent tax- collecting agencies, including the SOEs MOGE and MGE, are not disclosed to the public. Furthermore, military-controlled holding companies MEC and UMEHL, which also work in the gemstone sector, have historically been exempt from the OAG audit. Di erences between the two sectors emerge in the governance of SOEs. The EITI country report discloses the cost of non-operational activities, revenues transferred to the government, and the cost of non-operational activities and production volume and value for MOGE. However, it includes only an aggregate gure on MGE’s payments to government. MYANMAR: OIL & GAS VS. MINING SCORES th
- 16. 7/30/2017 Resource Governance Index http://resourcegovernanceindex.org/country-profiles/MMR/oil-gas 6/6 MYANMAR: OIL & GAS VS. MINING SCORES 100 80 60 40 20 0 20 40 60 80 100 CompositeComposite OOIILL && GGAASSMMIINNIINNGG 100 80 60 40 20 0 20 40 60 80 100 Value realizationValue realization Licensing Taxation Local impact State-owned enterprises 100 80 60 40 20 0 20 40 60 80 100 Revenue managementRevenue management National budgeting Subnational resource reve... Sovereign wealth funds What is the Resource Governance Index? The 2017 RGI assesses how 81 resource-rich countries govern their oil, gas and mineral wealth. The index composite score is made up of three components. Two measure key characteristics of the extractives sector – value realization and revenue management – and a third captures the broader context of governance — the enabling environment. These three overarching dimensions of governance consist of 14 subcomponents, which comprise 54 indicators calculated by aggregating 133 questions and external data. Independent researchers, overseen by NRGI, in each of the 81 countries completed a questionnaire to gather primary data on value realization and revenue management. For the third component, the RGI draws on external data from over 20 international organizations. The assessment covers the period 2015-2016. For more information on the index, how it was constructed, and references to external data, review the RGI Methodology.
- 17. 2017 Resource Governance Index Myanmar (oil and gas) 77th MYANMAR OIL AND GAS: RGI SCORE AND RANK Good (>75) Satisfactory (60-74) Weak (45-59) Poor (30-44) Failing (<30) Myanmar’s oil and gas sector scores 31 of 100 points and ranks 77th among 89 assessments in the 2017 Resource Governance Index (RGI). Compared to the country’s gemstones sector, progress in transparency is more visible in the oil and gas sector, which is emerging as a significant contributor of revenue to the state’s coffers. According to the first Myanmar Extractive Industries Transparency Initiative (EITI) report, the oil and gas sector contributed 85 percent of reported revenues from the extractive sector, generating nearly a quarter of the government’s revenues. Some reforms to the role of state-owned enterprises (SOEs) are underway. Myanmar’s enabling environment is assessed as failing. Myanmar oil and gas: RGI and component scores. VALUE REALIZATION 44/100 REVENUE MANAGEMENT 30/100 ENABLING ENVIRONMENT 19/100 COMPOSITE 31/100
- 18. 2017 Resource Governance Index 2 2017 Resource Governance Index: Myanmar (oil and gas) INDEX RESULTS SUMMARY Myanmar has taken small steps toward better environmental controls and licensing transparency Myanmar oil and gas: subcomponent scores Myanmar’s oil and gas sector achieves its best component score, 44 of 100 points, in value realization, the component that measures a country’s ability to extract value from its natural resource endowment. Myanmar performs satisfactorily in taxation, although in the absence of up-to-date sector legislation, the terms of hydrocarbon extraction lack the force of law and are determined by the National Energy Policy and a model production sharing contract. Reform of the legal framework, including the fiscal regime, has stalled, and the public cannot hold the government accountable for compliance with contracts because oil and gas contracts are not disclosed. Myanmar oil and gas: resource governance trends Issue 2017 RGI Score Direction Company payment disclosure 77 s Environmental impact assessment/ social impact assessment rule 100 s Myanmar has made progress in transparency, particularly by joining the EITI, which has facilitated disclosure of basic data on reserves, production, and exports of oil, gas and jade. According to the country’s EITI report, the government collected nearly USD 2.7 billion in oil and gas tax and non-tax revenues and another USD 460 million in mining revenues in fiscal year 2013–2014. In addition, EITI has been a forum for progress in civil society participation in a mostly closed and centrally controlled country. (Myanmar’s enabling environment scores just 19 of 100 points in the index.) Myanmar passed a new environmental law in 2012 with some environmental controls, but further reform of the environmental legal framework is required. Indicators measuring enforcement of laws and actual disclosure achieve failing scores. 0 20 40 60 80 100 Policy area performance across the extractive's value chainValuerealization ResourceGovernanceIndex Licensing LocalImpact Taxation State-ownedenterprises Revenuemanagement Subnationalresourcerevenuesharing Nationalbudgeting Sovereignwealthfunds Enablingenvironment Voiceandaccountability Governmenteffectiveness Regulatoryquality Ruleoflaw Politicalstabilityandabsenceofviolence Controlofcorruption Opendata
- 19. 2017 Resource Governance Index 3 2017 Resource Governance Index: Myanmar (oil and gas) There are no specific subnational revenue sharing mechanisms for oil and gas sector revenues. Companies can voluntarily contribute to social development funds, but because local governments’ revenue generation abilities are limited and fiscal transfers take place on an ad hoc basis, there is demand for a system for sharing resource revenues, particularly in oil-and-gas-rich but poverty-stricken states. STATE-OWNED ENTERPRISE GOVERNANCE Myanmar Oil and Gas Enterprise’s lack of transparency hinders accountability on public revenues Name State ownership level Revenue [USD] Score/100 Rank/74 SOEs Rank/52 oil and gas SOEs Oil and gas: Myanmar Oil and Gas Enterprise (MOGE) 100% N/A 35 56 39 The Myanmar Oil and Gas Enterprise (MOGE) is the most important extractive industry revenue generator in Myanmar. The government has announced a policy to reform SOEs, granting them greater autonomy, including a right to keep a portion of revenues. MOGE does not disclose information on how it sells the production share it collects from its partnerships. Its reporting and corporate governance practices are failing, as it does not report annually on its finances or operations. The 2016 Myanmar EITI report provides some information on MOGE, including the share of revenues it retains, and that it provides fuel subsidies on behalf of the government. GOVERNANCE PERFORMANCE ACROSS OIL, GAS AND MINING SECTORS The oil and gas sector outperforms the gemstone sector in licensing and SOE governance The licensing process for gemstone mining in Myanmar is the least transparent of all countries in the index with a score of four of 100, whereas the oil and gas sector’s license awards are somewhat more transparent, scoring 24 of 100 and ranking 67th among 89 assessments. The competitive bidding rounds organized by Myanmar Oil and Gas Enterprise (MOGE) in 2013 and 2014 were significantly more transparent than previous rounds. SOEs play a central role in the licensing process in both sectors but details on the process, other than final results, are rarely published. Transparency around how much the government collects from both sectors and how these revenues flow to the national budget is poor. Aggregate information on revenues collected from extractive companies is disclosed through EITI, but only a fraction of gemstone companies and their payments were included in the EITI country report. In both sectors, taxes and payments are collected by several agencies; MOGE and MGE collect most revenues, though the Internal Revenue Department of the Ministry of Planning and Finance, the Ministry of Natural Resources and Environmental Conservation and the Ministry of Energy and Electrical Power, and (for gemstones), the General Administration Department, also collect forms of tax. There are deficits between audit requirements and practices; for example, extractive companies are not audited by the national tax agency. Results of audits conducted by the Office of the Auditor General (OAG) on the different tax-collecting agencies, including the SOEs MOGE and MGE, are not disclosed to the public. Furthermore, military-controlled holding companies MEC and UMEHL, which also work in the gemstone sector, have historically been exempt from the OAG audit. Differences between the two sectors emerge in the governance of SOEs. The EITI country report discloses the cost of non-operational activities, revenues transferred to the government, and the cost of non-operational activities and pro- duction volume and value for MOGE. However, it includes only an aggregate figure on MGE’s payments to government.
- 20. 2017 Resource Governance Index2017 Resource Governance Index: Myanmar (oil and gas) The Natural Resource Governance Institute, an independent, non-profit organization, helps people to realize the benefits of their countries’ oil, gas and mineral wealth through applied research, and innovative approaches to capacity development, technical advice and advocacy. Learn more at www.resourcegovernance.org Myanmar oil and gas: oil and gas vs. Mining scores What is the RGI? The 2017 RGI assesses how 81 resource-rich countries govern their oil, gas and mineral wealth. The index composite score is made up of three components. Two measure key characteristics of the extractives sector – value realization and revenue management – and a third captures the broader context of governance — the enabling environment. These three overarching dimensions of governance consist of 14 subcomponents, which comprise 51 indicators, which are calculated by aggregating 133 questions. Independent researchers, overseen by NRGI, in each of the 81 countries completed a questionnaire to gather primary data on value realization and revenue management. For the third component, the RGI draws on external data from over 20 international organizations. The assessment covers the period 2015-2016. For more information on the index and how it was constructed, review the RGI Methodology. ■ Mining ■ Oil and gas -100 -50 0 50 100 Resource Governance Index Value realization Licensing Taxation Local Impact State-owned enterprises Revenue management National budgeting Subnational resource revenue sharing Sovereign wealth funds Enabling environment Voice and accountability Government effectiveness Regulatory quality Rule of law Control of corruption Political stability and absence of violence Open data
- 21. 2017 Resource Governance Index Myanmar (oil and gas) 77th COLOMBIA (MINERÍA): CALIFICACIÓN Y CLASIFICACIÓN EN EL IGR Bueno (>75) Satisfactorio (60-74) Débiles (45-59) Pobre (30-44) Defecto (<29) VALUE REALIZATION 44/100 REVENUE MANAGEMENT 30/100 ENABLING ENVIRONMENT 19/100 COMPOSITE 31/100 ျမန္မာ - RGI ရမွတ္ႏွင့္ အဆင့္ 30 ျမန္မာ (ေရနံႏွင့္ သဘာဝဓာတ္ေငြ႔) ၂၀၁၇ခု သယံဇာတ စီမံခန္႔ခြဲမႈ အၫႊန္းကိန္း (RGI) အရ ျမန္မာႏိုင္ငံ၏ ေရနံႏွင့္ သဘာဝဓာတ္ေငြ႔ က႑သည္ အမွတ္ ၁၀၀ အနက္ ၃၁ မွတ္ရွိၿပီး အကဲျဖတ္ခ်က္ ၈၉ ခုတြင္ အဆင့္ ၇၇ ေနရာတြင္ ရွိသည္။ ႏိုင္ငံ၏ ေက်ာက္မ်က္က႑ႏွင့္ ႏႈိင္းယွဥ္လ်င္ ႏိုင္ငံ၏ ဘ႑ာတုိက္သုိ႔ ဝင္ေငြ သိသာထင္ရွားစြာ ထည့္ဝင္သည့္ က႑အျဖစ္ ေပၚထြန္းလာေနသည့္ ေရနံႏွင့္ သဘာဝဓာတ္ေငြ႔ က႑တြင္ ပြင့္လင္းျမင္သာမႈ၌ တုိးတက္မႈမွာ ပုိ၍ျမင္သာသည္။ ေကာက္ႏုတ္ထားသည့္ လုပ္ငန္းမ်ား ပြင့္လင္းျမင္သာမႈဆိုင္ရာ ကနဦးလုပ္ငန္းစဥ္ (EITI) ပထမဦးဆုံး ျမန္မာႏိုင္ငံအစီရင္ခံစာအရ ေရနံႏွင့္ သဘာဝဓာတ္ေငြ႔ က႑သည္ ေကာက္ႏုတ္ထားသည့္ လုပ္ငန္းမ်ားမွ အစီရင္ခံထားသည့္ ဝင္ေငြ၏ ၈၅ ရာခုိင္ႏႈန္းကုိ ထည့္ဝင္ရာ အစုိးရဝင္ေငြ၏ ေလးပုံတစ္ပုံနီးပါးကုိ ရရွိေစသည္။ ႏိုင္ငံပိုင္လုပ္ငန္းမ်ား၏အခန္းက႑ကုိ ျပဳျပင္ေျပာင္းလဲမႈ အခ်ိဳ႕ကုိ ေဆာင္ရြက္လ်က္ရွိသည္။ ျမန္မာႏိုင္ငံ၏ သဘာဝပတဝန္းက်င္အား စြမ္းေဆာင္ေစႏိုင္မႈမွာ က်ဆင္းေနသည္ဟု ခန္႔မွန္းသုံးသပ္ထားသည္။ ျမန္မာ - RGI ႏွင့္ အစိတ္အပိုင္း အမွတ္မ်ား အၫႊန္းကိန္းရလဒ္မ်ားအက်ဥ္း ျမန္မာႏိုင္ငံသည္ သဘာဝပတ္ဝန္းက်င္ ပိုမိုထိန္းသိမ္းႏိုင္ရန္ႏွင့္ လိုင္စင္ခ်ထားေပးမႈတြင္ ပြင့္လင္းျမင္သာမႈပိုမိုရွိလာ ေစရန္ စီမံခ်က္ငယ္မ်ား ေဆာင္ရြက္ထားရွိၿပီးျဖစ္သည္။ ၂၀၁၇ခု သယံဇာတ စီမံခန္႔ခြဲမွု အညႊန္းကိန္း ေကာင္း သင္႔ ညံ႔ ဖ်င္း က်ရံွုး စုစုေပါင္း အခြန္ေငြစီမံခန္႔ခြဲမွု သဘာ၀ပတ္၀န္းက်င္ ထိန္းသိမ္းျခင္း တန္ဖိုးသတ္မွတ္ျခင္း
- 22. 2017 Resource Governance Index 2 2017 Índice de la Gobernanza de Recursos Naturales: Colombia (minería) ျမန္မာႏိုင္ငံ၏ ေရနံႏွင့္ သဘာဝဓာတ္ေငြ႕က႑သည္ တန္ဖိုးသတ္မွတ္မႈတြင္ အမွတ္ ၁၀၀ အနက္ ၄၄ မွတ္ရသျဖင့္ ယင္း၏ အေကာင္းဆံုး အစိတ္အပိုင္း ရမွတ္ျဖစ္သည္။ ယင္းသည္ တိုင္းျပည္က ယင္း၏ သဘာဝသယံဇာတမ်ားမွ တန္ဖိုး ေကာက္ႏုတ္ေဖာ္ျပႏိုင္စြမ္းကို တိုင္းတာသည္။ ျမန္မာႏိုင္ငံသည္ ေခတ္မီက႑ဆိုင္ရာ ဥပေဒ ေရးဆြဲျပ႒ာန္းမႈမရွိေသာ္လည္း အခြန္ေကာက္ခံမႈမွာ ေက်နပ္ဖြယ္ရာရွိသည္။ ဟိုက္ၿဒိဳကာဗြန္ ထုတ္လုပ္မႈ စည္းကမ္းခ်က္မ်ားတြင္ တရားဥပေဒသက္ေရာက္မႈ မရွိဘဲ ယင္းတို႔ကို ႏိုင္ငံေတာ္စြမ္းအင္မူဝါဒႏွင့္ စံထုတ္လုပ္မႈခြဲေဝေရးစာခ်ဳပ္တို႔အရ ဆံုးျဖတ္သည္။ ဘ႑ာေရးစနစ္အပါအဝင္ ဥပေဒမူေဘာင္ျပဳျပင္ေျပာင္းလဲမႈ ခ်မွတ္ထားၿပီးျဖစ္သည္။ ေရနံႏွင့္ သဘာဝဓာတ္ေငြ႕စာခ်ဳပ္မ်ားကို ထုတ္ျပန္ေၾကညာျခင္းမရွိေသာေၾကာင့္ ျပည္သူက အစိုးရကို စာခ်ဳပ္မ်ားႏွင့္အညီေဆာင္ရြက္ရန္ တာဝန္ခံခိုင္းႏိုင္ျခင္း မရွိေပ။ ၂၀၁၇ခု သယံဇာတ စီမံခန္႔ခြဲမႈ အၫႊန္းကိန္း - ျမန္မာ (ေရနံနွင့္ သဘာ၀ဓါတ္ေငြ႔) ျမန္မာ - သယံဇာတကိုင္တြယ္စီမံမႈ လမ္းေၾကာင္းမ်ား အထူးသျဖင့္ ျမန္မာႏိုင္ငံသည္ သယံဇာတသိုက္မ်ား၊ ထုတ္လုပ္မႈ၊ ေရနံ၊ သဘာဝဓာတ္ေငြ႕ႏွင့္ ေက်ာက္စိမ္းတင္ပို႔မႈႏွင့္ပတ္သက္သည့္ အေျခခံ အခ်က္အလက္မ်ားကို အေထာက္အကူျပဳသည့္ EITI သို႔ဝင္ေရာက္လိုက္ျခင္းေၾကာင့္ ပြင့္လင္းျမင္သာရွိမႈတြင္ တိုးတက္လာသည္။ ႏိုင္ငံ၏ EITI အစီရင္ခံစာအရ ၂၀၁၃-၂၀၁၄ ဘ႑ာေရးႏွစ္တြင္ အစိုးရသည္ ေရနံႏွင့္သဘာဝဓာတ္ေငြ႕မွ အခြန္ေငြႏွင့္ အခြန္မဟုတ္ေသာ အခြန္ဘ႑ာတို႔မွ အေမရိကန္ေဒၚလာ ၂.၇ဘီလွ်ံနီးပါးရရွိၿပီး သတၳဳတူးျခင္း အခြန္ဘ႑ာမွ အေမရိကန္ေဒၚလာ သန္း ၄၆၀ ရရွိခဲ့သည္။ ထို႔ျပင္ EITI သည္ တံခါးပိတ္ ဝါဒမ်ားစြာက်င့္သံုးၿပီး ဗဟိုကထိန္းခ်ဳပ္ထားသည့္ႏိုင္ငံတြင္ လူမႈအဖြဲ႕အစည္း ပါဝင္မႈ တိုးတက္လာေရးအတြက္ အစည္းအေ၀း လက္ခံက်င္းပေပးၿပီး လည္းျဖစ္သည္။ (ျမန္မာႏိုင္ငံ၏ သဘာဝ ပတ္ဝန္းက်င္ထိန္းသိမ္းမႈသည္ အမွတ္ ၁၀၀ တြင္ ၁၉ မွတ္သာရရွိေၾကာင္း အၫႊန္းကိန္းတြင္ ေဖာ္ျပထား သည္။) ေရနံႏွင့္သဘာ၀ဓာတ္ေငြ႕က႑မွ အခ်ိဳ႕ေသာ အက်ိဳးခံစားသည့္ ပိုင္ရွင္မ်ားကိုလည္း ထုတ္ေဖာ္ေျပာၾကားထားၿပီး ျဖစ္သည္။ ျမန္မာႏိုင္ငံ သည္ သဘာဝပတ္ဝန္းက်င္ ထိန္းခ်ဳပ္မႈအခ်ိဳ႕ႏွင့္အတူ သဘာဝပတ္ဝန္းက်င္ ဥပေဒသစ္တစ္ခုကို ၂၀၁၂ ခုႏွစ္တြင္ ခ်မွတ္ျပ႒ာန္းခဲ့သည္။ သို႔ေသာ္ သဘာဝပတ္၀န္းက်င္ဆိုင္ရာ ဥပေဒမူေဘာင္ကို ထပ္မံျပဳျပင္ေျပာင္းလဲရန္ လိုအပ္လ်က္ရွိသည္။ ဥပေဒမ်ားလိုက္နာမႈကိုတိုင္းတာေသာ အၫႊန္း ကိန္းမ်ားႏွင့္ အမွန္တကယ္ထုတ္ေဖာ္ ေၾကညာမႈတြင္ ရမွတ္က်ဆင္းလ်က္ရွိသည္။ ျမန္မာ - တစ္ဝက္တစ္ပ်က္ အစိတ္အပိုင္းရမွတ္မ်ား 0 20 40 60 80 100 Policy area performance across the extractive's value chain Valuerealization ResourceGovernanceIndex Licensing LocalImpact Taxation State-ownedenterprises Revenuemanagement Subnationalresourcerevenuesharing Nationalbudgeting Sovereignwealthfunds Enablingenvironment Voiceandaccountability Governmenteffectiveness Regulatoryquality Ruleoflaw Politicalstabilityandabsenceofviolence Controlofcorruption Opendata သ ယ ံဇာတ စီမံခန္႔ခြဲမွုအည ႊန္းက ိန္း လ ုုိင္စင္ခ်ထ ားေပးမွု အခြန္ေက ာက ္ခံျခင္းေဒသ တ ြင္းထ ိခိုက ္မွု ႏုုိင္ငံပုုိင္လ ုုပ္ငန္းမ်ား အခြန္ေငြစီမံခန္႔ခြဲမွု ႏုုိင္ငံေတ ာ္ဘ တ ္ဂ်က ္ခ်ထ ားမွု ႏိုင္ငံေတ ာ္က တ စ္စိတ ္တ စ္ေဒသ ပိုင္ေသ ာအရင္းအျမစ္အခြန္ခြဲေဝျခင္း အခ်ဳပ္အျခာအာဏ ာပိုင္္ဓနဥစၥာရန္ပုံေငြ သ ဘ ာဝပတ ္၀န္းက ်င္ထ ိန္းသ ိမ္းျခင္း ျပည ္သ ူ႔သ ေဘ ာထ ားႏွင့္တ ာဝန္ခံမႈ အစိုးရ၏ ၾသ ဇာသ က ္ေရာက ္မႈ ထ ိန္းည ႇိမႈအရည ္အေသ ြးတ ရားဥပေဒစိုးမိုးမႈ အက ်င့္ပ်က ္ျခစားမႈထ ိန္းခ်ဳပ္ျခင္း ႏိုင္ငံေရးတ ည ္ၿငိမ္မႈႏွင့္အၾက မ္းဖက ္မႈမရွိျခင္း ျမင္သ ာေသ ာအခ်က ္အလ က ္မ်ား တ န္ဖုုိးသ တ ္မွတ ္မွု
- 23. 2017 Resource Governance Index 3 2017 Índice de la Gobernanza de Recursos Naturales: Colombia (minería)၂၀၁၇ခု သယံဇာတ စီမံခန္႔ခြဲမႈ အၫႊန္းကိန္း - ျမန္မာ (ေရနံနွင့္ သဘာ၀ဓါတ္ေငြ႔) ႏိုင္ငံပိုင္လုပ္ငန္းကိုင္တြယ္စီမံမႈ ျမန္မာ့ေရနံႏွင့္သဘာဝဓာတ္ေငြ႕လုပ္ငန္း၏ ပြင့္လင္းျမင္သာမႈမရွိျခင္းသည္ ျပည္သူ႔ဘ႑ာအခြန္မ်ားတာဝန္ခံမႈကို အဟန္႔အတားျဖစ္ေစလ်က္ရွိသည္။ ျမန္မာႏိုင္ငံတြင္ ျမန္မာ့ေရနံႏွင့္သဘာဝဓာတ္ေငြ႕လုပ္ငန္း(MOGE)သည္ အေရးအပါဆံုး ထုတ္လုပ္မႈလုပ္ငန္း အခြန္ေပးေဆာင္သူျဖစ္သည္။ အစိုးရသည္ ဘ႑ာအခြန္ တစ္စိတ္တစ္ပိုင္းကို ထိန္းသိမ္းခြင့္အပါအဝင္ ႏိုင္ငံပိုင္လုပ္ငန္း မ်ားအား ကိုယ္ပိုင္လုပ္ပိုင္ခြင့္ ပိုမိုေပးအပ္လ်က္ ယင္းတို႔ကို ျပဳျပင္ေျပာင္းလဲမႈမူဝါဒကို ေၾကညာခဲ့သည္။ MOGE သည္ ယင္း၏စီးပြားဖက္အဖြဲ႕အစည္းမ်ားထံမွေကာက္ယူရရွိေသာ ထုတ္လုပ္မႈ ရွယ္ယာကို မည္သို႔ေရာင္းခ်သည္ဆိုသည္ႏွင့္ ပတ္သက္၍ ထုတ္ေဖာ္ေျပာၾကားျခင္းမရွိေပ။ ယင္း၏ အစီရင္ခံတင္ျပျခင္းႏွင့္ ကိုင္တြယ္စီမံမႈမ်ား ေပါင္းစပ္ ေဆာင္ရြက္ျခင္းတို႔တြင္ က်ဆင္းလ်က္ရွိသည္။ ၂၀၁၆ခု EITI အစီရင္ခံစာတြင္ MOGE က ရရွိသည့္ ဘ႑ာအခြန္မ်ား၊ ယင္းသည္ အစိုးရကိုယ္စား ေလာင္စာမ်ား ေထာက္ပံ့ေပးျခင္း စသည္တို႔အပါအဝင္ MOGE ႏွင့္ ပတ္သက္သည့္ အခ်က္အလက္အခ်ိဳ႕ပါဝင္သည္။ ေရနံ၊ သဘာဝဓာတ္ေငြ႕ႏွင့္ သတၳဳတူးေဖာ္ေရး က႑မ်ားတြင္ ကိုင္တြယ္စီမံမႈ ေဆာင္ရြက္ခ်က္ ေရနံႏွင့္သဘာဝဓာတ္ေငြ႕က႑သည္ လိုင္စင္ခ်ထားေပးျခင္းႏွင့္ SOE ကိုင္တြယ္စီမံမႈထက္ ေဆာင္ရြက္မႈပိုမို က်ယ္ျပန္႔သည္။ ျမန္မာႏိုင္ငံတြင္ ေက်ာက္မ်က္တူးေဖာ္ေရး လုပ္ငန္းအတြက္ လိုင္စင္ခ်ထားေပးေရး လုပ္ငန္းစဥ္သည္ ႏိုင္ငံမ်ား အားလံုးတြင္ အၫႊန္းကိန္း အနည္းဆံုးျဖစ္ကာ အမွတ္ ၁၀၀တြင္ ၄ မွတ္သာရွိသည္။ ေရနံႏွင့္ သဘာဝဓာတ္ေငြ႕ လိုင္စင္ခ်ထားေပးမႈက ပြင့္လင္းျမင္သာမႈ အနည္းငယ္ပိုရွိကာ အမွတ္ ၁၀၀တြင္ ၂၄ မွတ္ရရွိကာ ႏိုင္ငံေပါင္း ၈၉ႏိုင္ငံတြင္ အဆင့္ ၆၇ ခ်ိတ္သည္။ ၂၀၁၃ ႏွင့္ ၂၀၁၄ ခုတို႔တြင္ ျမန္မာ့ေရနံႏွင့္ သဘာဝဓာတ္ေငြ႕ လုပ္ငန္းက ေခၚယူေသာ ေစ်းၿပိဳင္တင္ဒါမ်ားသည္ ယခင္ေစ်းၿပိဳင္တင္ဒါမ်ားထက္ ပြင့္လင္းျမင္သာမႈ မ်ားစြာပိုရွိသည္။ ယင္းက႑ႏွစ္ခုစလံုးတြင္ လိုင္စင္ခ်ထားေပးျခင္း လုပ္ငန္းစဥ္တြင္ ႏိုင္ငံပိုင္လုပ္ငန္းမ်ားက အဓိကပါဝင္သည္။ သို႔ေသာ္ လိုင္စင္ရသူမ်ားကိုသာ ထုတ္ျပန္ေၾကညာၿပီး လုပ္ငန္းစဥ္ဆိုင္ရာ အေသးစိတ္ အခ်က္အလက္မ်ားကို ထုတ္ျပန္ျခင္းမွာ မရွိသေလာက္ျဖစ္သည္။ ယင္းက႑ႏွစ္ခုစလံုးမွ အစိုးရက အခြန္မည္မွ်ေကာက္ခံရရွိသည္၊ ယင္းအခြန္ေငြမ်ားကို ႏိုင္ငံေတာ္ဘတ္ဂ်က္မ်ား ထဲသို႔ မည္သို႔ စီးဝင္သြားသည္ ဆိုသည္ႏွင့္ပတ္သက္၍ ပြင့္လင္းျမင္သာမႈမွာ မရွိသေလာက္ပင္ျဖစ္သည္။ တူးေဖာ္သည့္ကုမၸဏီမ်ားထံမွ ေကာက္ယူရရွိေသာ အခြန္မ်ားႏွင့္ ပတ္သက္သည့္ သတင္းမ်ားကို EITI မွတစ္ဆင့္ ထုတ္ျပန္ေၾကညာသည္။ သို႔ေသာ္ EITI ႏိုင္ငံအစီရင္ခံစာတြင္ ေက်ာက္မ်က္ကုမၸဏီမ်ားႏွင့္ ယင္းတို႔က ေပးေခ်ေသာ ေငြမ်ားကိုသာ ေဖာ္ျပထားသည္။ ယင္းက႑ႏွစ္ခုစလံုးတြင္ အခြန္မ်ားႏွင့္ ေပးေခ်ေငြမ်ားကို ေအဂ်င္စီအခ်ိဳ႕က ေကာက္ခံသည္။ အမ်ားစုကို MOGE ႏွင့္ MGE တို႔က စီမံကိန္းႏွင့္ ဘ႑ာေရးဝန္ႀကီးဌာနေအာက္ရွိ ျပည္တြင္းအခြန္မ်ားဦးစီးဌာန၊ သယံဇာတႏွင့္ သဘာဝပတ္ဝန္းက်င္ ထိန္းသိမ္းေရး ဝန္ႀကီးဌာနနွင့္ လွ်ပ္စစ္ႏွင့္စြမ္းအင္ဝန္ႀကီးဌာနတို႔မွတစ္ဆင့္လည္းေကာင္း၊ ေက်ာက္မ်က္ရတနာမ်ားအတြက္ အခြန္မ်ားကို အေထြေထြအုပ္ခ်ဳပ္ေရး ဦးစီးဌာနမွတစ္ဆင့္ အခြန္ပံုစံမ်ားျဖင့္လည္းေကာင္း ေကာက္ခံသည္။ စာရင္းစစ္ေဆးမႈမ်ားႏွင့္ လက္ေတြ႕ ကိန္းဂဏန္းမ်ားအၾကား ကြာျခားမႈမ်ားရွိပါသည္။ ဥပမာ ထုတ္လုပ္သည့္ကုမၸဏီမ်ားကို အမ်ိဳးသားအခြန္ ေအဂ်င္စီက စာရင္းမစစ္ပါ။ SOEs ၊ MOGE ႏွင့္ MGE တို႔အပါအဝင္ အခြန္ေကာက္ခံသည့္အဖြဲ႕အစ ည္းအမ်ိဳးမ်ိဳးႏွင့္ ပတ္သက္၍ ရလဒ္မ်ားကို စာရင္းစစ္ခ်ဳပ္႐ံုးက စာရင္းစစ္သည္။ ယင္းတိို႔ကို ျပည္သူလူထုအား အသိမေပးပါ။ ထို႔ျပင္ စစ္တပ္ပိုင္ကုမၸဏီမ်ား ျဖစ္ၾကသည့္ ျမန္မာ့စီးပြားေရး ေကာ္ပိုေရးရွင္းႏွင့္ ျမန္မာ့စီးပြားေရး ဦးပိုင္လီမိတက္တို႔သည္ ေက်ာက္မ်က္တူးေဖာ္ေရး က႑တြင္ လုပ္ကိုင္ေဆာင္ရြက္လ်က္ ရွိေသာ္လည္း သမိုင္းေၾကာင္းတစ္ေလွ်ာက္တြင္ ယင္းတို႔ကို စာရင္းစစ္ခ်ဳပ္႐ံုးက စာရင္းစစ္ျခင္းမွ ကင္းလြတ္ခြင့္ရလ်က္ရွိသည္။ SOEs မ်ားကိုကိုင္တြယ္စီမံရာတြင္ ယင္းက႑ႏွစ္ခုအၾကား ကြဲျပားျခားနားမႈမ်ားရွိေနေပသည္။ EITI ႏိုင္ငံအစီရင္ခံစာတြင္ တူးေဖာ္ေရး မဟုတ္ သည့္လုပ္ငန္းမ်ားအတြက္ ကုန္က်စရိတ္မ်ား၊ အစိုးရထံသို႔ေပးသြင္းသည့္ အခြန္ဘ႑ာမ်ား၊ ထုတ္လုပ္မႈပမာဏႏွင့္ MOGE အတြက္တန္ဖိုး စသည္တို႔ကို ေဖာ္ျပထားသည္။ သို႔ေသာ္ ယင္းတြင္ MGE က အစိုးရထံသို႔ေပးသြင္းသည့္ အခြန္စုစုေပါင္းပမာဏသာ ပါဝင္သည္။ ေရနံႏွင့္သဘာဝဓာတ္ေငြ႕က႑ ဘ႑ာအခြန္မ်ားအတြက္ ႏိုင္ငံေတာ္က တစ္စိတ္တစ္ေဒသပိုင္ဆိုင္ေသာ အခြန္ခြဲေဝမႈ ယႏၱရားမ်ား သတ္သတ္ မွတ္မွတ္ မရွိေပ။ ကုမၸဏီမ်ားသည္ လူမႈအဖြဲ႕အစည္းဖြံ႕ၿဖိဳးတိုးတက္ေရး ရန္ပံုေငြမ်ားသို႔ မိမိသေဘာအေလွ်ာက္ ထည့္ဝင္မလွဴဒါန္းႏိုင္ေပ။ သို႔ေသာ္ ေဒသအစိုးရမ်ား၏ အခြန္ထုတ္လုပ္ ႏိုင္စြမ္းမွာ နည္းပါးေသာေၾကာင့္ ဘ႑ာေငြမ်ားကို က်ံဳရာက်ပန္း လႊဲေျပာင္းေပးေနရသျဖင့္ သယံဇာတအခြန္ ဘ႑ာမ်ားခြဲေဝေရးဆိုင္ရာ စနစ္တစ္ခုကို အထူးသျဖင့္ ေရနံႏွင့္သဘာဝဓာတ္ေငြ႕ၾကြယ္ဝေသာ္လည္း ဆင္းရဲေနေသာျပည္နယ္မ်ားတြင္ ခ်မွတ္ရန္ လိုအပ္လ်က္ရွိသည္။
- 24. 2017 Resource Governance Index2017 Índice de la Gobernanza de Recursos Naturales: Colombia (minería) The Natural Resource Governance Institute, an independent, non-profit organization, helps people to realize the benefits of their countries’ oil, gas and mineral wealth through applied research, and innovative approaches to capacity development, technical advice and advocacy. Learn more at www.resourcegovernance.org ၂၀၁၇ခု သယံဇာတ စီမံခန္႔ခြဲမႈ အၫႊန္းကိန္း - ျမန္မာ (ေရနံနွင့္ သဘာ၀ဓါတ္ေငြ႔) ျမန္မာ - ေရနံႏွင့္ သဘာ၀ဓာတ္ေငြ႕ ႏွင့္ သတၱဳတူးေဖာ္မႈ ရမွတ္မ်ား RGI ဆိုသည္မွာအဘယ္နည္း။ ၂၀၁၇ RGI သည္ ၈၁ႏိုင္ငံေသာ သဘာဝသယံဇာတၾကြယ္ဝေသာႏိုင္ငံမ်ားက ယင္းတို႔၏ ေရနံ၊ သဘာဝဓာတ္ေငြ႕ႏွင့္ ဓာတ္သတၳဳမ်ားကို မည္ကဲ့သို႔ ကိုင္တြယ္စီမံသည္ကို အကဲျဖတ္သည္။ အၫႊန္းကိန္းစုစုေပါင္းရမွတ္တြင္ ၃မ်ိဳးပါဝင္သည္။ ထုတ္လုပ္မႈက႑၏ တိုင္းတာမႈဆိုင္ရာ အဓိက လကၡဏာႏွစ္မ်ိဳးမွာ တန္ဖိုးသတ္မွတ္ျခင္းႏွင့္ အခြန္စီမံခန္႔ခြဲမႈတို႔ျဖစ္သည္။ တတိယလကၡဏာျဖစ္သည့္ သဘာဝပတ္ဝန္းက်င္ ထိန္းသိမ္းမႈတြင္ ပိုမိုက်ယ္ျပန္႔ေသာ ကိုင္တြယ္စီမံမႈပါဝင္သည္။ ယင္းကိုင္တြယ္စီမံမႈဆိုင္ရာ ေပါင္းကူးဖြဲ႕ယွက္ေနေသာ ပမာဏသံုးခုတြင္ အစိတ္အပိုင္း ၁၄ ခုျဖင့္ ဖြဲ႕စည္းထားၿပီး ယင္းတို႔တြင္ အၫႊန္းျပကိန္း ၅၁ ခုပါဝင္သည္။ ယင္းတို႔ကို ေမးခြန္းစုစုေပါင္း ၁၃၃ ခုျဖင့္ တြက္ခ်က္သည္။ တန္ဖိုးသတ္မွတ္ျခင္းႏွင့္ အခြန္စီမံခန္႔ခြဲမႈတို႔ႏွင့္ပတ္သက္၍ အဓိကက်ေသာ အခ်က္အလက္မ်ားကို ေကာက္ယူရန္ အတြက္ ၈၁ႏိုင္ငံအနက္ တစ္ႏိုင္ငံခ်င္းစီမွ NRGI က ႀကီးၾကပ္ေသာ သီးျခားလြတ္လပ္သည့္ သုေတသီမ်ားက ေမးခြန္းတစ္စံုစီ ျပဳစုခဲ့သည္။ တတိယလကၡဏာအတြက္ RGI သည္ ႏိုင္ငံတကာအဖြဲ႕အစည္း ၂၀ေက်ာ္မွ ျပင္ပအခ်က္အလက္မ်ားကို ေရးဆြဲသည္။ ယင္းအကဲျဖတ္ခ်က္သည္ ၂၀၁၅-၂၀၁၆ခုႏွစ္ကာလအတြင္း ျဖစ္သည္။ အၫႊန္းကိန္းႏွင့္ ယင္းကိုမည္သို႔ တည္ေဆာက္ခဲ့သည္ဆိုသည္ႏွင့္ ပတ္သက္သည့္ အခ်က္အလက္မ်ားအတြက္ RGI နည္းကိုၾကည့္ပါ။ ■ Mining ■ Oil and gas -100 -50 0 50 100 Resource Governance Index Value realization Licensing Taxation Local Impact State-owned enterprises Revenue management National budgeting Subnational resource revenue sharing Sovereign wealth funds Enabling environment Voice and accountability Government effectiveness Regulatory quality Rule of law Control of corruption Political stability and absence of violence Open data သယံဇာတ စီမံခန္႔ခြဲမႈ အၫႊန္းကိန္း တန္ဖိုးသတ္မွတ္မႈ လိုင္စင္ခ်ထားေပးမႈ အခြန္ေကာက္ခံျခင္း ေဒသတြင္း ထိခိုက္မႈ ႏိုင္ငံပိုင္ လုပ္ငန္းမ်ား အခြန္ေငြ စီမံခန္႔ခြဲမွု ႏိုင္ငံေတာ္ဘတ္ဂ်က္ခ်ထားေပးမႈ ႏိုင္ငံေတာ္က တစ္စိတ္တစ္ေဒသ ပိုင္ေသာ အရင္းအျမစ္အခြန္ခြဲေဝျခင္း အခ်ဳပ္အျခာအာဏာပိုင္ ဓနဥစၥာ ရန္ပုံေငြ သဘာဝပတ္၀န္းက်င္ ထိန္းသိမ္းျခင္း ျပည္သူ႔သေဘာထားႏွင့္ တာ၀န္ခံမႈ အစိုးရ၏ ၾသဇာသက္ေရာက္မႈ ထိန္းညႇိမႈ အရည္အေသြး တရားဥပေဒ စိုးမိုးမႈ အက်င့္ပ်က္ျခစားမႈ ထိန္းခ်ဳပ္ျခင္း ႏိုင္ငံေရးတည္ၿငိမ္မႈႏွင့္ အၾကမ္းဖက္မႈမရွိျခင္း ျမင္သာေသာ အခ်က္အလက္မ်ား သတၱဳတူးေဖာ္ေရး ေရနံနွင့္သဘာဝဓါတ္ေငြ႔
- 26. © 2017 Natural Resource Governance Institute
- 27. 2017 Resource Governance Index
- 28. Foreword 2017 Resource Governance Index 2 | WWW.RESOURCEGOVERNANCEINDEX.ORG E ffective governance of the oil, gas and mining sectors is a persistent challenge, especially for low- and middle-income countries. But as the Resource Governance Index reveals, it is not an insurmountable one. In the index we see many examples of developing countries defying expectations and stereotypes— sometimes in one policy area, sometimes in many—making progress toward a more judicious use of their natural resources for national development. Unfortunately, this is not true for all countries, some having experienced in recent years worrisome setbacks in the proper use of their natural resources. Poor management and corruption can take root anywhere, in countries rich or poor. These scourges cannot be eliminated everywhere, all of the time. But citizens, journalists, legislators, politicians, companies, investors and academics can work to mitigate them, and expose them early on—and that is where the data carefully compiled here by the Natural Resource Governance Institute become so valuable. The staff of our institute have worked hard to provide evidence and documentation to assist in the critical struggle for better natural resource governance. Hopefully the insightful data provided by the index will contribute to the work of those committed to economic prosperity and social justice in resource-producing countries. Ernesto Zedillo Ponce de León Professor in the Field of International Economics and Politics, Yale University Former President of Mexico Chair, Board of Directors Natural Resource Governance Institute
- 29. Introduction WWW.RESOURCEGOVERNANCEINDEX.ORG | 3 T he extraction of oil, gas and minerals is one of the most politically, socially and economically complex undertakings in development. It is a business that connects the world and sates much of our hunger for energy and raw materials. It produces inputs to almost every physical product manufactured. It has contributed to one of the most fundamental challenges in human history—climate change. It has produced trillions of dollars in revenues. These vast sums of money contrast cruelly with the poverty of many countries where resources are found—1.8 billion people live in poverty in the scores of countries assessed in this index.1 The empirical evidence is clear: changing this dire situation requires improving governance—the institutions, rules and practices that determine how company executives and government officials make decisions and engage and affect citizens, communities and the environments they inhabit. To improve governance, one has to diagnose in detail what works and what does not, and that requires measurement. The Resource Governance Index assesses the quality of natural resource governance in 81 countries that together produce, among other commodities, 82 percent of the world’s oil, 78 percent of its gas and 72 percent of all copper.2 The index has as its intellectual foundation the Natural Resource Charter; both are the product of the expertise of NRGI staff and a network of external scholars and practitioners. The index is the sum total of 89 country-level assessments (in eight countries we assess both oil and gas and mining sectors), formulated using a framework of 149 critical questions answered by 150 researchers, drawing upon almost 10,000 supporting documents. Researchers’ careful assessments of extractive sector factors are combined with pre-existing data, from other sources, on countries’ broader enabling environments. The findings presented in this report reflect highlights from a much larger set of data and country profiles available online at www.resourcegovernanceindex.org. So what does the index tell us? The data show that despite substantial efforts from governments, advocates and the international community, in most countries governing resources remains a major challenge. Every country could improve in at least one important area of governance, and most countries have significant room for progress in multiple areas. At the same time, reformers have achieved a great deal. The index shows that many countries— even some in very challenging situations—have taken concrete steps in the form of rules and procedures. Those promoting change need not look far to find inspiration on how to better govern—there are countries pursuing innovative approaches and progressing in every region. The evidence shows that more progress is taking place in the adoption of rules than in their actual practice; often those who seek improved governance should in many places focus on implementing existing legal frameworks. We also learn that better resource governance emerges in countries where civic space is safeguarded and corruption risks are mitigated. Considering the imperative of inclusive growth in resource-rich countries, improvements at the international level are also called for—including by members of the G7, multinational companies and international financial institutions. Work remains for producing countries that seek further economic transformation and diversification, better protection of the environment and assurance that citizens benefit from extraction. The main priorities and preferred pathways to action will vary across countries and actors, which means that informed and inclusive public debate is essential. These dialogues must incorporate politi- cal, economic, social and environmental consider- ations. We trust that the evidence in this index will inform such debates and the resulting decisions. Daniel Kaufmann President and CEO Natural Resource Governance Institute
- 30. Resource Governance Index country scores and rankings 2017 Resource Governance Index 4 | WWW.RESOURCEGOVERNANCEINDEX.ORG 20 40 60 80 100 44th |Ukraine| 43rd |Timor-Leste| 42nd |Tanzania| 41st |Mozambique| 40th |Zambia| 39th |Oman| 38th |KyrgyzRepublic| 37th |Morocco| 36th |Tanzania| 35th |Mali| 34th |Bolivia| 33rd |Kuwait| 32nd |Ecuador| 31st |Niger| 30th |Cameroon| 29th |China| 28th |Côted’Ivoire| 27th |Malaysia| 26th |Tunisia| 25th |Kazakhstan| 24th |Ghana| 23rd |SouthAfrica| 22nd |Argentina| 21st |Philippines| 20th |BurkinaFaso| 19th |Mexico| 18th |Botswana| 17th |Mexico| 16th |Peru| 15th |Mongolia| 14th |TrinidadandTobago| 13th |Ghana| 12th |Indonesia| 11th |Indonesia| 10th |Colombia| 9th |India| 8th |Australia(Western)| 7th |Colombia| 6th |Brazil| 5th |UnitedStatesofAmerica(GulfofMexico)| 4th |Canada(Alberta)| 3rd |UnitedKingdom| 2nd |Chile| 1st |Norway| SCORE 86 81 77 75 74 71 71 71 70 69 68 68 67 64 64 62 61 61 60 59 58 57 57 56 56 56 56 55 55 54 54 54 54 54 53 53 52 51 50 50 50 49 49 49 Oil and gas Mining 2017 Resource Governance Index
- 31. WWW.RESOURCEGOVERNANCEINDEX.ORG | 5 89th |Eritrea| 88th |Turkmenistan| 87th |Libya| 86th |Sudan| 85th |EquatorialGuinea| 84th |DemocraticRepublicofCongo| 83rd |Myanmar| 82nd |Mauritania| 81st |Zimbabwe| 80th |Uzbekistan| 79th |Cambodia| 78th |Yemen| 77th |Myanmar| 76th |SouthSudan| 75th |DemocraticRepublicofCongo| 74th |Venezuela| 73rd |Algeria| 72nd |Chad| 71st |Afghanistan| 70th |Angola| 69th |SaudiArabia| 68th |Madagascar| 67th |Bangladesh| 66th |Cuba| 65th |Gabon| 64th |LaoPDR| 63rd |Guinea| 62nd |Iran| 61st |Iraq| 60th |Egypt| 59th |Bahrain| 58th |Congo| 57th |Ethiopia| 56th |Guatemala| 55th |Nigeria| 54th |UnitedArabEmirates| 53rd |Qatar| 52nd |Liberia| 51st |Uganda| 50th |Russia| 49th |SierraLeone| 48th |Tunisia| 47th |Azerbaijan| 46th |PapuaNewGuinea| 45th |Vietnam| 48 47 47 46 46 45 44 44 43 42 42 41 40 39 39 39 38 38 38 38 36 36 36 36 36 35 34 34 33 33 33 32 31 30 30 29 29 29 27 25 22 21 18 11 10 Good ≥ 75 A country has established laws and practices that are likely to result in extractive resource wealth benefiting citizens, although there may be some costs to society. Satisfactory 60-74 A country has some strong governance procedures and practices, but some areas need improvement. It is reasonably likely that extractive resource wealth benefits citizens, but there may be costs to society. Weak 45-59 A country has a mix of strong and problematic areas of governance. Results indicate that resource extraction can help society, but it is likely that the eventual benefits are weak. Poor 30-44 A country has established some minimal procedures and practices to govern resources, but most elements necessary to ensure society benefits are missing. Failing < 30 A country has almost no governance framework to ensure resource extraction benefits society. It is highly likely that benefits flow only to some companies and elites.
- 32. Creating the 2017 Resource Governance Index 2017 Resource Governance Index 6 | WWW.RESOURCEGOVERNANCEINDEX.ORG 3.40 YUOP▲60.29 RETR▲67.89 3.40 YUOP▲60.29 RETR▲67.89 Creating the 2017 Resource Governance Index NRGI creates a questionnaire consisting of 149 questions. One hundred and fifty experts, in 81 countries, research the issues, compile documentation and complete the questionnaire. 1. 2. NRGI collates and assesses the quality of all collected data. 3. NRGI translates raw data into scores for the two bespoke components of the Resource Governance Index―value realization and revenue management. 4. NRGI collects additional data to capture countries’ “enabling environments”―the broader institutional governance and transparency context. 5. NRGI calculates the index using the primary and secondary data. NRGI publicizes and disseminates the index and provides recommendations to key stakeholders. 8. NRGI analyzes results and generates key findings. 7. 6. Governments, journalists, civil society actors and companies use the findings from the index to improve resource governance for the benefit of citizens and investors. 9.