SlideShare a Scribd company logo
1 of 9
Download to read offline
EMs 
Consumer Staples − Losing Steam? 
October 17, 2014 
© Aranca 2014. All rights reserved. | info@aranca.com | www.aranca.com 
Aranca is an ISO 27001:2013 certified company 
Page | 1 Investment activity in consumer staples remains lackluster, yet selective stock strategy could turn tables Since the beginning of 2013, consumer stocks, especially consumer staples, have underperformed due to the rising investment opportunity across high-growth sectors such as industrials, materials, IT, and utilities. Despite subdued investor interest, consumer stocks offer tremendous opportunity and a selective stock strategy may generate superior returns. Over the short to medium term, we believe selection of consumer staple stocks for investment would be influenced by their ability to generate stable and growing cash flow and to restrict losses during economic headwinds, wider exposure to high-growth emerging markets, focus on innovation, and potential to enhance profitability through cost saving initiatives/restructuring. Tanuja Chitre, Assistant Manager – Investment Research, Aranca 
Good prospects in other sectors weigh down consumer stocks, yet opportunity exists 
Consumer stocks, especially consumer staples, remain defensive during downturn… 
Demand for non-discretionary consumer products (consumer staples) remains relatively steady through various stages of economic cycles due to their fundamental nature. Thus, consumer staple companies can restrict revenue and profitability declines and generate steady cash flow even during downturn. This defensive nature of business makes consumer stocks a preferred investment option during tough economic conditions. 
Given their defensive nature, consumer staples generated superior returns between 2008 and 2013 (global financial crisis until recovery). On the contrary, other sectors whose performance is linked to economic prosperity or that are sensitive to interest rates (for instance, auto, banking, real estate, and infrastructure) reported relatively poor performance during the same period. 
The table below illustrates superior performance of consumer staples’ relative to other sectors in terms of five- and 10-year annualized returns across various regions. 
Heat chart – consumer vis-à-vis other sectors based on five- and 10-year annualized returns 
Source: MSCI Barra; Note: The Investable Market Index (IMI), including large-, mid-, and small-caps across sectors, is considered as of October 16, 2014 
…yet performance is limited during economic recovery and boom 
The defensive nature of consumer staples attracts investors during tough economic conditions; however, during economic boom, investors shift focus to high-growth sectors that offer greater upside potential. Over the past year, the global market recovery has steered investors away from consumer staples to high-growth sectors such as utilities, healthcare, industrials, IT, and financials. 
Period of returnsSectorsEuropeEMUEMWorldACWIEuropeEMUEMWorldACWIConsumer staples8.52%7.68%14.47%7.96%8.26%7.24%5.77%8.20%9.38%9.22% Energy Sector0.58%0.20%5.19%5.19%5.01%-3.22%-4.13%-7.53%1.53%0.19% Financials-2.33%-3.10%8.40%-0.57%0.08%-3.98%-8.55%-0.37%2.61%2.18% Healthcare6.98%5.67%12.56%8.09%8.21%9.70%7.90%11.68%13.39%13.40% IT2.29%1.30%8.11%6.66%6.73%3.87%1.74%7.16%10.21%9.78% Industrials6.26%4.66%7.17%5.74%5.71%3.17%0.32%-1.15%8.13%7.33% Utilities1.91%0.19%8.62%3.46%3.73%-4.38%-9.12%-1.78%1.41%1.03% Telecom Services0.59%-2.57%7.78%2.51%3.30%-1.55%-9.04%0.89%4.50%3.77% Materials5.93%5.36%5.19%5.38%5.27%-0.80%-0.80%-7.24%0.35%-1.12% All sector Average by region2.32%0.91%8.26%4.44%4.68%0.52%-2.98%1.27%5.97%5.38% 10 Yr. Annualized return5 Yr. Annualized returnConsumer sector - Above average returnsConsumer sector - Above average returns
EMs 
Consumer Staples − Losing Steam? 
October 17, 2014 
© Aranca 2014. All rights reserved. | info@aranca.com | www.aranca.com 
Aranca is an ISO 27001:2013 certified company 
P a g e | 2 
Global markets recovering since 2013 
Source: Bloomberg 
Performance of consumer sector varies across phases of economic cycle 
The chart below shows investment preference for consumer staples across different stages of the economic cycle. 
Sector performance along business cycle (2000–14) 
Positive Negative Nearly neutral 
Source: Bloomberg 
Where do we stand? 
During tough economic conditions consumer staples attracted atttntion due to their ability to generate steady cash flow and limit 
declines in revenue and profitability. However, with gradual recovery in global financial markets, investors are moving toward sectors 
highly linked with economic expansion, such as materials, utilities, and technology. These sectors have been performing well, led by 
recovery in transportation, infrastructure, and construction and greater focus on innovation. The charts below compare the performance 
of the S&P consumer staple index with other sectoral indices for different periods between 2008 and 2014. 
60 
80 
100 
120 
140 
160 
180 
Jan-13 Aug-13 Mar-14 Oct-14 
DJI FTSE NKY Sensex CRTX Bovespa SHCOMP 
Investors prefer 
high-growth 
stocks over 
consumer 
staples 
Investors prefer 
high-growth 
stocks over 
consumer 
staples 
Toward the late 
phase, investors 
start moving 
back to 
consumer stocks 
Investors 
primarily prefer 
defensive 
consumer 
staples over 
other sectors 
2000-04 2005-07 2008-12 2013 to date
EMs 
Consumer Staples − Losing Steam? 
October 17, 2014 
© Aranca 2014. All rights reserved. | info@aranca.com | www.aranca.com 
Aranca is an ISO 27001:2013 certified company 
P a g e | 3 
S&P indices: Consumer staples vs. 
others (2008–12) − Crisis 
S&P indices: Consumer staples vs. 
others (2013) − Stability 
S&P indices: Consumer staples vs. 
others (2014–YTD**) − Recovery 
Source: Bloomberg; Note1: *Cons. Stapl. = Consumer staples, IT = Infornation Technology; **YTD refers to period between January 2014 and 22 September 2014 
Between 2008 and 2012, the global economy continued to grapple with the aftermath of the financial crisis of 2008. Hence, returns from 
the defensive consumer staples sector surpassed all other sectors (as reflected in LHS chart above). 
In terms of P/E, consumers stocks have mostly traded at a higher multiple than that of the broader market across business cycles given 
their defensive nature, except 2008 and 2009, as shown in the chart below: 
Index P/E performance: S&P 500 index vs. S&P consumer staples index (2000–14) 
Source: Bloomberg 
During 2008–09, consumer staples witnessed lower P/E levels. This could be due to the delayed impact of the economic crisis on 
emerging economies that enjoyed huge exposure to growth sectors other than consumer staples. However, as all markets tackled 
the consequences of the crisis between 2010 and 2012, consumer staples’s P/E started inching higher than that of the 
broader market, reflecting investor willingness to pay a higher price for consumer stocks during economic downturn. 
With global economic recovery, S&P consumer staples index underperformed the broader S&P 500 index. For the twelve months 
ended September, 2014, the S&P 500 index gained 17.3%, while the consumer staples index returned 13.4%. However, with 
uncertainty in global economic recovery looming large, since the beginning of October 2014, the fall in consumer sector has 
been limited relative to the broader index. Over the first fifteen days of October 2015, S&P 500 index contracted 4.3% while 
consumer staples index contracted just about 0.9%. 
-64.6% 
-16.3% 
-11.2% 
-9.4% 
-2.4% 
-2.2% 
3.4% 
13.5% 
18.4% 
25.0% 
-80% -40% 0% 40% 
Financials 
Telecom 
S&P 500 
Industrials 
Utilities 
Materials 
Healthcare 
IT** 
Energy 
Cons.stapl.* 
26.3% 
12.5% 
13.3% 
12.6% 
-2.8% 
12.3% 
15.5% 
16.9% 
2.1% 
7.7% 
-40% 0% 40% 
Financials 
Telecom 
S&P 500 
Industrials 
Utilities 
Materials 
Healthcare 
IT** 
Energy 
Cons.stapl.* 
8.6% 
4.3% 
9.0% 
4.2% 
12.2% 
9.5% 
16.8% 
15.0% 
6.0% 
5.8% 
0% 40% 
Financials 
Telecom 
S&P 500 
Industrials 
Utilities 
Materials 
Healthcare 
IT** 
Energy 
Cons.stapl.* 
20.46 
18.41 
16.9 
16.61 
17.36 
16.32 
18.44 
15.11 
12.91 
14.1 
17.31 
17.95 
16.60 
20.65 
19.66 
18.77 
20.31 
19.53 
13.74 
14.86 
15.64 
16.03 
16.27 
18.46 
18.93 
18.59 
0 
5 
10 
15 
20 
25 
2003 
2004 
2005 
2006 
2007 
2008 
2009 
2010 
2011 
2012 
2013 
Current 
2014E 
S&P 500 Consumer Staples
EMs 
Consumer Staples − Losing Steam? 
October 17, 2014 
© Aranca 2014. All rights reserved. | info@aranca.com | www.aranca.com 
Aranca is an ISO 27001:2013 certified company 
Page | 4 
S&P 500 index vs. S&P consumer staples index 
Source: Bloomberg; Note: The index values are rebased to 100 
We believe, during boom times consumer staples offer tremendous opportunity and a selective investment strategy may generate higher returns than other growth sectors. For instance, tobacco players are focusing on product innovation. These companies generally attract investor attention due to their ability to generate stable cash flow and provide consistent dividend payments and stock buybacks. However, some tobacco players are seen foraying into e-cigarettes, which reflects additional upside potential through innovation. These stocks could demonstrate superior performance and command premium over other incumbents. Apart from tobacco, consumer staple companies with strong focus on product/services/supply chain innovation, cost savings, and restructuring would continue to trade at a premium. 
Consumer staples: Where is the opportunity? 
With saturation in developed markets, emerging economies remain key driver… 
Consumer staple companies in developed markets continue to face growth pressure due to overall saturation. Near-stagnant disposable income, market maturity, and fierce competition adversely impacted performance. Additionally, depreciation of emerging market currencies against the USD hampered sales growth for companies operating outside the US. 
That said, long-term opportunities across emerging markets are attractive. Rising population, increasing disposable income due to growing ranks of the middle-class population, and rapid urbanization across emerging economies (including India, China, Latin America, and Africa) are expected to support growth in consumer staples. Despite higher growth opportunities relative to developed economies, emerging markets remain a high volume, low margin proposition. Although margins underperform those in developed market (due to infrastructure bottlenecks and higher cost of distribution networks), significantly higher volume growth would ensure profitability. Moreover, as economic expansion in emerging countries continues, gradual improvement in margins would boost profitability. 
…yet risk and reward evaluation is essential to determine performance 
Given the tremendous opportunity, all emerging markets would register substantial growth. A country’s ability to scale up infrastructure (with expansion in consumer base) and address geopolitical and regulatory concerns would determine the degree of success. For instance, despite attractive growth opportunities in the consumer sector in India, multinationals continue to face headwinds from FDI regulations. Likewise, in Latin America, high inflationary pressures and inadequate infrastructure limit entry (and growth) of consumer staple multinationals. Accordingly, global consumer stocks with greater exposure to the right set of emerging markets are likely to be preferred by investors. The key growth regions for the consumer sector and main drivers thereof are shown in the table below: 
95100105110115120125Aug-13Jan-14May-14Oct-14S&P 500 Index− RebasedConsumer Staples Index− Rebased
EMs 
Consumer Staples − Losing Steam? 
October 17, 2014 
© Aranca 2014. All rights reserved. | info@aranca.com | www.aranca.com 
Aranca is an ISO 27001:2013 certified company 
Page | 5 
Consumer staples – key growth regions Region Key drivers of consumer staples 
Asia-Pacific 
 Higher urbanization rate, changing consumption trends, and expanding middle class 
 Changing government policy and rising proportion of earning population to support demand in key markets China and India, respectively 
 91 million urban households in India likely to fall under middle class category by 2030 compared with 22 million in 2010; urbanization rate1 in India estimated to increase to 40% by 2030 from 30% in 2008 (source: 2010 Mckinsey Report – India’s Urban Awakening) 
Latin America 
 Growing population, urbanization and per capita income 
 86% of population is likely to be urbanized by 2050 compared with 80% expected in 2014 (source: UN World Urbanization Prospects – 2014 edition); level of urbanization comparable with developed areas such as Europe and the US 
Africa 
 Rising proportion of young and earning population with growing disposable incomes and higher levels of urbanization 
 Proportion of urban population is likely to increase to 56% by 2050 from 40% expected in 2014 (source: United Nations report on World Urbanization Prospects – 2014 edition) 
Source: News articles 
Overall, demand for consumer staples from emerging economies is expected to increase due to an expanding population base and rising per capita income. The chart below highlights the rapid growth markets for consumer staples: 
Consumer staples − other rapid growth markets across the globe 
Source: International Monetary Fund (IMF); Note1: GDP growth at constant prices is considered above; Note 2: Size of the bubble indicates population in millions 
1 Proportion of urban population to total population 
ChinaIndiaUSIndonesiaBrazilPakistanNigeriaBangladeshMexicoPhilippinesEthiopiaVietnamEgyptIranGermanyTurkeyMyanmarThailandUKFranceItalySouth Africa0.0% 1.0% 2.0% 3.0% 4.0% 5.0% 6.0% 7.0% 8.0% 9.0% 10.0% 0.0%0.5%1.0%1.5%2.0%2.5%3.0% GDP growth Population growthHighlighted section representmarkets with Population growth close to 1% or above 1% GDP growth above 3%
EMs 
Consumer Staples − Losing Steam? 
October 17, 2014 
© Aranca 2014. All rights reserved. | info@aranca.com | www.aranca.com 
Aranca is an ISO 27001:2013 certified company 
Page | 6 
Other drivers of consumer staples 
Health and wellness at the fore 
The global population is becoming increasingly health conscious due to the rising incidence of lifestyle-related cardiovascular diseases and obesity. Hence, more companies are focusing on expanding portfolio to include nutritious products. The table below illustrates consumer staple companies’s shifting focus toward health-based products: 
Consumer staple companies shifting focus to health conscious products Staple segment Companies Efforts 
Beverages 
Pepsi Co, Coca-Cola 
Focus on including non-carbonated drinks such as sports drinks and fruit juices 
Snacks 
Pepsi 
Focus on baked chips over fried chips 
Tobacco 
Lorillard, British American Tobacco, Altria Group 
Introduction of e-cigarettes that are supposed to be less risky than traditional cigarettes 
Source: News articles 
Cost reduction remains key to profitability 
With limited scope for margin expansion through price increases, consumer staple companies across the globe are focusing on cost reduction. Cost-cutting measures such as divestiture of low-margin brands, factory rationalization, centralized distribution, and vertical integration mitigate the adverse impact of inflation in commodity and other input costs. High commodity and input costs remain the primary cause of margin dilution in the consumer staples sector. Some recent examples of cost reduction and restructuring initiatives by consumer staple companies are tabulated below: 
Consumer staple companies focus on cost reduction to improve performance Staple segment Companies Initiatives and their impact 
Essentials 
Unilever 
Between 2012 and 2013, Unilever sold its slow growing North American frozen meal, Wish-Bone salad dressing and Skippy peanut butter businesses to to ConAgra Foods Inc. This step falls in line with Unilevers’ strategy to reduce the size of its brand portfolio from 1,600 (as of 2013) to 400 by 2015 to be able to focus available resources on core categories like personal care and home care. 
Hot beverage: Coffee 
Green Mountain Coffee Roasters Inc. 
Green Mountain Coffee Roasters Inc. is focusing on improving efficiency through cost reduction. By 2015, the company targets to save USD70–100 million by improving operational productivity. 
Snacks & Beverages 
Pepsi Co. 
Pepsi Co. announced a five-year annual productivity plan for 2013–19. In 2013, the company achieved productivity-related cost savings of USD 2billion. By 2019, Pepsi aims to save USD1 billion each year through improved productivity. 
Beverages 
Coca-Cola 
In 2012, Coca-Cola launched a four-year productivity improvement program. Under this, Coca-Cola aims to improve supply chain, marketing and innovation efforts; standardize information systems; and integrate its bottling and distribution operations acquired from Coca-Cola Enterprises, North America. These activities are expected to generate incremental earnings of USD550–600 million by 2015. 
Source: News articles
EMs 
Consumer Staples − Losing Steam? 
October 17, 2014 
© Aranca 2014. All rights reserved. | info@aranca.com | www.aranca.com 
Aranca is an ISO 27001:2013 certified company 
P a g e | 7 
Changing consumption trends across emerging markets present new opportunity 
Rising disposable income and changing lifestyles (urbanization) have boosted demand for packed foods in emerging economies. Unlike 
mature markets, emerging economies remain relatively untapped, thus offering significant potential in the packaged food and ready-to-eat 
(RTE) segment. While emerging markets primarily offer volume proposition, demand for packaged/RTE food is steadily giving way 
to an evolving high-margin trend. In this category, emerging countries could soon present margin-enhancing opportunity for 
multinational consumer staple companies. 
Americas and Asia-Pacific remain preferred destinations for M&A deals 
With limited scope for profitability improvement, consumer staple companies are increasingly focusing on strategic partnerships and 
mergers/acquisitions to generate additional revenues by: 
 Leveraging scale of operations 
 Improving distribution/marketing efficiency 
 Reducing cost through vertical integration across value chain 
 Capturing additional customer base by expanding in unexplored markets 
 Introducing new products 
Broadly, M&A activity in consumer staples is subject to the quality of the target company. The selection depends on the target’s ability 
to add value in terms of products, geographic dispersion or productivity enhancement. According to the M&A Transaction Tracker by 
American Appraisal, the consumer staples sector recorded 502 transactions in the twelve months ended June 30, 2014. In terms of 
value, the transactions accounted for 6% (or USD149.3) of the M&A deals during the same period. Geographically, 90% of the deals (in 
value terms) were carried out in North America & Canada (35%), Europe (32%), and Asia-Pacific (23%). 
Consumer staples – deal value by geography Region-wise EBITDA multiples for consumer staples 
Source: American Appraisal M&A Transaction Tracker, released in Q2-2014; Note: The 
deal value is for 12 months ended June 30, 2014 
Source: American Appraisal M&A Transaction Tracker, released in Q2-2014; Note: 
The revenue and EBITDA multiples by region are for 12 months ended June 30, 
2014; Median EBITDA multiples are provided above 
Product innovation may sustain market position/profitability 
Apart from M&A and strategic partnerships, consumer staple companies are focusing on product innovation to bolster revenue and 
profitability. Through innovation, companies aim to offer differentiated products, thereby maintaining (and improving) their competitive 
market positioning. For instance, Pepsi Co’s new soda dispenser, ‘Spire’, allows customers to create up to 1000 different soda drinks. 
This dispenser was primarily launched to improve competitive positioning vis-à-vis Coca-Cola that has been operating ‘Freestyle’ 
Africa/Middle East Asia-Pacific 
Europe Latin America and Caribbean 
US and Canada 
11.2 
10 
8.9 
10.7 10.9 
10.2 
0 
2 
4 
6 
8 
10 
12 
US& Canada 
LatAm & 
Caribbean 
Europe 
Asia-Pacific 
Africa/Middle 
East 
Total
EMs 
Consumer Staples − Losing Steam? 
October 17, 2014 
© Aranca 2014. All rights reserved. | info@aranca.com | www.aranca.com 
Aranca is an ISO 27001:2013 certified company 
Page | 8 
fountain machines since 2009. Similarly, Kimberly Clark plans to offer various innovative products across the baby diapers and wipes categories in North America. 
The way forward 
Since 2012, the consumer staples segment has been facing macroeconomic headwinds and the situation is unlikely to change over the short term. In 2014, the trading environment is expected to remain tough due to continued cautious spending in both developed and emerging markets consumer. Additionally, political unrest in certain countries has adversely impacted operations of multinational consumer companies. Despite the tough environment, consumer staple companies that focus on value addition through strategic partnerships/tie-ups, product innovation, and cost-savings initiatives stand a better chance to bolster profitability over the short to medium term.
EMs 
Consumer Staples − Losing Steam? 
October 17, 2014 
© Aranca 2014. All rights reserved. | info@aranca.com | www.aranca.com 
Aranca is an ISO 27001:2013 certified company 
Page | 9 
ARANCA DISCLAIMER 
This report is published by Aranca, Inc. Aranca is a customized research and analytics services provider to global clients. 
The information contained in this document is confidential and is solely for use of those persons to whom it is addressed and may not be reproduced, further distributed to any other person or published, in whole or in part, for any purpose. 
This document is based on data sources that are publicly available and are thought to be reliable. Aranca may not have verified all of this information with third parties. Neither Aranca nor its advisors, directors or employees can guarantee the accuracy, reasonableness or completeness of the information received from any sources consulted for this publication, and neither Aranca nor its advisors, directors or employees accepts any liability whatsoever (in negligence or otherwise) for any loss howsoever arising from any use of this document or its contents or otherwise arising in connection with this document. 
Further, this document is not an offer to buy or sell any security, commodity or currency. This document does not provide individually tailored investment advice. It has been prepared without regard to the individual financial circumstances and objectives of persons who receive it. The appropriateness of a particular investment or currency will depend on an investor’s individual circumstances and objectives. The investments referred to in this document may not be suitable for all investors. This document is not to be relied upon and should not be used in substitution for the exercise of independent judgment. 
This document may contain certain statements, estimates, and projections with respect to the anticipated future performance of securities, commodities or currencies suggested. Such statements, estimates, and projections are based on information that we consider reliable and may reflect various assumptions made concerning anticipated economic developments, which have not been independently verified and may or may not prove correct. No representation or warranty is made as to the accuracy of such statements, estimates, and projections or as to its fitness for the purpose intended and it should not be relied upon as such. Opinions expressed are our current opinions as of the date appearing on this material only and may change without notice. 
© 2014, Aranca. All rights reserved.

More Related Content

What's hot

Optimal diversification & the energy transition
Optimal diversification & the energy transitionOptimal diversification & the energy transition
Optimal diversification & the energy transitionAlexandre Gorius
 
Beyond the Core: Secondary Revenue
Beyond the Core: Secondary RevenueBeyond the Core: Secondary Revenue
Beyond the Core: Secondary RevenueWebloyalty UK
 
Microeconomic
Microeconomic Microeconomic
Microeconomic UTAR
 
Competitive intelligence - industry research and benchmarking
Competitive intelligence -  industry research and benchmarkingCompetitive intelligence -  industry research and benchmarking
Competitive intelligence - industry research and benchmarkingR Pagell
 
2015 Aerospace & Defense Market Survey
2015 Aerospace & Defense Market Survey2015 Aerospace & Defense Market Survey
2015 Aerospace & Defense Market SurveySeda Eskiler
 
Factbook2016_24-09-16_LR
Factbook2016_24-09-16_LRFactbook2016_24-09-16_LR
Factbook2016_24-09-16_LRIvan Chan
 
Winning The Race To Value - Vendavo in Aftermarket Spare Parts Industries _ I...
Winning The Race To Value - Vendavo in Aftermarket Spare Parts Industries _ I...Winning The Race To Value - Vendavo in Aftermarket Spare Parts Industries _ I...
Winning The Race To Value - Vendavo in Aftermarket Spare Parts Industries _ I...Caroline Burns
 
CSC's 2015 Aerospace and Defence Market Survey (in association with AIA)
CSC's 2015 Aerospace and Defence Market Survey (in association with AIA)CSC's 2015 Aerospace and Defence Market Survey (in association with AIA)
CSC's 2015 Aerospace and Defence Market Survey (in association with AIA)Pavandeep Virk
 
Surge Protection Devices Market : Size will Escalate Rapidly in 2017 - 2025
Surge Protection Devices Market : Size will Escalate Rapidly in 2017 - 2025Surge Protection Devices Market : Size will Escalate Rapidly in 2017 - 2025
Surge Protection Devices Market : Size will Escalate Rapidly in 2017 - 2025minutmr
 
BPN Istanbul Technical Consumer Goods Market Research
BPN Istanbul Technical Consumer Goods Market Research BPN Istanbul Technical Consumer Goods Market Research
BPN Istanbul Technical Consumer Goods Market Research BPN
 
Market Concentration
Market ConcentrationMarket Concentration
Market Concentrationtutor2u
 
Future of manufacturing in China -2016 version
Future of manufacturing in China -2016 versionFuture of manufacturing in China -2016 version
Future of manufacturing in China -2016 versionFred Lemoine
 
Industrial Automation: Global Demand Continues to Rise | An Aranca Infographic
Industrial Automation: Global Demand Continues to Rise | An Aranca InfographicIndustrial Automation: Global Demand Continues to Rise | An Aranca Infographic
Industrial Automation: Global Demand Continues to Rise | An Aranca InfographicAranca
 

What's hot (17)

Optimal diversification & the energy transition
Optimal diversification & the energy transitionOptimal diversification & the energy transition
Optimal diversification & the energy transition
 
Beyond the Core: Secondary Revenue
Beyond the Core: Secondary RevenueBeyond the Core: Secondary Revenue
Beyond the Core: Secondary Revenue
 
Microeconomic
Microeconomic Microeconomic
Microeconomic
 
Competitive intelligence - industry research and benchmarking
Competitive intelligence -  industry research and benchmarkingCompetitive intelligence -  industry research and benchmarking
Competitive intelligence - industry research and benchmarking
 
2015 Aerospace & Defense Market Survey
2015 Aerospace & Defense Market Survey2015 Aerospace & Defense Market Survey
2015 Aerospace & Defense Market Survey
 
Market Concentration
Market ConcentrationMarket Concentration
Market Concentration
 
Factbook2016_24-09-16_LR
Factbook2016_24-09-16_LRFactbook2016_24-09-16_LR
Factbook2016_24-09-16_LR
 
Winning The Race To Value - Vendavo in Aftermarket Spare Parts Industries _ I...
Winning The Race To Value - Vendavo in Aftermarket Spare Parts Industries _ I...Winning The Race To Value - Vendavo in Aftermarket Spare Parts Industries _ I...
Winning The Race To Value - Vendavo in Aftermarket Spare Parts Industries _ I...
 
CSC's 2015 Aerospace and Defence Market Survey (in association with AIA)
CSC's 2015 Aerospace and Defence Market Survey (in association with AIA)CSC's 2015 Aerospace and Defence Market Survey (in association with AIA)
CSC's 2015 Aerospace and Defence Market Survey (in association with AIA)
 
Ch3dem13
Ch3dem13Ch3dem13
Ch3dem13
 
Surge Protection Devices Market : Size will Escalate Rapidly in 2017 - 2025
Surge Protection Devices Market : Size will Escalate Rapidly in 2017 - 2025Surge Protection Devices Market : Size will Escalate Rapidly in 2017 - 2025
Surge Protection Devices Market : Size will Escalate Rapidly in 2017 - 2025
 
BPN Istanbul Technical Consumer Goods Market Research
BPN Istanbul Technical Consumer Goods Market Research BPN Istanbul Technical Consumer Goods Market Research
BPN Istanbul Technical Consumer Goods Market Research
 
Market Concentration
Market ConcentrationMarket Concentration
Market Concentration
 
Creating Value in the F&B
Creating Value in the F&BCreating Value in the F&B
Creating Value in the F&B
 
Cloud_Computing_Top_Markets_Report-2
Cloud_Computing_Top_Markets_Report-2Cloud_Computing_Top_Markets_Report-2
Cloud_Computing_Top_Markets_Report-2
 
Future of manufacturing in China -2016 version
Future of manufacturing in China -2016 versionFuture of manufacturing in China -2016 version
Future of manufacturing in China -2016 version
 
Industrial Automation: Global Demand Continues to Rise | An Aranca Infographic
Industrial Automation: Global Demand Continues to Rise | An Aranca InfographicIndustrial Automation: Global Demand Continues to Rise | An Aranca Infographic
Industrial Automation: Global Demand Continues to Rise | An Aranca Infographic
 

Similar to Aranca views - Consumer Staples − Losing Steam?

Industrial Distribution Industry Insights - January 2015
Industrial Distribution Industry Insights - January 2015 Industrial Distribution Industry Insights - January 2015
Industrial Distribution Industry Insights - January 2015 Duff & Phelps
 
Market Research Report : Retail market in india 2014 - Sample
Market Research Report : Retail market in india 2014 - SampleMarket Research Report : Retail market in india 2014 - Sample
Market Research Report : Retail market in india 2014 - SampleNetscribes, Inc.
 
Accenture Spend Trends Report Q2 2014
Accenture Spend Trends Report Q2 2014Accenture Spend Trends Report Q2 2014
Accenture Spend Trends Report Q2 2014accenture
 
Accenture Spend Trends Report Q3 2014
Accenture Spend Trends Report Q3 2014Accenture Spend Trends Report Q3 2014
Accenture Spend Trends Report Q3 2014accenture
 
energy drinks market
energy drinks marketenergy drinks market
energy drinks marketsnehalkasat
 
Eyeota Annual Index 2015 - Audience Data Trends in Europe
Eyeota Annual Index 2015 - Audience Data Trends in EuropeEyeota Annual Index 2015 - Audience Data Trends in Europe
Eyeota Annual Index 2015 - Audience Data Trends in EuropeLaura Keeling
 
sector investing
sector investingsector investing
sector investingbayberry2
 
Dragon Fund_Sector Update
Dragon Fund_Sector UpdateDragon Fund_Sector Update
Dragon Fund_Sector UpdateSara Golshahr
 
The Future of Utilities Special Report 2014
The Future of Utilities Special Report 2014The Future of Utilities Special Report 2014
The Future of Utilities Special Report 2014WNS Global Services
 
IDFC Large Cap Fund_Quarterly note
IDFC Large Cap Fund_Quarterly noteIDFC Large Cap Fund_Quarterly note
IDFC Large Cap Fund_Quarterly noteIDFCJUBI
 
IDFC Large Cap Fund_Quarterly note
IDFC Large Cap Fund_Quarterly noteIDFC Large Cap Fund_Quarterly note
IDFC Large Cap Fund_Quarterly noteRahulpathak154
 
Quarterly note
Quarterly noteQuarterly note
Quarterly noteidfcmfjubi
 
IDFC Large Cap Fund _Quarterly note
IDFC Large Cap Fund _Quarterly noteIDFC Large Cap Fund _Quarterly note
IDFC Large Cap Fund _Quarterly noteJubiIDFCEquity
 
Eyeota Annual Index 2015
Eyeota Annual Index 2015Eyeota Annual Index 2015
Eyeota Annual Index 2015Joyce Lin
 
“Diving into the Swadesi and Videsi Brands”
“Diving into the Swadesi and Videsi Brands”“Diving into the Swadesi and Videsi Brands”
“Diving into the Swadesi and Videsi Brands”IRJET Journal
 
Avant garde wealth mgmt - Quarterly letter - 1306
Avant garde wealth mgmt - Quarterly letter - 1306Avant garde wealth mgmt - Quarterly letter - 1306
Avant garde wealth mgmt - Quarterly letter - 1306Gaurav Jalan
 
Home care in pakistan
Home care in pakistanHome care in pakistan
Home care in pakistanlinda3395
 

Similar to Aranca views - Consumer Staples − Losing Steam? (20)

Industrial Distribution Industry Insights - January 2015
Industrial Distribution Industry Insights - January 2015 Industrial Distribution Industry Insights - January 2015
Industrial Distribution Industry Insights - January 2015
 
Market Research Report : Retail market in india 2014 - Sample
Market Research Report : Retail market in india 2014 - SampleMarket Research Report : Retail market in india 2014 - Sample
Market Research Report : Retail market in india 2014 - Sample
 
Accenture Spend Trends Report Q2 2014
Accenture Spend Trends Report Q2 2014Accenture Spend Trends Report Q2 2014
Accenture Spend Trends Report Q2 2014
 
Accenture Spend Trends Report Q3 2014
Accenture Spend Trends Report Q3 2014Accenture Spend Trends Report Q3 2014
Accenture Spend Trends Report Q3 2014
 
energy drinks market
energy drinks marketenergy drinks market
energy drinks market
 
energy drinks market
energy drinks marketenergy drinks market
energy drinks market
 
Eyeota Annual Index 2015 - Audience Data Trends in Europe
Eyeota Annual Index 2015 - Audience Data Trends in EuropeEyeota Annual Index 2015 - Audience Data Trends in Europe
Eyeota Annual Index 2015 - Audience Data Trends in Europe
 
sector investing
sector investingsector investing
sector investing
 
Dragon Fund_Sector Update
Dragon Fund_Sector UpdateDragon Fund_Sector Update
Dragon Fund_Sector Update
 
The Future of Utilities Special Report 2014
The Future of Utilities Special Report 2014The Future of Utilities Special Report 2014
The Future of Utilities Special Report 2014
 
ENERGY CALL JAN 2015
ENERGY CALL JAN 2015ENERGY CALL JAN 2015
ENERGY CALL JAN 2015
 
IDFC Large Cap Fund_Quarterly note
IDFC Large Cap Fund_Quarterly noteIDFC Large Cap Fund_Quarterly note
IDFC Large Cap Fund_Quarterly note
 
IDFC Large Cap Fund_Quarterly note
IDFC Large Cap Fund_Quarterly noteIDFC Large Cap Fund_Quarterly note
IDFC Large Cap Fund_Quarterly note
 
Quarterly note
Quarterly noteQuarterly note
Quarterly note
 
IDFC Large Cap Fund _Quarterly note
IDFC Large Cap Fund _Quarterly noteIDFC Large Cap Fund _Quarterly note
IDFC Large Cap Fund _Quarterly note
 
Vestas
VestasVestas
Vestas
 
Eyeota Annual Index 2015
Eyeota Annual Index 2015Eyeota Annual Index 2015
Eyeota Annual Index 2015
 
“Diving into the Swadesi and Videsi Brands”
“Diving into the Swadesi and Videsi Brands”“Diving into the Swadesi and Videsi Brands”
“Diving into the Swadesi and Videsi Brands”
 
Avant garde wealth mgmt - Quarterly letter - 1306
Avant garde wealth mgmt - Quarterly letter - 1306Avant garde wealth mgmt - Quarterly letter - 1306
Avant garde wealth mgmt - Quarterly letter - 1306
 
Home care in pakistan
Home care in pakistanHome care in pakistan
Home care in pakistan
 

More from Aranca

French Animal Healthcare Market
French Animal Healthcare MarketFrench Animal Healthcare Market
French Animal Healthcare MarketAranca
 
Global wearable devices market2017
Global wearable devices market2017Global wearable devices market2017
Global wearable devices market2017Aranca
 
Commercial drones-future-prospects 2017
Commercial drones-future-prospects 2017Commercial drones-future-prospects 2017
Commercial drones-future-prospects 2017Aranca
 
The GCC Facilities Management Market - Aranca
The GCC Facilities Management Market - ArancaThe GCC Facilities Management Market - Aranca
The GCC Facilities Management Market - ArancaAranca
 
Brazilian pesticide market - Aranca
Brazilian pesticide market - ArancaBrazilian pesticide market - Aranca
Brazilian pesticide market - ArancaAranca
 
Global Cryogenic Equipment Industry
Global Cryogenic Equipment IndustryGlobal Cryogenic Equipment Industry
Global Cryogenic Equipment IndustryAranca
 
China's Elevator and Escalator Market
China's Elevator and Escalator MarketChina's Elevator and Escalator Market
China's Elevator and Escalator MarketAranca
 
Global Aluminium Automotive Sheets Market
Global Aluminium Automotive Sheets MarketGlobal Aluminium Automotive Sheets Market
Global Aluminium Automotive Sheets MarketAranca
 
Indian Agro Chemical Sector
Indian Agro Chemical SectorIndian Agro Chemical Sector
Indian Agro Chemical SectorAranca
 
Chinas Luxury Market - Losing Sheen
Chinas Luxury Market - Losing SheenChinas Luxury Market - Losing Sheen
Chinas Luxury Market - Losing SheenAranca
 
Saudi Aramco IPO - A Reality of Mythical Proportions
Saudi Aramco IPO - A Reality of Mythical ProportionsSaudi Aramco IPO - A Reality of Mythical Proportions
Saudi Aramco IPO - A Reality of Mythical ProportionsAranca
 
Fatca high cost initiative to curb tax evasion
Fatca high cost initiative to curb tax evasionFatca high cost initiative to curb tax evasion
Fatca high cost initiative to curb tax evasionAranca
 
Winning shelf space private labels or fmcg brands
Winning shelf space private labels or fmcg brandsWinning shelf space private labels or fmcg brands
Winning shelf space private labels or fmcg brandsAranca
 
The disruptive power of virtual currency
The disruptive power of virtual currencyThe disruptive power of virtual currency
The disruptive power of virtual currencyAranca
 
Obamacare - Sectoral Winners and Losers
Obamacare - Sectoral Winners and LosersObamacare - Sectoral Winners and Losers
Obamacare - Sectoral Winners and LosersAranca
 
Therapeutic Vaccines for Alzheimer’s — Are We Close Enough?
Therapeutic Vaccines for Alzheimer’s — Are We Close Enough?Therapeutic Vaccines for Alzheimer’s — Are We Close Enough?
Therapeutic Vaccines for Alzheimer’s — Are We Close Enough?Aranca
 
Indian Telecom Tower Industry - Aranca Research
Indian Telecom Tower Industry - Aranca ResearchIndian Telecom Tower Industry - Aranca Research
Indian Telecom Tower Industry - Aranca ResearchAranca
 
Rise of Virtual Reality (VR)
Rise of Virtual Reality (VR)Rise of Virtual Reality (VR)
Rise of Virtual Reality (VR)Aranca
 
Insurance Industry is Going to Soar in the GCC
Insurance Industry is Going to Soar in the GCCInsurance Industry is Going to Soar in the GCC
Insurance Industry is Going to Soar in the GCCAranca
 
Evolution of Powered Exoskeletons
Evolution of Powered ExoskeletonsEvolution of Powered Exoskeletons
Evolution of Powered ExoskeletonsAranca
 

More from Aranca (20)

French Animal Healthcare Market
French Animal Healthcare MarketFrench Animal Healthcare Market
French Animal Healthcare Market
 
Global wearable devices market2017
Global wearable devices market2017Global wearable devices market2017
Global wearable devices market2017
 
Commercial drones-future-prospects 2017
Commercial drones-future-prospects 2017Commercial drones-future-prospects 2017
Commercial drones-future-prospects 2017
 
The GCC Facilities Management Market - Aranca
The GCC Facilities Management Market - ArancaThe GCC Facilities Management Market - Aranca
The GCC Facilities Management Market - Aranca
 
Brazilian pesticide market - Aranca
Brazilian pesticide market - ArancaBrazilian pesticide market - Aranca
Brazilian pesticide market - Aranca
 
Global Cryogenic Equipment Industry
Global Cryogenic Equipment IndustryGlobal Cryogenic Equipment Industry
Global Cryogenic Equipment Industry
 
China's Elevator and Escalator Market
China's Elevator and Escalator MarketChina's Elevator and Escalator Market
China's Elevator and Escalator Market
 
Global Aluminium Automotive Sheets Market
Global Aluminium Automotive Sheets MarketGlobal Aluminium Automotive Sheets Market
Global Aluminium Automotive Sheets Market
 
Indian Agro Chemical Sector
Indian Agro Chemical SectorIndian Agro Chemical Sector
Indian Agro Chemical Sector
 
Chinas Luxury Market - Losing Sheen
Chinas Luxury Market - Losing SheenChinas Luxury Market - Losing Sheen
Chinas Luxury Market - Losing Sheen
 
Saudi Aramco IPO - A Reality of Mythical Proportions
Saudi Aramco IPO - A Reality of Mythical ProportionsSaudi Aramco IPO - A Reality of Mythical Proportions
Saudi Aramco IPO - A Reality of Mythical Proportions
 
Fatca high cost initiative to curb tax evasion
Fatca high cost initiative to curb tax evasionFatca high cost initiative to curb tax evasion
Fatca high cost initiative to curb tax evasion
 
Winning shelf space private labels or fmcg brands
Winning shelf space private labels or fmcg brandsWinning shelf space private labels or fmcg brands
Winning shelf space private labels or fmcg brands
 
The disruptive power of virtual currency
The disruptive power of virtual currencyThe disruptive power of virtual currency
The disruptive power of virtual currency
 
Obamacare - Sectoral Winners and Losers
Obamacare - Sectoral Winners and LosersObamacare - Sectoral Winners and Losers
Obamacare - Sectoral Winners and Losers
 
Therapeutic Vaccines for Alzheimer’s — Are We Close Enough?
Therapeutic Vaccines for Alzheimer’s — Are We Close Enough?Therapeutic Vaccines for Alzheimer’s — Are We Close Enough?
Therapeutic Vaccines for Alzheimer’s — Are We Close Enough?
 
Indian Telecom Tower Industry - Aranca Research
Indian Telecom Tower Industry - Aranca ResearchIndian Telecom Tower Industry - Aranca Research
Indian Telecom Tower Industry - Aranca Research
 
Rise of Virtual Reality (VR)
Rise of Virtual Reality (VR)Rise of Virtual Reality (VR)
Rise of Virtual Reality (VR)
 
Insurance Industry is Going to Soar in the GCC
Insurance Industry is Going to Soar in the GCCInsurance Industry is Going to Soar in the GCC
Insurance Industry is Going to Soar in the GCC
 
Evolution of Powered Exoskeletons
Evolution of Powered ExoskeletonsEvolution of Powered Exoskeletons
Evolution of Powered Exoskeletons
 

Recently uploaded

Eni 2024 1Q Results - 24.04.24 business.
Eni 2024 1Q Results - 24.04.24 business.Eni 2024 1Q Results - 24.04.24 business.
Eni 2024 1Q Results - 24.04.24 business.Eni
 
Call Girls In Connaught Place Delhi ❤️88604**77959_Russian 100% Genuine Escor...
Call Girls In Connaught Place Delhi ❤️88604**77959_Russian 100% Genuine Escor...Call Girls In Connaught Place Delhi ❤️88604**77959_Russian 100% Genuine Escor...
Call Girls In Connaught Place Delhi ❤️88604**77959_Russian 100% Genuine Escor...lizamodels9
 
Keppel Ltd. 1Q 2024 Business Update Presentation Slides
Keppel Ltd. 1Q 2024 Business Update  Presentation SlidesKeppel Ltd. 1Q 2024 Business Update  Presentation Slides
Keppel Ltd. 1Q 2024 Business Update Presentation SlidesKeppelCorporation
 
Lean: From Theory to Practice — One City’s (and Library’s) Lean Story… Abridged
Lean: From Theory to Practice — One City’s (and Library’s) Lean Story… AbridgedLean: From Theory to Practice — One City’s (and Library’s) Lean Story… Abridged
Lean: From Theory to Practice — One City’s (and Library’s) Lean Story… AbridgedKaiNexus
 
Call Girls In Sikandarpur Gurgaon ❤️8860477959_Russian 100% Genuine Escorts I...
Call Girls In Sikandarpur Gurgaon ❤️8860477959_Russian 100% Genuine Escorts I...Call Girls In Sikandarpur Gurgaon ❤️8860477959_Russian 100% Genuine Escorts I...
Call Girls In Sikandarpur Gurgaon ❤️8860477959_Russian 100% Genuine Escorts I...lizamodels9
 
Progress Report - Oracle Database Analyst Summit
Progress  Report - Oracle Database Analyst SummitProgress  Report - Oracle Database Analyst Summit
Progress Report - Oracle Database Analyst SummitHolger Mueller
 
BEST Call Girls In Greater Noida ✨ 9773824855 ✨ Escorts Service In Delhi Ncr,
BEST Call Girls In Greater Noida ✨ 9773824855 ✨ Escorts Service In Delhi Ncr,BEST Call Girls In Greater Noida ✨ 9773824855 ✨ Escorts Service In Delhi Ncr,
BEST Call Girls In Greater Noida ✨ 9773824855 ✨ Escorts Service In Delhi Ncr,noida100girls
 
Regression analysis: Simple Linear Regression Multiple Linear Regression
Regression analysis:  Simple Linear Regression Multiple Linear RegressionRegression analysis:  Simple Linear Regression Multiple Linear Regression
Regression analysis: Simple Linear Regression Multiple Linear RegressionRavindra Nath Shukla
 
Grateful 7 speech thanking everyone that has helped.pdf
Grateful 7 speech thanking everyone that has helped.pdfGrateful 7 speech thanking everyone that has helped.pdf
Grateful 7 speech thanking everyone that has helped.pdfPaul Menig
 
/:Call Girls In Jaypee Siddharth - 5 Star Hotel New Delhi ➥9990211544 Top Esc...
/:Call Girls In Jaypee Siddharth - 5 Star Hotel New Delhi ➥9990211544 Top Esc.../:Call Girls In Jaypee Siddharth - 5 Star Hotel New Delhi ➥9990211544 Top Esc...
/:Call Girls In Jaypee Siddharth - 5 Star Hotel New Delhi ➥9990211544 Top Esc...lizamodels9
 
Cash Payment 9602870969 Escort Service in Udaipur Call Girls
Cash Payment 9602870969 Escort Service in Udaipur Call GirlsCash Payment 9602870969 Escort Service in Udaipur Call Girls
Cash Payment 9602870969 Escort Service in Udaipur Call GirlsApsara Of India
 
Banana Powder Manufacturing Plant Project Report 2024 Edition.pptx
Banana Powder Manufacturing Plant Project Report 2024 Edition.pptxBanana Powder Manufacturing Plant Project Report 2024 Edition.pptx
Banana Powder Manufacturing Plant Project Report 2024 Edition.pptxgeorgebrinton95
 
Call Girls Navi Mumbai Just Call 9907093804 Top Class Call Girl Service Avail...
Call Girls Navi Mumbai Just Call 9907093804 Top Class Call Girl Service Avail...Call Girls Navi Mumbai Just Call 9907093804 Top Class Call Girl Service Avail...
Call Girls Navi Mumbai Just Call 9907093804 Top Class Call Girl Service Avail...Dipal Arora
 
2024 Numerator Consumer Study of Cannabis Usage
2024 Numerator Consumer Study of Cannabis Usage2024 Numerator Consumer Study of Cannabis Usage
2024 Numerator Consumer Study of Cannabis UsageNeil Kimberley
 
GD Birla and his contribution in management
GD Birla and his contribution in managementGD Birla and his contribution in management
GD Birla and his contribution in managementchhavia330
 
0183760ssssssssssssssssssssssssssss00101011 (27).pdf
0183760ssssssssssssssssssssssssssss00101011 (27).pdf0183760ssssssssssssssssssssssssssss00101011 (27).pdf
0183760ssssssssssssssssssssssssssss00101011 (27).pdfRenandantas16
 
BEST Call Girls In Old Faridabad ✨ 9773824855 ✨ Escorts Service In Delhi Ncr,
BEST Call Girls In Old Faridabad ✨ 9773824855 ✨ Escorts Service In Delhi Ncr,BEST Call Girls In Old Faridabad ✨ 9773824855 ✨ Escorts Service In Delhi Ncr,
BEST Call Girls In Old Faridabad ✨ 9773824855 ✨ Escorts Service In Delhi Ncr,noida100girls
 
RE Capital's Visionary Leadership under Newman Leech
RE Capital's Visionary Leadership under Newman LeechRE Capital's Visionary Leadership under Newman Leech
RE Capital's Visionary Leadership under Newman LeechNewman George Leech
 
Call Girls in Gomti Nagar - 7388211116 - With room Service
Call Girls in Gomti Nagar - 7388211116  - With room ServiceCall Girls in Gomti Nagar - 7388211116  - With room Service
Call Girls in Gomti Nagar - 7388211116 - With room Servicediscovermytutordmt
 

Recently uploaded (20)

Eni 2024 1Q Results - 24.04.24 business.
Eni 2024 1Q Results - 24.04.24 business.Eni 2024 1Q Results - 24.04.24 business.
Eni 2024 1Q Results - 24.04.24 business.
 
Call Girls In Connaught Place Delhi ❤️88604**77959_Russian 100% Genuine Escor...
Call Girls In Connaught Place Delhi ❤️88604**77959_Russian 100% Genuine Escor...Call Girls In Connaught Place Delhi ❤️88604**77959_Russian 100% Genuine Escor...
Call Girls In Connaught Place Delhi ❤️88604**77959_Russian 100% Genuine Escor...
 
Keppel Ltd. 1Q 2024 Business Update Presentation Slides
Keppel Ltd. 1Q 2024 Business Update  Presentation SlidesKeppel Ltd. 1Q 2024 Business Update  Presentation Slides
Keppel Ltd. 1Q 2024 Business Update Presentation Slides
 
Lean: From Theory to Practice — One City’s (and Library’s) Lean Story… Abridged
Lean: From Theory to Practice — One City’s (and Library’s) Lean Story… AbridgedLean: From Theory to Practice — One City’s (and Library’s) Lean Story… Abridged
Lean: From Theory to Practice — One City’s (and Library’s) Lean Story… Abridged
 
Call Girls In Sikandarpur Gurgaon ❤️8860477959_Russian 100% Genuine Escorts I...
Call Girls In Sikandarpur Gurgaon ❤️8860477959_Russian 100% Genuine Escorts I...Call Girls In Sikandarpur Gurgaon ❤️8860477959_Russian 100% Genuine Escorts I...
Call Girls In Sikandarpur Gurgaon ❤️8860477959_Russian 100% Genuine Escorts I...
 
Progress Report - Oracle Database Analyst Summit
Progress  Report - Oracle Database Analyst SummitProgress  Report - Oracle Database Analyst Summit
Progress Report - Oracle Database Analyst Summit
 
BEST Call Girls In Greater Noida ✨ 9773824855 ✨ Escorts Service In Delhi Ncr,
BEST Call Girls In Greater Noida ✨ 9773824855 ✨ Escorts Service In Delhi Ncr,BEST Call Girls In Greater Noida ✨ 9773824855 ✨ Escorts Service In Delhi Ncr,
BEST Call Girls In Greater Noida ✨ 9773824855 ✨ Escorts Service In Delhi Ncr,
 
Regression analysis: Simple Linear Regression Multiple Linear Regression
Regression analysis:  Simple Linear Regression Multiple Linear RegressionRegression analysis:  Simple Linear Regression Multiple Linear Regression
Regression analysis: Simple Linear Regression Multiple Linear Regression
 
Grateful 7 speech thanking everyone that has helped.pdf
Grateful 7 speech thanking everyone that has helped.pdfGrateful 7 speech thanking everyone that has helped.pdf
Grateful 7 speech thanking everyone that has helped.pdf
 
/:Call Girls In Jaypee Siddharth - 5 Star Hotel New Delhi ➥9990211544 Top Esc...
/:Call Girls In Jaypee Siddharth - 5 Star Hotel New Delhi ➥9990211544 Top Esc.../:Call Girls In Jaypee Siddharth - 5 Star Hotel New Delhi ➥9990211544 Top Esc...
/:Call Girls In Jaypee Siddharth - 5 Star Hotel New Delhi ➥9990211544 Top Esc...
 
Cash Payment 9602870969 Escort Service in Udaipur Call Girls
Cash Payment 9602870969 Escort Service in Udaipur Call GirlsCash Payment 9602870969 Escort Service in Udaipur Call Girls
Cash Payment 9602870969 Escort Service in Udaipur Call Girls
 
Banana Powder Manufacturing Plant Project Report 2024 Edition.pptx
Banana Powder Manufacturing Plant Project Report 2024 Edition.pptxBanana Powder Manufacturing Plant Project Report 2024 Edition.pptx
Banana Powder Manufacturing Plant Project Report 2024 Edition.pptx
 
Call Girls Navi Mumbai Just Call 9907093804 Top Class Call Girl Service Avail...
Call Girls Navi Mumbai Just Call 9907093804 Top Class Call Girl Service Avail...Call Girls Navi Mumbai Just Call 9907093804 Top Class Call Girl Service Avail...
Call Girls Navi Mumbai Just Call 9907093804 Top Class Call Girl Service Avail...
 
2024 Numerator Consumer Study of Cannabis Usage
2024 Numerator Consumer Study of Cannabis Usage2024 Numerator Consumer Study of Cannabis Usage
2024 Numerator Consumer Study of Cannabis Usage
 
GD Birla and his contribution in management
GD Birla and his contribution in managementGD Birla and his contribution in management
GD Birla and his contribution in management
 
0183760ssssssssssssssssssssssssssss00101011 (27).pdf
0183760ssssssssssssssssssssssssssss00101011 (27).pdf0183760ssssssssssssssssssssssssssss00101011 (27).pdf
0183760ssssssssssssssssssssssssssss00101011 (27).pdf
 
KestrelPro Flyer Japan IT Week 2024 (English)
KestrelPro Flyer Japan IT Week 2024 (English)KestrelPro Flyer Japan IT Week 2024 (English)
KestrelPro Flyer Japan IT Week 2024 (English)
 
BEST Call Girls In Old Faridabad ✨ 9773824855 ✨ Escorts Service In Delhi Ncr,
BEST Call Girls In Old Faridabad ✨ 9773824855 ✨ Escorts Service In Delhi Ncr,BEST Call Girls In Old Faridabad ✨ 9773824855 ✨ Escorts Service In Delhi Ncr,
BEST Call Girls In Old Faridabad ✨ 9773824855 ✨ Escorts Service In Delhi Ncr,
 
RE Capital's Visionary Leadership under Newman Leech
RE Capital's Visionary Leadership under Newman LeechRE Capital's Visionary Leadership under Newman Leech
RE Capital's Visionary Leadership under Newman Leech
 
Call Girls in Gomti Nagar - 7388211116 - With room Service
Call Girls in Gomti Nagar - 7388211116  - With room ServiceCall Girls in Gomti Nagar - 7388211116  - With room Service
Call Girls in Gomti Nagar - 7388211116 - With room Service
 

Aranca views - Consumer Staples − Losing Steam?

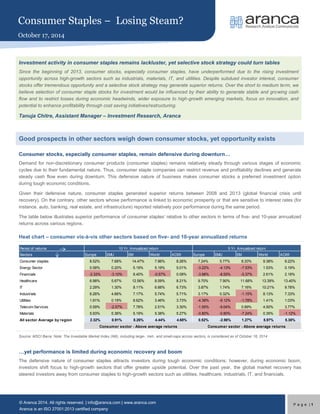
  • 1. EMs Consumer Staples − Losing Steam? October 17, 2014 © Aranca 2014. All rights reserved. | info@aranca.com | www.aranca.com Aranca is an ISO 27001:2013 certified company Page | 1 Investment activity in consumer staples remains lackluster, yet selective stock strategy could turn tables Since the beginning of 2013, consumer stocks, especially consumer staples, have underperformed due to the rising investment opportunity across high-growth sectors such as industrials, materials, IT, and utilities. Despite subdued investor interest, consumer stocks offer tremendous opportunity and a selective stock strategy may generate superior returns. Over the short to medium term, we believe selection of consumer staple stocks for investment would be influenced by their ability to generate stable and growing cash flow and to restrict losses during economic headwinds, wider exposure to high-growth emerging markets, focus on innovation, and potential to enhance profitability through cost saving initiatives/restructuring. Tanuja Chitre, Assistant Manager – Investment Research, Aranca Good prospects in other sectors weigh down consumer stocks, yet opportunity exists Consumer stocks, especially consumer staples, remain defensive during downturn… Demand for non-discretionary consumer products (consumer staples) remains relatively steady through various stages of economic cycles due to their fundamental nature. Thus, consumer staple companies can restrict revenue and profitability declines and generate steady cash flow even during downturn. This defensive nature of business makes consumer stocks a preferred investment option during tough economic conditions. Given their defensive nature, consumer staples generated superior returns between 2008 and 2013 (global financial crisis until recovery). On the contrary, other sectors whose performance is linked to economic prosperity or that are sensitive to interest rates (for instance, auto, banking, real estate, and infrastructure) reported relatively poor performance during the same period. The table below illustrates superior performance of consumer staples’ relative to other sectors in terms of five- and 10-year annualized returns across various regions. Heat chart – consumer vis-à-vis other sectors based on five- and 10-year annualized returns Source: MSCI Barra; Note: The Investable Market Index (IMI), including large-, mid-, and small-caps across sectors, is considered as of October 16, 2014 …yet performance is limited during economic recovery and boom The defensive nature of consumer staples attracts investors during tough economic conditions; however, during economic boom, investors shift focus to high-growth sectors that offer greater upside potential. Over the past year, the global market recovery has steered investors away from consumer staples to high-growth sectors such as utilities, healthcare, industrials, IT, and financials. Period of returnsSectorsEuropeEMUEMWorldACWIEuropeEMUEMWorldACWIConsumer staples8.52%7.68%14.47%7.96%8.26%7.24%5.77%8.20%9.38%9.22% Energy Sector0.58%0.20%5.19%5.19%5.01%-3.22%-4.13%-7.53%1.53%0.19% Financials-2.33%-3.10%8.40%-0.57%0.08%-3.98%-8.55%-0.37%2.61%2.18% Healthcare6.98%5.67%12.56%8.09%8.21%9.70%7.90%11.68%13.39%13.40% IT2.29%1.30%8.11%6.66%6.73%3.87%1.74%7.16%10.21%9.78% Industrials6.26%4.66%7.17%5.74%5.71%3.17%0.32%-1.15%8.13%7.33% Utilities1.91%0.19%8.62%3.46%3.73%-4.38%-9.12%-1.78%1.41%1.03% Telecom Services0.59%-2.57%7.78%2.51%3.30%-1.55%-9.04%0.89%4.50%3.77% Materials5.93%5.36%5.19%5.38%5.27%-0.80%-0.80%-7.24%0.35%-1.12% All sector Average by region2.32%0.91%8.26%4.44%4.68%0.52%-2.98%1.27%5.97%5.38% 10 Yr. Annualized return5 Yr. Annualized returnConsumer sector - Above average returnsConsumer sector - Above average returns
  • 2. EMs Consumer Staples − Losing Steam? October 17, 2014 © Aranca 2014. All rights reserved. | info@aranca.com | www.aranca.com Aranca is an ISO 27001:2013 certified company P a g e | 2 Global markets recovering since 2013 Source: Bloomberg Performance of consumer sector varies across phases of economic cycle The chart below shows investment preference for consumer staples across different stages of the economic cycle. Sector performance along business cycle (2000–14) Positive Negative Nearly neutral Source: Bloomberg Where do we stand? During tough economic conditions consumer staples attracted atttntion due to their ability to generate steady cash flow and limit declines in revenue and profitability. However, with gradual recovery in global financial markets, investors are moving toward sectors highly linked with economic expansion, such as materials, utilities, and technology. These sectors have been performing well, led by recovery in transportation, infrastructure, and construction and greater focus on innovation. The charts below compare the performance of the S&P consumer staple index with other sectoral indices for different periods between 2008 and 2014. 60 80 100 120 140 160 180 Jan-13 Aug-13 Mar-14 Oct-14 DJI FTSE NKY Sensex CRTX Bovespa SHCOMP Investors prefer high-growth stocks over consumer staples Investors prefer high-growth stocks over consumer staples Toward the late phase, investors start moving back to consumer stocks Investors primarily prefer defensive consumer staples over other sectors 2000-04 2005-07 2008-12 2013 to date
  • 3. EMs Consumer Staples − Losing Steam? October 17, 2014 © Aranca 2014. All rights reserved. | info@aranca.com | www.aranca.com Aranca is an ISO 27001:2013 certified company P a g e | 3 S&P indices: Consumer staples vs. others (2008–12) − Crisis S&P indices: Consumer staples vs. others (2013) − Stability S&P indices: Consumer staples vs. others (2014–YTD**) − Recovery Source: Bloomberg; Note1: *Cons. Stapl. = Consumer staples, IT = Infornation Technology; **YTD refers to period between January 2014 and 22 September 2014 Between 2008 and 2012, the global economy continued to grapple with the aftermath of the financial crisis of 2008. Hence, returns from the defensive consumer staples sector surpassed all other sectors (as reflected in LHS chart above). In terms of P/E, consumers stocks have mostly traded at a higher multiple than that of the broader market across business cycles given their defensive nature, except 2008 and 2009, as shown in the chart below: Index P/E performance: S&P 500 index vs. S&P consumer staples index (2000–14) Source: Bloomberg During 2008–09, consumer staples witnessed lower P/E levels. This could be due to the delayed impact of the economic crisis on emerging economies that enjoyed huge exposure to growth sectors other than consumer staples. However, as all markets tackled the consequences of the crisis between 2010 and 2012, consumer staples’s P/E started inching higher than that of the broader market, reflecting investor willingness to pay a higher price for consumer stocks during economic downturn. With global economic recovery, S&P consumer staples index underperformed the broader S&P 500 index. For the twelve months ended September, 2014, the S&P 500 index gained 17.3%, while the consumer staples index returned 13.4%. However, with uncertainty in global economic recovery looming large, since the beginning of October 2014, the fall in consumer sector has been limited relative to the broader index. Over the first fifteen days of October 2015, S&P 500 index contracted 4.3% while consumer staples index contracted just about 0.9%. -64.6% -16.3% -11.2% -9.4% -2.4% -2.2% 3.4% 13.5% 18.4% 25.0% -80% -40% 0% 40% Financials Telecom S&P 500 Industrials Utilities Materials Healthcare IT** Energy Cons.stapl.* 26.3% 12.5% 13.3% 12.6% -2.8% 12.3% 15.5% 16.9% 2.1% 7.7% -40% 0% 40% Financials Telecom S&P 500 Industrials Utilities Materials Healthcare IT** Energy Cons.stapl.* 8.6% 4.3% 9.0% 4.2% 12.2% 9.5% 16.8% 15.0% 6.0% 5.8% 0% 40% Financials Telecom S&P 500 Industrials Utilities Materials Healthcare IT** Energy Cons.stapl.* 20.46 18.41 16.9 16.61 17.36 16.32 18.44 15.11 12.91 14.1 17.31 17.95 16.60 20.65 19.66 18.77 20.31 19.53 13.74 14.86 15.64 16.03 16.27 18.46 18.93 18.59 0 5 10 15 20 25 2003 2004 2005 2006 2007 2008 2009 2010 2011 2012 2013 Current 2014E S&P 500 Consumer Staples
  • 4. EMs Consumer Staples − Losing Steam? October 17, 2014 © Aranca 2014. All rights reserved. | info@aranca.com | www.aranca.com Aranca is an ISO 27001:2013 certified company Page | 4 S&P 500 index vs. S&P consumer staples index Source: Bloomberg; Note: The index values are rebased to 100 We believe, during boom times consumer staples offer tremendous opportunity and a selective investment strategy may generate higher returns than other growth sectors. For instance, tobacco players are focusing on product innovation. These companies generally attract investor attention due to their ability to generate stable cash flow and provide consistent dividend payments and stock buybacks. However, some tobacco players are seen foraying into e-cigarettes, which reflects additional upside potential through innovation. These stocks could demonstrate superior performance and command premium over other incumbents. Apart from tobacco, consumer staple companies with strong focus on product/services/supply chain innovation, cost savings, and restructuring would continue to trade at a premium. Consumer staples: Where is the opportunity? With saturation in developed markets, emerging economies remain key driver… Consumer staple companies in developed markets continue to face growth pressure due to overall saturation. Near-stagnant disposable income, market maturity, and fierce competition adversely impacted performance. Additionally, depreciation of emerging market currencies against the USD hampered sales growth for companies operating outside the US. That said, long-term opportunities across emerging markets are attractive. Rising population, increasing disposable income due to growing ranks of the middle-class population, and rapid urbanization across emerging economies (including India, China, Latin America, and Africa) are expected to support growth in consumer staples. Despite higher growth opportunities relative to developed economies, emerging markets remain a high volume, low margin proposition. Although margins underperform those in developed market (due to infrastructure bottlenecks and higher cost of distribution networks), significantly higher volume growth would ensure profitability. Moreover, as economic expansion in emerging countries continues, gradual improvement in margins would boost profitability. …yet risk and reward evaluation is essential to determine performance Given the tremendous opportunity, all emerging markets would register substantial growth. A country’s ability to scale up infrastructure (with expansion in consumer base) and address geopolitical and regulatory concerns would determine the degree of success. For instance, despite attractive growth opportunities in the consumer sector in India, multinationals continue to face headwinds from FDI regulations. Likewise, in Latin America, high inflationary pressures and inadequate infrastructure limit entry (and growth) of consumer staple multinationals. Accordingly, global consumer stocks with greater exposure to the right set of emerging markets are likely to be preferred by investors. The key growth regions for the consumer sector and main drivers thereof are shown in the table below: 95100105110115120125Aug-13Jan-14May-14Oct-14S&P 500 Index− RebasedConsumer Staples Index− Rebased
  • 5. EMs Consumer Staples − Losing Steam? October 17, 2014 © Aranca 2014. All rights reserved. | info@aranca.com | www.aranca.com Aranca is an ISO 27001:2013 certified company Page | 5 Consumer staples – key growth regions Region Key drivers of consumer staples Asia-Pacific  Higher urbanization rate, changing consumption trends, and expanding middle class  Changing government policy and rising proportion of earning population to support demand in key markets China and India, respectively  91 million urban households in India likely to fall under middle class category by 2030 compared with 22 million in 2010; urbanization rate1 in India estimated to increase to 40% by 2030 from 30% in 2008 (source: 2010 Mckinsey Report – India’s Urban Awakening) Latin America  Growing population, urbanization and per capita income  86% of population is likely to be urbanized by 2050 compared with 80% expected in 2014 (source: UN World Urbanization Prospects – 2014 edition); level of urbanization comparable with developed areas such as Europe and the US Africa  Rising proportion of young and earning population with growing disposable incomes and higher levels of urbanization  Proportion of urban population is likely to increase to 56% by 2050 from 40% expected in 2014 (source: United Nations report on World Urbanization Prospects – 2014 edition) Source: News articles Overall, demand for consumer staples from emerging economies is expected to increase due to an expanding population base and rising per capita income. The chart below highlights the rapid growth markets for consumer staples: Consumer staples − other rapid growth markets across the globe Source: International Monetary Fund (IMF); Note1: GDP growth at constant prices is considered above; Note 2: Size of the bubble indicates population in millions 1 Proportion of urban population to total population ChinaIndiaUSIndonesiaBrazilPakistanNigeriaBangladeshMexicoPhilippinesEthiopiaVietnamEgyptIranGermanyTurkeyMyanmarThailandUKFranceItalySouth Africa0.0% 1.0% 2.0% 3.0% 4.0% 5.0% 6.0% 7.0% 8.0% 9.0% 10.0% 0.0%0.5%1.0%1.5%2.0%2.5%3.0% GDP growth Population growthHighlighted section representmarkets with Population growth close to 1% or above 1% GDP growth above 3%
  • 6. EMs Consumer Staples − Losing Steam? October 17, 2014 © Aranca 2014. All rights reserved. | info@aranca.com | www.aranca.com Aranca is an ISO 27001:2013 certified company Page | 6 Other drivers of consumer staples Health and wellness at the fore The global population is becoming increasingly health conscious due to the rising incidence of lifestyle-related cardiovascular diseases and obesity. Hence, more companies are focusing on expanding portfolio to include nutritious products. The table below illustrates consumer staple companies’s shifting focus toward health-based products: Consumer staple companies shifting focus to health conscious products Staple segment Companies Efforts Beverages Pepsi Co, Coca-Cola Focus on including non-carbonated drinks such as sports drinks and fruit juices Snacks Pepsi Focus on baked chips over fried chips Tobacco Lorillard, British American Tobacco, Altria Group Introduction of e-cigarettes that are supposed to be less risky than traditional cigarettes Source: News articles Cost reduction remains key to profitability With limited scope for margin expansion through price increases, consumer staple companies across the globe are focusing on cost reduction. Cost-cutting measures such as divestiture of low-margin brands, factory rationalization, centralized distribution, and vertical integration mitigate the adverse impact of inflation in commodity and other input costs. High commodity and input costs remain the primary cause of margin dilution in the consumer staples sector. Some recent examples of cost reduction and restructuring initiatives by consumer staple companies are tabulated below: Consumer staple companies focus on cost reduction to improve performance Staple segment Companies Initiatives and their impact Essentials Unilever Between 2012 and 2013, Unilever sold its slow growing North American frozen meal, Wish-Bone salad dressing and Skippy peanut butter businesses to to ConAgra Foods Inc. This step falls in line with Unilevers’ strategy to reduce the size of its brand portfolio from 1,600 (as of 2013) to 400 by 2015 to be able to focus available resources on core categories like personal care and home care. Hot beverage: Coffee Green Mountain Coffee Roasters Inc. Green Mountain Coffee Roasters Inc. is focusing on improving efficiency through cost reduction. By 2015, the company targets to save USD70–100 million by improving operational productivity. Snacks & Beverages Pepsi Co. Pepsi Co. announced a five-year annual productivity plan for 2013–19. In 2013, the company achieved productivity-related cost savings of USD 2billion. By 2019, Pepsi aims to save USD1 billion each year through improved productivity. Beverages Coca-Cola In 2012, Coca-Cola launched a four-year productivity improvement program. Under this, Coca-Cola aims to improve supply chain, marketing and innovation efforts; standardize information systems; and integrate its bottling and distribution operations acquired from Coca-Cola Enterprises, North America. These activities are expected to generate incremental earnings of USD550–600 million by 2015. Source: News articles
  • 7. EMs Consumer Staples − Losing Steam? October 17, 2014 © Aranca 2014. All rights reserved. | info@aranca.com | www.aranca.com Aranca is an ISO 27001:2013 certified company P a g e | 7 Changing consumption trends across emerging markets present new opportunity Rising disposable income and changing lifestyles (urbanization) have boosted demand for packed foods in emerging economies. Unlike mature markets, emerging economies remain relatively untapped, thus offering significant potential in the packaged food and ready-to-eat (RTE) segment. While emerging markets primarily offer volume proposition, demand for packaged/RTE food is steadily giving way to an evolving high-margin trend. In this category, emerging countries could soon present margin-enhancing opportunity for multinational consumer staple companies. Americas and Asia-Pacific remain preferred destinations for M&A deals With limited scope for profitability improvement, consumer staple companies are increasingly focusing on strategic partnerships and mergers/acquisitions to generate additional revenues by:  Leveraging scale of operations  Improving distribution/marketing efficiency  Reducing cost through vertical integration across value chain  Capturing additional customer base by expanding in unexplored markets  Introducing new products Broadly, M&A activity in consumer staples is subject to the quality of the target company. The selection depends on the target’s ability to add value in terms of products, geographic dispersion or productivity enhancement. According to the M&A Transaction Tracker by American Appraisal, the consumer staples sector recorded 502 transactions in the twelve months ended June 30, 2014. In terms of value, the transactions accounted for 6% (or USD149.3) of the M&A deals during the same period. Geographically, 90% of the deals (in value terms) were carried out in North America & Canada (35%), Europe (32%), and Asia-Pacific (23%). Consumer staples – deal value by geography Region-wise EBITDA multiples for consumer staples Source: American Appraisal M&A Transaction Tracker, released in Q2-2014; Note: The deal value is for 12 months ended June 30, 2014 Source: American Appraisal M&A Transaction Tracker, released in Q2-2014; Note: The revenue and EBITDA multiples by region are for 12 months ended June 30, 2014; Median EBITDA multiples are provided above Product innovation may sustain market position/profitability Apart from M&A and strategic partnerships, consumer staple companies are focusing on product innovation to bolster revenue and profitability. Through innovation, companies aim to offer differentiated products, thereby maintaining (and improving) their competitive market positioning. For instance, Pepsi Co’s new soda dispenser, ‘Spire’, allows customers to create up to 1000 different soda drinks. This dispenser was primarily launched to improve competitive positioning vis-à-vis Coca-Cola that has been operating ‘Freestyle’ Africa/Middle East Asia-Pacific Europe Latin America and Caribbean US and Canada 11.2 10 8.9 10.7 10.9 10.2 0 2 4 6 8 10 12 US& Canada LatAm & Caribbean Europe Asia-Pacific Africa/Middle East Total
  • 8. EMs Consumer Staples − Losing Steam? October 17, 2014 © Aranca 2014. All rights reserved. | info@aranca.com | www.aranca.com Aranca is an ISO 27001:2013 certified company Page | 8 fountain machines since 2009. Similarly, Kimberly Clark plans to offer various innovative products across the baby diapers and wipes categories in North America. The way forward Since 2012, the consumer staples segment has been facing macroeconomic headwinds and the situation is unlikely to change over the short term. In 2014, the trading environment is expected to remain tough due to continued cautious spending in both developed and emerging markets consumer. Additionally, political unrest in certain countries has adversely impacted operations of multinational consumer companies. Despite the tough environment, consumer staple companies that focus on value addition through strategic partnerships/tie-ups, product innovation, and cost-savings initiatives stand a better chance to bolster profitability over the short to medium term.
  • 9. EMs Consumer Staples − Losing Steam? October 17, 2014 © Aranca 2014. All rights reserved. | info@aranca.com | www.aranca.com Aranca is an ISO 27001:2013 certified company Page | 9 ARANCA DISCLAIMER This report is published by Aranca, Inc. Aranca is a customized research and analytics services provider to global clients. The information contained in this document is confidential and is solely for use of those persons to whom it is addressed and may not be reproduced, further distributed to any other person or published, in whole or in part, for any purpose. This document is based on data sources that are publicly available and are thought to be reliable. Aranca may not have verified all of this information with third parties. Neither Aranca nor its advisors, directors or employees can guarantee the accuracy, reasonableness or completeness of the information received from any sources consulted for this publication, and neither Aranca nor its advisors, directors or employees accepts any liability whatsoever (in negligence or otherwise) for any loss howsoever arising from any use of this document or its contents or otherwise arising in connection with this document. Further, this document is not an offer to buy or sell any security, commodity or currency. This document does not provide individually tailored investment advice. It has been prepared without regard to the individual financial circumstances and objectives of persons who receive it. The appropriateness of a particular investment or currency will depend on an investor’s individual circumstances and objectives. The investments referred to in this document may not be suitable for all investors. This document is not to be relied upon and should not be used in substitution for the exercise of independent judgment. This document may contain certain statements, estimates, and projections with respect to the anticipated future performance of securities, commodities or currencies suggested. Such statements, estimates, and projections are based on information that we consider reliable and may reflect various assumptions made concerning anticipated economic developments, which have not been independently verified and may or may not prove correct. No representation or warranty is made as to the accuracy of such statements, estimates, and projections or as to its fitness for the purpose intended and it should not be relied upon as such. Opinions expressed are our current opinions as of the date appearing on this material only and may change without notice. © 2014, Aranca. All rights reserved.