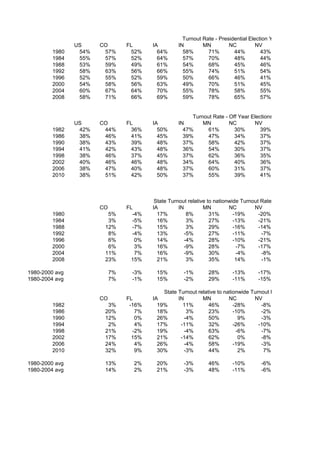
SlideShare a Scribd company logo
1 of 2
Turnout Rate - Presidential Election Years
                US     CO        FL      IA        IN        MN         NC          NV
        1980     54%    57%       52%      64%       58%       71%        44%         43%
        1984     55%    57%       52%      64%       57%       70%        48%         44%
        1988     53%    59%       49%      61%       54%       68%        45%         46%
        1992     58%    63%       56%      66%       55%       74%        51%         54%
        1996     52%    55%       52%      59%       50%       66%        46%         41%
        2000     54%    58%       56%      63%       49%       70%        51%         45%
        2004     60%    67%       64%      70%       55%       78%        58%         55%
        2008     58%    71%       66%      69%       59%       78%        65%         57%


                                                        Turnout Rate - Off Year Elections
                US     CO        FL      IA        IN       MN         NC        NV
        1982     42%    44%       36%      50%       47%      61%        30%        39%
        1986     38%    46%       41%      45%       39%      47%        34%        37%
        1990     38%    43%       39%      48%       37%      58%        42%        37%
        1994     41%    42%       43%      48%       36%      54%        30%        37%
        1998     38%    46%       37%      45%       37%      62%        36%        35%
        2002     40%    46%       46%      48%       34%      64%        40%        36%
        2006     38%    47%       40%      48%       37%      60%        31%        37%
        2010     38%    51%       42%      50%       37%      55%        39%        41%


                                          State Turnout relative to nationwide Turnout Rate Presidential Election
                       CO        FL      IA         IN         MN         NC        NV
        1980             5%        -4%     17%          8%        31%       -19%      -20%
        1984             3%        -5%     16%          3%        27%       -13%      -21%
        1988            12%        -7%     15%          3%        29%       -16%      -14%
        1992             8%        -4%     13%         -5%        27%       -11%       -7%
        1996             6%         0%     14%         -4%        28%       -10%      -21%
        2000             6%         3%     16%         -9%        28%        -7%      -17%
        2004            11%         7%     16%         -9%        30%        -4%       -8%
        2008            23%       15%      21%          3%        35%        14%       -1%

1980-2000 avg               7%    -3%     15%         -1%       28%       -13%       -17%
1980-2004 avg               7%    -1%     15%         -2%       29%       -11%       -15%

                                             State Turnout relative to nationwide Turnout Rate Off Year Electio
                       CO        FL      IA        IN        MN          NC        NV
        1982             3%       -16%     19%       11%        46%        -28%       -8%
        1986            20%         7%     18%         3%       23%        -10%       -2%
        1990            12%         0%     26%        -4%       50%          9%       -3%
        1994             2%         4%     17%      -11%        32%        -26%      -10%
        1998            21%        -2%     19%        -4%       63%         -6%       -7%
        2002            17%        15%     21%      -14%        62%          0%       -8%
        2006            24%         4%     26%        -4%       58%        -19%       -3%
        2010            32%         9%     30%        -3%       44%          2%        7%

1980-2000 avg           13%        2%     20%         -3%       46%       -10%         -6%
1980-2004 avg           14%        2%     21%         -3%       48%       -11%         -6%
al Election Years
                OH       PA          TN       VA      WI
                  56%     53%         49%      49%     68%
                  59%     55%         50%      52%     65%
                  56%     51%         46%      50%     63%
                  61%     55%         53%      55%     70%
                  55%     50%         48%      50%     58%
                  57%     54%         50%      54%     68%
                  67%     63%         56%      61%     75%
                  67%     64%         57%      67%     72%


ear Elections
                OH       PA          TN       VA      WI
                 44%      42%         38%      36%     47%
                 40%      38%         35%      29%     44%
                 44%      34%         22%      26%     39%
                 42%      40%         39%      44%     42%
                 41%      33%         24%      23%     46%
                 39%      39%         40%      29%     45%
                 48%      44%         41%      44%     53%
                 45%      42%         35%      39%     52%


urnout Rate Presidential Election Years
               OH         PA         TN       VA      WI
                  3%         -3%        -9%    -10%    26%
                  6%          0%        -9%     -5%    17%
                  6%         -3%      -13%      -6%    19%
                  5%         -5%        -8%     -5%    20%
                  7%         -4%        -8%     -3%    13%
                  5%          0%        -8%      0%    25%
                 11%          4%        -6%      1%    24%
                 16%        10%         -1%     16%    26%

                  5%        -3%        -9%      -5%    20%
                  6%        -2%        -9%      -4%    21%

de Turnout Rate Off Year Elections
              OH         PA          TN       VA      WI
                  5%         0%       -11%     -15%    11%
                  5%         1%        -9%     -24%    17%
                 13%       -11%       -43%     -34%      1%
                  3%        -4%        -6%       6%      3%
                  8%       -13%       -37%     -38%    22%
                 -2%        -2%         0%     -27%    15%
                 25%        16%         9%      16%    40%
                 17%         8%       -10%       1%    35%

                  5%        -5%       -18%     -22%    11%
                  8%        -2%       -14%     -17%    16%

More Related Content

Viewers also liked (7)

MKendall_port
MKendall_portMKendall_port
MKendall_port
 
scan0010
scan0010scan0010
scan0010
 
Font Mood Board
Font Mood BoardFont Mood Board
Font Mood Board
 
Manish-CV
Manish-CVManish-CV
Manish-CV
 
Kit Multimídia
Kit MultimídiaKit Multimídia
Kit Multimídia
 
Diarios de clase .
Diarios de clase . Diarios de clase .
Diarios de clase .
 
廣編稿宜蘭椅設計大賞-跨1
廣編稿宜蘭椅設計大賞-跨1廣編稿宜蘭椅設計大賞-跨1
廣編稿宜蘭椅設計大賞-跨1
 

Similar to Turnout

Cartoon Network India - New Generations Research 2012
Cartoon Network India - New Generations Research 2012Cartoon Network India - New Generations Research 2012
Cartoon Network India - New Generations Research 2012Harsh Wardhan Dave
 
[메조미디어] 2020 가전 업종분석 리포트
[메조미디어] 2020 가전 업종분석 리포트[메조미디어] 2020 가전 업종분석 리포트
[메조미디어] 2020 가전 업종분석 리포트MezzoMedia
 
Global Views on Immigration and the Refugee Crisis
Global Views on Immigration and the Refugee CrisisGlobal Views on Immigration and the Refugee Crisis
Global Views on Immigration and the Refugee CrisisIpsos
 
[대학내일20대연구소] 2017 20대 소비&라이프스타일 트렌드 조사 (연구리포트 2017-09)
[대학내일20대연구소] 2017 20대 소비&라이프스타일 트렌드 조사 (연구리포트 2017-09)[대학내일20대연구소] 2017 20대 소비&라이프스타일 트렌드 조사 (연구리포트 2017-09)
[대학내일20대연구소] 2017 20대 소비&라이프스타일 트렌드 조사 (연구리포트 2017-09)20slab(대학내일20대연구소)
 
Analisis Horta Guinardo 2008 03 10
Analisis Horta Guinardo 2008 03 10Analisis Horta Guinardo 2008 03 10
Analisis Horta Guinardo 2008 03 101977bcn
 
Univision Poll Results
Univision Poll Results Univision Poll Results
Univision Poll Results univisionnews
 
2012 october 3 survey of tunisian public opinion, july 26 august 8, 2012
2012 october 3 survey of tunisian public opinion, july 26 august 8, 20122012 october 3 survey of tunisian public opinion, july 26 august 8, 2012
2012 october 3 survey of tunisian public opinion, july 26 august 8, 2012Moez
 
Diagnosing And Solving Membership Marketing Challenges - Tony Rossell-mgi
Diagnosing And Solving Membership Marketing Challenges - Tony Rossell-mgiDiagnosing And Solving Membership Marketing Challenges - Tony Rossell-mgi
Diagnosing And Solving Membership Marketing Challenges - Tony Rossell-mgiMarketing General Incorporated (MGI)
 
Naiic sankou(参考資料)
Naiic sankou(参考資料)Naiic sankou(参考資料)
Naiic sankou(参考資料)naiic
 
Naiic sankou(参考資料)
Naiic sankou(参考資料)Naiic sankou(参考資料)
Naiic sankou(参考資料)jikocho
 

Similar to Turnout (20)

Towns Race
Towns RaceTowns Race
Towns Race
 
Hawaii Towns Travel Time
Hawaii Towns Travel TimeHawaii Towns Travel Time
Hawaii Towns Travel Time
 
Hawaii Towns Departure Time
Hawaii Towns Departure TimeHawaii Towns Departure Time
Hawaii Towns Departure Time
 
Cartoon Network India - New Generations Research 2012
Cartoon Network India - New Generations Research 2012Cartoon Network India - New Generations Research 2012
Cartoon Network India - New Generations Research 2012
 
Ergonomia
ErgonomiaErgonomia
Ergonomia
 
Asignatura
AsignaturaAsignatura
Asignatura
 
Asignatura
AsignaturaAsignatura
Asignatura
 
[메조미디어] 2020 가전 업종분석 리포트
[메조미디어] 2020 가전 업종분석 리포트[메조미디어] 2020 가전 업종분석 리포트
[메조미디어] 2020 가전 업종분석 리포트
 
Global Views on Immigration and the Refugee Crisis
Global Views on Immigration and the Refugee CrisisGlobal Views on Immigration and the Refugee Crisis
Global Views on Immigration and the Refugee Crisis
 
Hawaii Towns Transportation
Hawaii Towns TransportationHawaii Towns Transportation
Hawaii Towns Transportation
 
[대학내일20대연구소] 2017 20대 소비&라이프스타일 트렌드 조사 (연구리포트 2017-09)
[대학내일20대연구소] 2017 20대 소비&라이프스타일 트렌드 조사 (연구리포트 2017-09)[대학내일20대연구소] 2017 20대 소비&라이프스타일 트렌드 조사 (연구리포트 2017-09)
[대학내일20대연구소] 2017 20대 소비&라이프스타일 트렌드 조사 (연구리포트 2017-09)
 
Analisis Horta Guinardo 2008 03 10
Analisis Horta Guinardo 2008 03 10Analisis Horta Guinardo 2008 03 10
Analisis Horta Guinardo 2008 03 10
 
Hawaii Towns — Place of Birth
Hawaii Towns — Place of BirthHawaii Towns — Place of Birth
Hawaii Towns — Place of Birth
 
Consumer report
Consumer reportConsumer report
Consumer report
 
Univision Poll Results
Univision Poll Results Univision Poll Results
Univision Poll Results
 
2012 october 3 survey of tunisian public opinion, july 26 august 8, 2012
2012 october 3 survey of tunisian public opinion, july 26 august 8, 20122012 october 3 survey of tunisian public opinion, july 26 august 8, 2012
2012 october 3 survey of tunisian public opinion, july 26 august 8, 2012
 
Diagnosing And Solving Membership Marketing Challenges - Tony Rossell-mgi
Diagnosing And Solving Membership Marketing Challenges - Tony Rossell-mgiDiagnosing And Solving Membership Marketing Challenges - Tony Rossell-mgi
Diagnosing And Solving Membership Marketing Challenges - Tony Rossell-mgi
 
Cob 20080715 1
Cob 20080715 1Cob 20080715 1
Cob 20080715 1
 
Naiic sankou(参考資料)
Naiic sankou(参考資料)Naiic sankou(参考資料)
Naiic sankou(参考資料)
 
Naiic sankou(参考資料)
Naiic sankou(参考資料)Naiic sankou(参考資料)
Naiic sankou(参考資料)
 

Recently uploaded

Manipur-Book-Final-2-compressed.pdfsal'rpk
Manipur-Book-Final-2-compressed.pdfsal'rpkManipur-Book-Final-2-compressed.pdfsal'rpk
Manipur-Book-Final-2-compressed.pdfsal'rpkbhavenpr
 
complaint-ECI-PM-media-1-Chandru.pdfra;;prfk
complaint-ECI-PM-media-1-Chandru.pdfra;;prfkcomplaint-ECI-PM-media-1-Chandru.pdfra;;prfk
complaint-ECI-PM-media-1-Chandru.pdfra;;prfkbhavenpr
 
Referendum Party 2024 Election Manifesto
Referendum Party 2024 Election ManifestoReferendum Party 2024 Election Manifesto
Referendum Party 2024 Election ManifestoSABC News
 
Global Terrorism and its types and prevention ppt.
Global Terrorism and its types and prevention ppt.Global Terrorism and its types and prevention ppt.
Global Terrorism and its types and prevention ppt.NaveedKhaskheli1
 
HARNESSING AI FOR ENHANCED MEDIA ANALYSIS A CASE STUDY ON CHATGPT AT DRONE EM...
HARNESSING AI FOR ENHANCED MEDIA ANALYSIS A CASE STUDY ON CHATGPT AT DRONE EM...HARNESSING AI FOR ENHANCED MEDIA ANALYSIS A CASE STUDY ON CHATGPT AT DRONE EM...
HARNESSING AI FOR ENHANCED MEDIA ANALYSIS A CASE STUDY ON CHATGPT AT DRONE EM...Ismail Fahmi
 
Dynamics of Destructive Polarisation in Mainstream and Social Media: The Case...
Dynamics of Destructive Polarisation in Mainstream and Social Media: The Case...Dynamics of Destructive Polarisation in Mainstream and Social Media: The Case...
Dynamics of Destructive Polarisation in Mainstream and Social Media: The Case...Axel Bruns
 
Brief biography of Julius Robert Oppenheimer
Brief biography of Julius Robert OppenheimerBrief biography of Julius Robert Oppenheimer
Brief biography of Julius Robert OppenheimerOmarCabrera39
 
AP Election Survey 2024: TDP-Janasena-BJP Alliance Set To Sweep Victory
AP Election Survey 2024: TDP-Janasena-BJP Alliance Set To Sweep VictoryAP Election Survey 2024: TDP-Janasena-BJP Alliance Set To Sweep Victory
AP Election Survey 2024: TDP-Janasena-BJP Alliance Set To Sweep Victoryanjanibaddipudi1
 
Opportunities, challenges, and power of media and information
Opportunities, challenges, and power of media and informationOpportunities, challenges, and power of media and information
Opportunities, challenges, and power of media and informationReyMonsales
 
Chandrayaan 3 Successful Moon Landing Mission.pdf
Chandrayaan 3 Successful Moon Landing Mission.pdfChandrayaan 3 Successful Moon Landing Mission.pdf
Chandrayaan 3 Successful Moon Landing Mission.pdfauroraaudrey4826
 
N Chandrababu Naidu Launches 'Praja Galam' As Part of TDP’s Election Campaign
N Chandrababu Naidu Launches 'Praja Galam' As Part of TDP’s Election CampaignN Chandrababu Naidu Launches 'Praja Galam' As Part of TDP’s Election Campaign
N Chandrababu Naidu Launches 'Praja Galam' As Part of TDP’s Election Campaignanjanibaddipudi1
 
VIP Girls Available Call or WhatsApp 9711199012
VIP Girls Available Call or WhatsApp 9711199012VIP Girls Available Call or WhatsApp 9711199012
VIP Girls Available Call or WhatsApp 9711199012ankitnayak356677
 
Quiz for Heritage Indian including all the rounds
Quiz for Heritage Indian including all the roundsQuiz for Heritage Indian including all the rounds
Quiz for Heritage Indian including all the roundsnaxymaxyy
 
Top 10 Wealthiest People In The World.pdf
Top 10 Wealthiest People In The World.pdfTop 10 Wealthiest People In The World.pdf
Top 10 Wealthiest People In The World.pdfauroraaudrey4826
 
57 Bidens Annihilation Nation Policy.pdf
57 Bidens Annihilation Nation Policy.pdf57 Bidens Annihilation Nation Policy.pdf
57 Bidens Annihilation Nation Policy.pdfGerald Furnkranz
 

Recently uploaded (15)

Manipur-Book-Final-2-compressed.pdfsal'rpk
Manipur-Book-Final-2-compressed.pdfsal'rpkManipur-Book-Final-2-compressed.pdfsal'rpk
Manipur-Book-Final-2-compressed.pdfsal'rpk
 
complaint-ECI-PM-media-1-Chandru.pdfra;;prfk
complaint-ECI-PM-media-1-Chandru.pdfra;;prfkcomplaint-ECI-PM-media-1-Chandru.pdfra;;prfk
complaint-ECI-PM-media-1-Chandru.pdfra;;prfk
 
Referendum Party 2024 Election Manifesto
Referendum Party 2024 Election ManifestoReferendum Party 2024 Election Manifesto
Referendum Party 2024 Election Manifesto
 
Global Terrorism and its types and prevention ppt.
Global Terrorism and its types and prevention ppt.Global Terrorism and its types and prevention ppt.
Global Terrorism and its types and prevention ppt.
 
HARNESSING AI FOR ENHANCED MEDIA ANALYSIS A CASE STUDY ON CHATGPT AT DRONE EM...
HARNESSING AI FOR ENHANCED MEDIA ANALYSIS A CASE STUDY ON CHATGPT AT DRONE EM...HARNESSING AI FOR ENHANCED MEDIA ANALYSIS A CASE STUDY ON CHATGPT AT DRONE EM...
HARNESSING AI FOR ENHANCED MEDIA ANALYSIS A CASE STUDY ON CHATGPT AT DRONE EM...
 
Dynamics of Destructive Polarisation in Mainstream and Social Media: The Case...
Dynamics of Destructive Polarisation in Mainstream and Social Media: The Case...Dynamics of Destructive Polarisation in Mainstream and Social Media: The Case...
Dynamics of Destructive Polarisation in Mainstream and Social Media: The Case...
 
Brief biography of Julius Robert Oppenheimer
Brief biography of Julius Robert OppenheimerBrief biography of Julius Robert Oppenheimer
Brief biography of Julius Robert Oppenheimer
 
AP Election Survey 2024: TDP-Janasena-BJP Alliance Set To Sweep Victory
AP Election Survey 2024: TDP-Janasena-BJP Alliance Set To Sweep VictoryAP Election Survey 2024: TDP-Janasena-BJP Alliance Set To Sweep Victory
AP Election Survey 2024: TDP-Janasena-BJP Alliance Set To Sweep Victory
 
Opportunities, challenges, and power of media and information
Opportunities, challenges, and power of media and informationOpportunities, challenges, and power of media and information
Opportunities, challenges, and power of media and information
 
Chandrayaan 3 Successful Moon Landing Mission.pdf
Chandrayaan 3 Successful Moon Landing Mission.pdfChandrayaan 3 Successful Moon Landing Mission.pdf
Chandrayaan 3 Successful Moon Landing Mission.pdf
 
N Chandrababu Naidu Launches 'Praja Galam' As Part of TDP’s Election Campaign
N Chandrababu Naidu Launches 'Praja Galam' As Part of TDP’s Election CampaignN Chandrababu Naidu Launches 'Praja Galam' As Part of TDP’s Election Campaign
N Chandrababu Naidu Launches 'Praja Galam' As Part of TDP’s Election Campaign
 
VIP Girls Available Call or WhatsApp 9711199012
VIP Girls Available Call or WhatsApp 9711199012VIP Girls Available Call or WhatsApp 9711199012
VIP Girls Available Call or WhatsApp 9711199012
 
Quiz for Heritage Indian including all the rounds
Quiz for Heritage Indian including all the roundsQuiz for Heritage Indian including all the rounds
Quiz for Heritage Indian including all the rounds
 
Top 10 Wealthiest People In The World.pdf
Top 10 Wealthiest People In The World.pdfTop 10 Wealthiest People In The World.pdf
Top 10 Wealthiest People In The World.pdf
 
57 Bidens Annihilation Nation Policy.pdf
57 Bidens Annihilation Nation Policy.pdf57 Bidens Annihilation Nation Policy.pdf
57 Bidens Annihilation Nation Policy.pdf
 

Turnout

  • 1. Turnout Rate - Presidential Election Years US CO FL IA IN MN NC NV 1980 54% 57% 52% 64% 58% 71% 44% 43% 1984 55% 57% 52% 64% 57% 70% 48% 44% 1988 53% 59% 49% 61% 54% 68% 45% 46% 1992 58% 63% 56% 66% 55% 74% 51% 54% 1996 52% 55% 52% 59% 50% 66% 46% 41% 2000 54% 58% 56% 63% 49% 70% 51% 45% 2004 60% 67% 64% 70% 55% 78% 58% 55% 2008 58% 71% 66% 69% 59% 78% 65% 57% Turnout Rate - Off Year Elections US CO FL IA IN MN NC NV 1982 42% 44% 36% 50% 47% 61% 30% 39% 1986 38% 46% 41% 45% 39% 47% 34% 37% 1990 38% 43% 39% 48% 37% 58% 42% 37% 1994 41% 42% 43% 48% 36% 54% 30% 37% 1998 38% 46% 37% 45% 37% 62% 36% 35% 2002 40% 46% 46% 48% 34% 64% 40% 36% 2006 38% 47% 40% 48% 37% 60% 31% 37% 2010 38% 51% 42% 50% 37% 55% 39% 41% State Turnout relative to nationwide Turnout Rate Presidential Election CO FL IA IN MN NC NV 1980 5% -4% 17% 8% 31% -19% -20% 1984 3% -5% 16% 3% 27% -13% -21% 1988 12% -7% 15% 3% 29% -16% -14% 1992 8% -4% 13% -5% 27% -11% -7% 1996 6% 0% 14% -4% 28% -10% -21% 2000 6% 3% 16% -9% 28% -7% -17% 2004 11% 7% 16% -9% 30% -4% -8% 2008 23% 15% 21% 3% 35% 14% -1% 1980-2000 avg 7% -3% 15% -1% 28% -13% -17% 1980-2004 avg 7% -1% 15% -2% 29% -11% -15% State Turnout relative to nationwide Turnout Rate Off Year Electio CO FL IA IN MN NC NV 1982 3% -16% 19% 11% 46% -28% -8% 1986 20% 7% 18% 3% 23% -10% -2% 1990 12% 0% 26% -4% 50% 9% -3% 1994 2% 4% 17% -11% 32% -26% -10% 1998 21% -2% 19% -4% 63% -6% -7% 2002 17% 15% 21% -14% 62% 0% -8% 2006 24% 4% 26% -4% 58% -19% -3% 2010 32% 9% 30% -3% 44% 2% 7% 1980-2000 avg 13% 2% 20% -3% 46% -10% -6% 1980-2004 avg 14% 2% 21% -3% 48% -11% -6%
  • 2. al Election Years OH PA TN VA WI 56% 53% 49% 49% 68% 59% 55% 50% 52% 65% 56% 51% 46% 50% 63% 61% 55% 53% 55% 70% 55% 50% 48% 50% 58% 57% 54% 50% 54% 68% 67% 63% 56% 61% 75% 67% 64% 57% 67% 72% ear Elections OH PA TN VA WI 44% 42% 38% 36% 47% 40% 38% 35% 29% 44% 44% 34% 22% 26% 39% 42% 40% 39% 44% 42% 41% 33% 24% 23% 46% 39% 39% 40% 29% 45% 48% 44% 41% 44% 53% 45% 42% 35% 39% 52% urnout Rate Presidential Election Years OH PA TN VA WI 3% -3% -9% -10% 26% 6% 0% -9% -5% 17% 6% -3% -13% -6% 19% 5% -5% -8% -5% 20% 7% -4% -8% -3% 13% 5% 0% -8% 0% 25% 11% 4% -6% 1% 24% 16% 10% -1% 16% 26% 5% -3% -9% -5% 20% 6% -2% -9% -4% 21% de Turnout Rate Off Year Elections OH PA TN VA WI 5% 0% -11% -15% 11% 5% 1% -9% -24% 17% 13% -11% -43% -34% 1% 3% -4% -6% 6% 3% 8% -13% -37% -38% 22% -2% -2% 0% -27% 15% 25% 16% 9% 16% 40% 17% 8% -10% 1% 35% 5% -5% -18% -22% 11% 8% -2% -14% -17% 16%