1. Probability Distribution
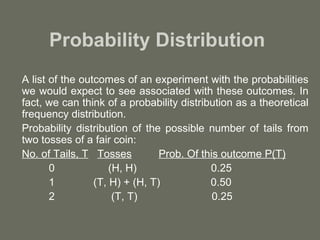
A list of the outcomes of an experiment with the probabilities
we would expect to see associated with these outcomes. In
fact, we can think of a probability distribution as a theoretical
frequency distribution.
Probability distribution of the possible number of tails from
two tosses of a fair coin:
No. of Tails, T Tosses Prob. Of this outcome P(T)
0 (H, H) 0.25
1 (T, H) + (H, T) 0.50
2 (T, T) 0.25
2. Random Variable
• A variable that takes on different values as a
result of the outcomes of a random experiment
• Discrete Random Variable: A random variable
that is allowed to take on only a limited number
of values, which can be listed.
• Continuous Random Variable: A random
variable allowed to take on any value within a
given range.
3. Probability Distribution
• Discrete Probability Distribution: A
probability distribution in which the
variable is allowed to take on only a
limited number of values, which can be
listed.
• Continuous Probability Distribution: A
probability distribution in which the
variable is allowed to take on any value
within a given range.
4. Expected Value
• A weighted average of the outcomes of
an experiment. Expected value of a
random variable is the sum of the
products of each value of the random
variable with that value’s probability of
occurrence.
5. Discrete Probability Distributions
• Binomial Distribution: A discrete
distribution describing the results of an
experiment known as Bernoulli process –
each trial has only two possible outcomes.
• Probability of r successes in n Bernoulli
trials = nCr * pr * q(n – r)
• Measuring of Central Tendency & Dispersion for the
Binomial distribution:
µ = n*p and σ = √(n*p*q)
6. Poisson Probability Distribution
• Describes discrete occurrences over a continuum or
interval
• A discrete distribution
• Describes rare events
• Each occurrence is independent of any other
occurrences.
• The number of occurrences in each interval can vary
from zero to infinity
• The expected number of occurrences must hold constant
throughout the experiment.
7. Poisson Distribution: Applications
• Arrivals at queuing systems
• airports -- people, airplanes, automobiles, baggage
• banks -- people, automobiles, loan applications
• computer file servers -- read and write operations
• Defects in manufactured goods
• number of defects per 1,000 feet of extruded copper wire
• number of blemishes per square foot of painted surface
• number of errors per typed page
8. Poisson Probability Distribution
•It is a discrete probability distribution.
•Calculating Poisson Probabilities:
P(x) = λx. e- λ
x!
Where
P(x) = Probability of exactly x occurrences,
λ = The mean number of occurrences per
interval of time
9. Poisson Probability Distribution
Poisson Distribution as an Approximation of
the Binomial Distribution:
When n is large and p is small, Poisson
distribution can be a reasonable approximation
of the binomial distribution. The rule most often
used by statisticians is that the Poisson is a
good approximation of the binomial when n is
greater than or equal to 20 and p is less than or
equal to 0.05.