SlideShare a Scribd company logo
1 of 186
PSYCHIATRIC SERVICES ♦ March 2002 Vol. 53 No. 3
229933
Virtually every state in the Unit-ed States now uses
managedcare techniques to control be-
havioral health costs for Medicaid re-
cipients. Implementation of these
strategies has proceeded in the ab-
sence of substantial information on
the resulting quality of care and ef-
fectiveness of services (1). Advocates
for persons who have severe mental
illness have raised concerns about the
application of cost-cutting techniques
developed in the private sector for
employed persons with acute illness-
es to persons in Medicaid and other
public-sector programs who have
persistent serious mental illness (2).
We wanted to compare the service
use patterns of Medicaid recipients
with serious mental illness in a full-
risk (capitated) and a no-risk (fee-for-
service) system of care and to deter-
mine whether the type of financial
risk arrangement affected patients’
health status.
Many state Medicaid agencies use
capitation—the prepayment of an es-
tablished fee per person for a defined
benefit over a set period—to keep
their costs predictable and limited. In
some instances a single capitated pay-
ment is made to a managed care or-
ganization (MCO). In these ostensi-
bly integrated plans, behavioral
health care can be provided directly
by MCO providers, by behavioral
health professionals who are paid on a
discounted fee-for-service basis, or
even by a behavioral health MCO or
another agency through a subcon-
tract. In other cases, the state Medic-
aid agency can carve out the behav-
ioral health benefit by making capi-
tated payments directly to a behav-
ioral health MCO.
Managed care programs that use
capitated payments to transfer finan-
cial risk to for-profit entities that are
responsible for the care of vulnerable
populations are of particular concern.
Specifically, the incentives of capita-
tion to lower costs and limit service
use may lead to worse outcomes for
persons with severe mental illness,
who often have multiple and inten-
sive service needs.
State Medicaid agencies that pay
for mental health care on a fee-for-
service basis also use cost-control
measures. Often an administrative
services organization that is not con-
Service Use and Health Status of Persons
With Severe Mental Illness in Full-Risk
and No-Risk Medicaid Programs
JJoosseepphh PP.. MMoorrrriisssseeyy,, PPhh..DD..
TT.. SSccootttt SSttrroouupp,, MM..DD..,, MM..PP..HH..
AAllaann RR.. EElllliiss,, MM..SS..WW..
EElliizzaabbeetthh MMeerrwwiinn,, PPhh..DD..
Dr. Morrissey, Dr. Stroup, and Mr. Ellis are affiliated with the
Cecil G. Sheps Center
for Health Services Research of the University of North
Carolina at Chapel Hill, 275 Air-
port Road, Chapel Hill, North Carolina 27599-7590 (e-mail,
[email protected]).
Dr. Merwin is with the Southeastern Rural Mental Health
Research Center of the Uni-
versity of Virginia in Charlottesville.
Objective: The service use patterns and health status outcomes
of Med-
icaid recipients with severe mental illness in a system that
assigned full
financial risk to managed care organizations through capitation
and a
system that paid for mental health care on a no-risk fee-for-
service ba-
sis were compared. Methods: With use of a quasi-experimental
design,
initial interviews (time 1) and follow-up interviews six months
later
(time 2) were conducted among 92 clients in the full-risk group
and 112
clients in the no-risk group. Regression models were used to
compare
self-reported service use and health status between the two
groups. Re-
sults: Service use patterns differed between the two groups.
When
symptom severity at time 1 was controlled for, clients in the
full-risk
group were more likely to have received case management but
less like-
ly to report contact with a psychiatrist or to have received
counseling
than clients in the no-risk group. When health status at time 1
was con-
trolled for, clients in the full-risk group reported poorer mental
health
at time 2 than clients in the no-risk group. When physical health
status
at time 1 was controlled for, clients in the full-risk group
reported poor-
er physical health at time 2 than clients in the no-risk group.
Conclu-
sions: Capitation was associated with lower use of costly
services. Clients
with serious mental illness in the full-risk managed care system
had
poorer mental and physical health outcomes than those in the
no-risk
system. (Psychiatric Services 53:293–298, 2002)
mor3.qxd 2/15/02 1:07 PM Page 293
tractually at financial risk provides
utilization management, including
prior authorization and concurrent
review. Because the pressures to re-
duce service use are less severe in no-
risk situations than under capitated
contracts, utilization management
alone is not likely to lead to serious
adverse consequences for clients, al-
though this area needs further study.
Several studies have shown that
various managed care arrangements
affect the use of Medicaid behavioral
health services and Medicaid costs
(3–10). One of the most consistent
findings is that capitation lowers
Medicaid costs by decreasing the use
of expensive services, such as hospi-
talization, while promoting less ex-
pensive outpatient treatment. Rela-
tively little is known about how the
resulting patterns of service use affect
patient outcomes. Some researchers
who have compared the outcomes of
persons with severe mental illness in
capitated and fee-for-service systems
have found no evidence that individu-
als have been harmed by prepaid care
(10,11). However, in Utah research-
ers found a slightly lower rate of im-
provement in mental health status
among persons with schizophrenia in
a capitated plan than among those in
a fee-for-service plan (12).
This article reports the results of a
prospective cohort study undertaken
as part of the Tidewater managed
care study, which compared two or-
ganization and financing strategies for
Virginia Medicaid recipients with se-
rious mental illness. A managed care
program in the Tidewater region that
assigned full financial risk to MCOs
through capitation was compared
with a program in the Richmond re-
gion that paid for mental health care
on a no-risk fee-for-service basis (13).
In the Richmond region (no-risk
condition), a Medicaid primary care
case management program was in op-
eration at the time of this study. In
this model of managed care, mental
health services were carved out of the
program and were provided on a fee-
for-service basis. The primary care
providers were not gatekeepers for
access to mental health services. The
state Medicaid agency contracted
with an administrative services organ-
ization to provide utilization manage-
ment, including prior authorization
and concurrent review, for mental
health services. The administrative
services organization was not at finan-
cial risk.
In the Tidewater region (full-risk
condition), Medicaid recipients were
mandated to enroll in one of four
health maintenance organizations
(HMOs). The medical-psychiatric
component of the Medicaid mental
health benefit was prepaid with use of
capitated contracts with the HMOs.
The covered mental health services
were inpatient hospitalization, psy-
chiatric evaluation, medication man-
agement, and psychotherapy. We ex-
amined the HMO in the Tidewater
region that had the largest market
share—about 60 percent. This HMO
developed a subcontract with a sub-
sidiary behavioral health MCO to
manage the covered mental health
benefits.
The behavioral health MCO sub-
contracted with five local community
mental health centers—known in Vir-
ginia as community service boards—
to provide outpatient mental health
services and paid these boards on a
capitated basis. Community service
boards serve essentially the same
function as public community mental
health centers—they represent the
primary locus of nonhospital care for
persons with serious mental illness. A
network of local hospitals provided
inpatient services. The behavioral
health MCO paid these hospitals on a
capitated basis, placing them at risk
for the costs of inpatient treatment.
By withholding a portion of the capi-
tated payments if utilization goals
were not met, the behavioral health
MCO shared financial risk for inpa-
tient services with the community
service boards and the hospitals.
Under both the no-risk and the
full-risk condition, case management
and rehabilitation services for persons
with serious mental illness were pro-
vided by community service boards
on a no-risk fee-for-service basis un-
der Virginia’s Medicaid state plan op-
tion. Under state law, only communi-
ty service boards were eligible for
Medicaid payments for state plan op-
tion services. Substance abuse servic-
es were not covered under the Vir-
ginia Medicaid program; these servic-
es were supported by block grant
funding from the Virginia Depart-
ment of Mental Health to the com-
munity service boards.
Methods
This prospective cohort study used a
quasi-experimental design. Whether
a subject received the intervention
(full-risk Medicaid managed care) was
determined by place of residence
rather than random assignment. Time
1 data collection began in August 1997,
19 months after the mandatory HMO
program began. Time 2 data were col-
lected six months after the initial in-
terview with each participant, with
the final interviews taking place in
early 1999.
The analyses were conducted with
data collected from Medicaid recipi-
ents with serious mental illness who
were recruited as outpatients at a
Tidewater area community service
board and a Richmond area commu-
nity service board. Trained interview-
ers who had clinical experience with
clients who have serious mental illness
conducted initial structured research
interviews with 243 outpatients—123
(51 percent) in the Tidewater area and
120 (49 percent) in the Richmond
area.
PSYCHIATRIC SERVICES ♦ March 2002 Vol. 53 No.
3229944
One
of the most
consistent findings
is that capitation lowers
Medicaid costs by decreasing
the use of expensive services,
such as hospitalization,
while promoting less
expensive outpatient
treatment.
mor3.qxd 2/15/02 1:07 PM Page 294
Access to study subjects was through
personnel of the community service
boards, who generated a list of clients
and asked those who were eligible to
speak with a researcher about partici-
pating in a research interview. Re-
search personnel then contacted
those who agreed and explained the
study in detail and obtained written
informed consent. The consent form
and other research procedures were
approved by the Committee on the
Protection of Human Subjects at the
University of Carolina at Chapel Hill.
As part of a Substance Abuse and
Mental Health Services Administra-
tion initiative to examine managed
behavioral health care in the public
sector, the Tidewater managed care
study used a survey instrument devel-
oped with investigators at other sites.
The instrument covered several do-
mains, including demographic infor-
mation, quality of life, clinical history,
health status, mental health symp-
toms, substance use, satisfaction, and
service use.
We focused on service use, symp-
toms, and health status and created
dichotomous variables for each. Infor-
mation about service use was obtained
by asking clients whether they had
used specific mental health and sub-
stance abuse services in the previous
three months. Physical and mental
health status were measured with the
physical component summary (PCS-
12) and mental component summary
(MCS-12), respectively, of the Med-
ical Outcomes Study 12-Item Short-
Form Health Survey (SF-12) (14). Sev-
erity of symptoms was measured with
the global severity index of the Brief
Symptom Inventory (BSI) (15).
Chi square tests and t tests were
used to compare the two groups in de-
mographic, social, clinical, and service
use variables at time 1. The analyses
then focused on two research ques-
tions. First, if symptom severity at
time 1 is controlled for, how do the
service use patterns of persons with
serious mental illness compare be-
tween the full-risk and no-risk condi-
tions? Second, if health status at time
1 and service use are controlled for,
does the type of managed care ar-
rangement affect health status six
months later? The SAS statistical pac-
kage was used for all analyses.
To address the first question, a list
of key psychiatric and medical servic-
es was adapted from the recommen-
dations of the Schizophrenia Patient
Outcomes Research Team (PORT)
(16). Chi square tests were used to
compare the crude proportions of the
two groups that reported use of each
key service during the three months
before the time 2 interview. Logistic
regression was then used to estimate
an adjusted odds ratio for each key
psychiatric and medical service, con-
trolling for symptom severity and
physical health status at time 1.
The second question was addressed
with use of regression models. Linear
regression was used to predict scores
on the SF-12 mental and physical
component summaries at time 2.
Backward stepwise selection was
used, with a p value below .05 as the
deletion criterion. The initial predic-
tors in the models included the man-
aged care condition, four dichoto-
mous variables that indicated use of
each key outpatient psychiatric serv-
PSYCHIATRIC SERVICES ♦ March 2002 Vol. 53 No. 3
229955
TTaabbllee 11
Characteristics of clients with serious mental illness under no-
risk and full-risk managed care arrangements at time 1
Overall (N=204) No risk (N=112) Full risk (N=92)
Domain and variable N or mean±SD % N or mean±SD % N or
mean±SD % p
Demographic characteristics
Male sex 92 45 53 47 39 42 ns
African-American race 153 76 84 76 69 76 ns
Currently married 15 7 8 7 7 8 ns
High school education 88 43 50 45 38 42 ns
Mean age (years) 43±9.8 44±9.7 43±10.1
Social variables
Board-and-care home resident 53 26 42 38 11 12 <.001
Homeless in the previous three months 18 9 5 4 13 14 <.05
Weekly family contact 106 52 51 46 55 60 <.05
Clinical history and health status
Drug or alcohol problems in the previous
30 days 28 14 18 16 10 11 ns
Physical illness 114 56 62 55 52 57 ns
Physical disability 55 28 32 29 23 26 ns
Global severity indexa .97±.8 .81±.73 1.17±.86 <.01
MCS-12b 42.7±12.1 44.3±12.6 40.8±11.2 <.05
PCS-12c 44.1±10.1 45.5±10.2 42.5±9.8 <.05
Service use in the previous three months
Case management contact 123 60 55 49 68 74 <.001
Primary care contact 105 52 49 44 56 61 <.05
a Global severity index of the Brief Symptom Inventory.
Possible scores range from 0 to 4, with higher scores indicating
worse symptoms.
b Mental component summary of the 12-Item Short-Form Health
Survey. Norm-based standardized scores have means of 50 and
standard deviations of
10 in the general U.S. population, with higher scores indicating
better functioning.
c Physical component summary of the 12-Item Short-Form
Health Survey. Norm-based standardized scores have means of
50 and standard deviations
of 10, with higher scores indicating better health.
mor3.qxd 2/15/02 1:07 PM Page 295
ice—case management, contact with
a psychiatrist, counseling, and voca-
tional training—and a dichotomous
variable that indicated the use of any
key medical service—primary care,
specialty care, or admission—during
the three months before the time 2
visit. The interaction of risk condition
and case management was also in-
cluded, because the nature of case
management services may differ be-
tween sites. In each initial model, the
time 1 score for the dependent vari-
able was included as a covariate.
Results
Participants in the full-risk and no-risk
groups who completed both the time
1 and time 2 assessments were similar
demographically, as can be seen from
Table 1. At time 1, the no-risk group
(Richmond area) had a higher propor-
tion of board-and-care home resi-
dents, a lower proportion who report-
ed homelessness in the previous three
months, and a lower proportion re-
porting weekly family contact than the
full-risk group (Tidewater area). The
no-risk group also reported better
mental health, as indicated by lower
scores on the global severity index of
the BSI, and less use of case manage-
ment and primary care than the full-
risk group. Clients in the no-risk
group reported better mental and
physical health status, as indicated by
higher MCS-12 and PCS-12 scores,
than clients in the full-risk group.
Six-month follow-up rates were 92
(75 percent) of 123 in the full-risk
group and 112 (93 percent) of 120 in
the no-risk group. In both groups,
clients who were lost to follow-up had
less housing stability, less disability,
and fewer symptoms than those who
were retained. In the full-risk group,
clients who were lost to follow-up re-
ported better mental health at time 1
than those who were retained.
The crude and adjusted odds ratios
for the full-risk group relative to the
no-risk group for the three-month pe-
riod preceding the time 2 interview
are shown for each key psychiatric and
medical service in Table 2. After ad-
justment for time 1 symptoms, clients
in the full-risk group were more likely
to have received case management
but less likely to report contact with a
psychiatrist or receipt of individual,
group, or family counseling than
clients in the no-risk group. The re-
sults for vocational training and psy-
chiatric admission were not significant
but suggested that clients in the full-
risk group were less likely to have re-
ceived these services. For key medical
services, there was a nonsignificant
pattern of more service use for clients
in the full-risk group.
At time 2, clients in the full-risk
group continued to report worse
mental and physical health than
clients in the no-risk group. Respec-
tive scores were 41.4 and 48.1 on the
MCS-12 (t=4.15, df=190, p<.001)
and 41.3 and 46.4 on the PCS-12
(t=3.30, df=190, p<.001). To control
for the differences in health status at
time 1, we included the time 1 scores
for the dependent variables in the lin-
ear regression models.
After backward stepwise regression,
the only significant predictors in the fi-
nal model of the MCS-12 score at time
2 were the score at time 1 and the man-
aged care condition (Table 3). When
MCS-12 score at time 1 was controlled
for, the full-risk managed care condi-
tion was a predictor of poorer mental
health. The difference of 4.1 points in
the MCS-12 score that was associated
with capitation in our model is of only
modest clinical significance. In the
study in which the validity of the SF-12
was established (14), people with seri-
ous mental and physical illness scored
9.3 points lower than people with seri-
ous physical illness alone, while people
with mental illness alone scored 16.8
points lower than people with only a
minor medical illness.
In the final linear regression model
for the PCS-12 score at time 2, the
PSYCHIATRIC SERVICES ♦ March 2002 Vol. 53 No.
3229966
TTaabbllee 22
Service use by clients with serious mental illness under no-risk
and full-risk man-
aged care arrangements during the three months before six-
month follow-up
No risk Full risk
(N=112) (N=92) Crude Adjusted
odds ratio odds ratio
Type of service N % N % for full risk for full riska
Key psychiatric services
Contact with psychiatrist 97 87 65 71 .37∗ ∗ .36∗ ∗
Case management 57 51 59 64 1.73 2.05∗
Counseling 45 40 23 25 .50∗ .48∗
Vocational training 37 33 24 26 .72 .68
Psychiatric admission 15 13 4 4 .30∗ .22
Key medical services
Primary care 56 50 52 57 1.31 1.23
Medical prescription 48 43 44 48 1.23 1.18
Medical specialist 9 8 11 12 1.55 .97
Medical admission 6 5 9 10 1.92 1.63
a Adjusted for global severity index scores for key psychiatric
services and for physical component
summary scores for key medical services
∗ p<.05
∗ ∗ p<.01
∗ ∗ ∗ p<.001
TTaabbllee 33
Final linear regression model predicting mental component
summary (MCS-12)
score at time 2
Raw Standard
regression regression
Variable coefficient coefficient SE p
Capitation –4.145 –.180 1.50 .006
MCS-12 score at time 1 .479 .490 .06 <.001
Intercept 25.548 3.03 <.001
mor3.qxd 2/15/02 1:07 PM Page 296
managed care condition, contact with
a psychiatrist in the previous three
months, use of any physical health
service in the previous three months,
and PCS-12 score at time 1 were sig-
nificant predictors, as shown in Table
4. Contact with a psychiatrist and the
use of any physical health service
were associated with poorer physical
health status. The full-risk managed
care condition was associated with
poorer physical health status. Again,
the 3.9-point difference in PCS-12
score that was associated with capita-
tion in our model is of moderate clin-
ical significance. In the study in
which the validity of the SF-12 was
established, people with serious men-
tal and physical illness scored 2.4
points lower than people with serious
physical illness alone, while people
with mental illness alone scored 1.9
points higher than people with only a
minor medical illness (14).
Discussion and conclusions
We found differences between the
service use patterns of persons with
serious mental illness in a full-risk
Medicaid HMO and those in a no-risk
Medicaid plan. Services covered by a
capitated fee, including outpatient
services provided by a psychiatrist
and individual, group, and family
counseling, were used significantly
less by the enrollees in the full-risk
HMO than by those in the no-risk
Medicaid program. Use of inpatient
services, also covered by a capitated
fee, showed a similar trend. Case man-
agement, a service paid for through
separate funds on a fee-for-service
basis under both arrangements, was
more commonly reported by clients
in the full-risk group than by those in
the no-risk group.
These patterns of service use sug-
gest that the financial incentives asso-
ciated with the full-risk arrangement
had an impact in the expected direc-
tion. The community service board in
the full-risk setting had a strong in-
centive to use case management, be-
cause doing so provided income in
addition to the capitated payment re-
ceived from the behavioral health
MCO. The incentive to provide case
management and bill for it was less
strong in the no-risk setting, because
all services could be billed on a fee-
for-service basis.
The full-risk managed care model
we studied in the Tidewater region
had unique characteristics. Although
the state Medicaid agency paid
HMOs a single capitated fee to cover
both mental and physical health serv-
ices, the HMO in this study provided
mental health services through a cap-
itated subcontract with a subsidiary
behavioral health MCO. By contract-
ing with the existing public mental
health centers to provide outpatient
services, the behavioral health MCO
ensured that persons with serious
mental illness had access to providers
who had appropriate experience. By
allowing these mental health centers
to continue to bill for case manage-
ment outside the capitated contract,
the state Medicaid agency limited
some of the financial risk of the com-
munity service boards.
At time 1, study participants in the
full-risk group reported poorer men-
tal and physical health than partici-
pants in the no-risk group. Possible
explanations for the differences at
time 1 include sampling bias—that is,
nonrepresentativeness of the sam-
ples—and real population differ-
ences. Because staff of the communi-
ty service boards approached every
eligible client who could be located,
the clients enrolled in this study can
be considered a representative sam-
ple of all community service board
clients who have severe mental ill-
ness. Other possible reasons for these
differences are that the community
service boards and HMOs targeted
services for sicker clients in the full-
risk setting or that the program re-
sulted in poorer outcomes that were
already apparent at the time of the
time 1 interviews. Future research
may be able to avoid the time 1 dif-
ferences by focusing on new Medic-
aid enrollees.
We found that adults with severe
mental illness in the full-risk man-
aged care setting had poorer out-
comes, consistent with our hypothe-
ses. When scores at time 1 were con-
trolled for, the full-risk condition was
associated with poorer mental and
physical health at time 2.
The results of this study support
earlier findings that the service use
patterns of adults with severe mental
illness are affected by risk-based
managed care contracts. Previous
studies have not shown a consistent
effect of service use patterns on client
outcomes under capitation (10–12).
Because ours was a quasi-experimen-
tal study, we cannot draw definite
conclusions. We found that the full-
risk managed care model we studied
may have had an adverse effect on the
mental and physical health of persons
with serious mental illness.
Virginia’s mandatory HMO pro-
gram, although limited in geographic
scope, saved the state Medicaid
agency at least $16 million during its
first two years of operation (17). The
program expanded to the Richmond
area in 1999, providing indirect evi-
dence that the program is acceptable
for MCOs and the state Medicaid
agency. Whether this is sound public
policy can be determined only by con-
tinued evaluation and public debate.
Although this observational study
provided no definitive evidence on
capitated mental health services for
adults with serious mental illness, it
did provide evidence that full-risk
capitation for this population may
PSYCHIATRIC SERVICES ♦ March 2002 Vol. 53 No. 3
229977
TTaabbllee 44
Final linear regression model predicting physical component
summary (PCS-12)
score at time 2
Raw Standard
regression regression Standard
Variable coefficient coefficient error p
Contact with psychiatrist –3.905 –.05 1.58 .015
Use of a key medical service –2.718 –.13 1.24 .030
Capitation –3.781 –.18 1.26 .003
PCS-12 score at time 1 .573 .56 .06 <.001
Intercept 25.739 3.50 <.001
mor3.qxd 2/15/02 1:07 PM Page 297
have adverse consequences. Although
the clinical effects of capitation in our
study were modest, they were found
over a relatively short period. Six
months is not a long follow-up period
for persons who have serious mental
illness. However, our findings parallel
those from Utah, where adverse ef-
fects became apparent only after
about three years of follow-up (12).
Longer-term follow-up studies
would help determine whether the
negative effects we found in Virginia
persist or intensify. In the absence of
longer-term data, caution in the use
of risk-based contracts for services for
persons with serious mental illness is
warranted. ♦
Acknowledgment
This study was supported by cooperative
agreement UR-7-TI11272 with the Sub-
stance Abuse and Mental Health Services
Administration.
References
1. Durham M: Mental health and managed
care. Annual Review of Public Health 19:
493–505, 1998
2. Hoge MA, Davidson L, Griffith EEH, et al:
Defining managed care in public-sector
psychiatry. Hospital and Community Psy-
chiatry 45:1085–1089, 1994
3. Christianson JB, Manning W, Lurie N, et
al: Utah’s prepaid mental health plan: the
first year. Health Affairs 14(3):160–172,
1995
4. Callahan JJ, Shepard DS, Beinecke RH, et
al: Mental health/substance abuse treat-
ment in managed care: the Massachusetts
Medicaid experience. Health Affairs 14(3):
173–184, 1995
5. Dickey B, Normand SL, Norton EC, et al:
Managing the care of schizophrenia: les-
sons from a 4-year Massachusetts Medicaid
study. Archives of General Psychiatry 53:
945–952, 1996
6. Stroup TS, Dorwart RA: The impact of a
managed mental health program on Medic-
aid recipients with severe mental illness.
Psychiatric Services 46:885–889, 1995
7. McFarland BH, Johnson RE, Hornbrook
MC: Enrollment duration, service use, and
costs of care for severely mentally ill mem-
bers of a health maintenance organization.
Archives of General Psychiatry 53:938–944,
1996
8. Popkin MK, Lurie N, Manning W, et al:
Changes in the process of care for Medic-
aid patients with schizophrenia in Utah’s
prepaid mental health plan. Psychiatric Ser-
vices 515–523, 1998
9. Liu CF, Manning WG, Christianson JB, et
al: Patterns of outpatient use of mental
health services for Medicaid beneficiaries
under a prepaid mental health carve-out.
Administration and Policy in Mental Health
26:401–415, 1999
10. Warner R, Huxley P: Outcomes for people
with schizophrenia before and after Medic-
aid capitation at a community agency in
Colorado. Psychiatric Services 49:802–807,
1998
11. Lurie N, Moscovice IS, Finch M, et al:
Does capitation affect the health of the
chronically mentally ill? Results from a ran-
domized trial. JAMA 267:3300–3304, 1992
12. Manning WG, Liu CF, Stoner TJ, et al:
Outcomes for Medicaid beneficiaries with
schizophrenia under a prepaid mental
health carve-out. Journal of Behavioral
Health Services Research 26:442–450, 1999
13. Fried BJ, Topping S, Morrissey JP, et al:
Comparing provider perceptions of access
and utilization management in full-risk and
no-risk Medicaid programs for adults with a
serious mental illness. Journal of Behav-
ioral Health Services Research 27:29–46,
2000
14. Ware JE, Kosinski M, Keller SD: A 12-item
Short-Form Health Survey (SF-12): con-
struction of scales and preliminary tests of
reliability and validity. Medical Care 32:
220–233, 1996
15. Derogatis LR: A Brief Form of the SCL-
90-R: A Self-Report Symptom Inventory
Designed to Measure Psychological Stress:
Brief Symptom Inventory (BSI). Minneapo-
lis, National Computer Systems, 1993
16. Lehman AF, Steinwachs DM: Translating
research into practice: the Schizophrenia
Patient Outcomes Research Team (PORT)
treatment recommendations. Schizophre-
nia Bulletin 24:1–10, 1998
17. Virginia Division of Medical Assistance
Services: Managed Care Program Summa-
ry. Richmond, 2000. Available at www.cns.
state.va.us/dmas/managed_care/manged_
care.htm
PSYCHIATRIC SERVICES ♦ March 2002 Vol. 53 No.
3229988
RReevviieewweerrss NNeeeeddeedd
Psychiatric Services seeks expert reviewers in the following
areas:
♦ Water intoxication
♦ Cognitive-behavioral therapy
♦ Outpatient commitment
♦ Work with the police
♦ Psychiatry in other countries
♦ Experiences of patients and former patients
♦ Telemedicine and telecommunications
♦ Outcome and clinical measurement scales
Reviewers should be familiar with the literature in their areas of
expertise,
should have published in peer-reviewed journals, and should be
familiar with the
content and focus of Psychiatric Services.
Prospective reviewers should send a curriculum vitae,
specifying areas of interest,
to John A. Talbott, M.D., Editor, Psychiatric Services,
American Psychiatric Associ-
ation, 1400 K Street, N.W., Washington, D.C. 20005 (e-mail,
[email protected]).
mor3.qxd 2/15/02 1:07 PM Page 298
special article
T h e n e w e n g l a n d j o u r n a l o f m e d i c i n e
n engl j med 360;16 nejm.org april 16, 20091628
Use of Electronic Health Records
in U.S. Hospitals
Ashish K. Jha, M.D., M.P.H., Catherine M. DesRoches, Dr.Ph.,
Eric G. Campbell, Ph.D., Karen Donelan, Sc.D., Sowmya R.
Rao, Ph.D.,
Timothy G. Ferris, M.D., M.P.H., Alexandra Shields, Ph.D.,
Sara Rosenbaum, J.D.,
and David Blumenthal, M.D., M.P.P.
From the Department of Health Policy
and Management, Harvard School of Pub-
lic Health (A.K.J.); the Division of General
Medicine, Brigham and Women’s Hospi-
tal (A.K.J.); the Veterans Affairs Boston
Healthcare System (A.K.J.); and the Insti-
tute for Health Policy (C.M.D., E.G.C.,
K.D., S.R.R., T.G.F., A.S., D.B.) and the
Biostatistics Center (S.R.R.), Massachu-
setts General Hospital — all in Boston;
and the Department of Health Policy,
George Washington University, Washing-
ton, DC (S.R.). Address reprint requests
to Dr. Jha at the Harvard School of Public
Health, 677 Huntington Ave., Boston, MA
02115, or at [email protected]
This article (10.1056/NEJMsa0900592) was
published at NEJM.org on March 25, 2009.
N Engl J Med 2009;360:1628-38.
Copyright © 2009 Massachusetts Medical Society.
A b s t r a c t
Background
Despite a consensus that the use of health information
technology should lead to
more efficient, safer, and higher-quality care, there are no
reliable estimates of the
prevalence of adoption of electronic health records in U.S.
hospitals.
Methods
We surveyed all acute care hospitals that are members of the
American Hospital
Association for the presence of specific electronic-record
functionalities. Using a
definition of electronic health records based on expert
consensus, we determined
the proportion of hospitals that had such systems in their
clinical areas. We also
examined the relationship of adoption of electronic health
records to specific hos-
pital characteristics and factors that were reported to be barriers
to or facilitators
of adoption.
Results
On the basis of responses from 63.1% of hospitals surveyed,
only 1.5% of U.S. hos-
pitals have a comprehensive electronic-records system (i.e.,
present in all clinical
units), and an additional 7.6% have a basic system (i.e., present
in at least one clinical
unit). Computerized provider-order entry for medications has
been implemented in
only 17% of hospitals. Larger hospitals, those located in urban
areas, and teaching
hospitals were more likely to have electronic-records systems.
Respondents cited cap-
ital requirements and high maintenance costs as the primary
barriers to implemen-
tation, although hospitals with electronic-records systems were
less likely to cite
these barriers than hospitals without such systems.
Conclusions
The very low levels of adoption of electronic health records in
U.S. hospitals suggest
that policymakers face substantial obstacles to the achievement
of health care per-
formance goals that depend on health information technology. A
policy strategy fo-
cused on financial support, interoperability, and training of
technical support staff
may be necessary to spur adoption of electronic-records systems
in U.S. hospitals.
Copyright © 2009 Massachusetts Medical Society. All rights
reserved.
Downloaded from www.nejm.org on February 21, 2010 . For
personal use only. No other uses without permission.
Use of Elec tronic He a lth R ecor ds in U.S. Hospita l s
n engl j med 360;16 nejm.org april 16, 2009 1629
The U.S. health care system faces chal-lenges on multiple
fronts, including rising costs and inconsistent quality.1-3 Health
in-
formation technology, especially electronic health
records, has the potential to improve the efficiency
and effectiveness of health care providers.4,5 Meth-
ods to speed the adoption of health information
technology have received bipartisan support among
U.S. policymakers, and the American Recovery and
Reinvestment Act of 2009 has made the promotion
of a national, interoperable health information sys-
tem a priority. Despite broad consensus on the po-
tential benefits of electronic health records and
other forms of health information technology, U.S.
health care providers have been slow to adopt
them.6,7 Using a well-specified definition of elec-
tronic health records in a recent study, we found
that only 17% of U.S. physicians use either a min-
imally functional or a comprehensive electronic-
records system.8
Prior data on hospitals’ adoption of electronic
health records or key functions of electronic rec-
ords (e.g., computerized provider-order entry for
medications) suggest levels of adoption that range
between 5%9 and 59%.10 This broad range reflects
different definitions of what constitutes an elec-
tronic health record,10,11 use of convenience sam-
ples,12 and low survey response rates.13 To provide
more precise estimates of adoption of electronic
health records among U.S. hospitals, the Office
of the National Coordinator for Health Informa-
tion Technology of the Department of Health and
Human Services commissioned a study to measure
current levels of adoption to facilitate tracking of
these levels over time.
As in our previous study,8 we identified key
clinical functions to define the minimum func-
tionalities necessary to call a system an electronic-
records system in the hospital setting. We also
defined an advanced configuration of functional-
ities that might be termed a comprehensive elec-
tronic-records system. Our survey then determined
the proportion of U.S. hospitals reporting the use
of electronic health records for either of these sets
of functionalities. We hypothesized that large hos-
pitals would have a higher prevalence of adoption
of electronic health records than smaller hospitals.
Similarly, we hypothesized that major teaching
hospitals would have a higher prevalence of adop-
tion than nonteaching hospitals and private hos-
pitals a higher prevalence than public hospitals.
Finally, to guide policymakers, we sought to iden-
tify frequently reported barriers to adoption and
potential mechanisms for facilitating it.
M e t h o d s
Survey Development
We developed our survey by examining and syn-
thesizing prior hospital-based surveys of electronic-
records systems or related functionalities (e.g.,
computerized provider-order entry) that have been
administered in the past 5 years.9,13,14 Working
with experts who had led hospital-based surveys,
we developed an initial draft of the instrument.
To get feedback, we shared the survey with chief
information officers, other hospital leaders, and
survey experts. We then obtained input from a
consensus panel of experts in the fields of health
information technology, health services research,
survey research, and health policy. Further survey
modifications were approved by our expert pan-
el. The final survey instrument was approved for
use by the institutional review board of Partners
HealthCare.
Survey Sample and Administration
We collaborated with the American Hospital As-
sociation (AHA) to survey all acute care general
medical and surgical member hospitals. The sur-
vey was presented as an information technology
supplement to the association’s annual survey of
members, and like the overall AHA questionnaire,
was sent to the hospital’s chief executive officer.
Hospital chief executive officers generally assigned
the most knowledgeable person in the institution
(in this case, typically the chief information of-
ficer or equivalent) to complete the survey. Non-
responding hospitals received multiple telephone
calls and reminder letters asking them to com-
plete the survey. The survey was initially mailed
in March 2008, and our in-field period ended in
September 2008.
Survey Content
We asked respondents to report on the presence
or absence of 32 clinical functionalities of an elec-
tronic-records system and on whether their hos-
pital had fully implemented these functionalities
in all major clinical units, had implemented them
in one or more (but not all) major clinical units,
or had not yet fully implemented them in any unit
Copyright © 2009 Massachusetts Medical Society. All rights
reserved.
Downloaded from www.nejm.org on February 21, 2010 . For
personal use only. No other uses without permission.
T h e n e w e n g l a n d j o u r n a l o f m e d i c i n e
n engl j med 360;16 nejm.org april 16, 20091630
in the hospital. We asked respondents to identify
whether certain factors were major or minor bar-
riers or were not barriers to the adoption of an
electronic-records system and whether specific pol-
icy changes would have a positive or negative ef-
fect on their decision to adopt such a system. The
questions and response categories used are listed
in the Supplementary Appendix, available with the
full text of this article at NEJM.org.
Measures of Electronic-Records Use
The Institute of Medicine has developed a com-
prehensive list of the potential functionalities of
an inpatient electronic health record,15 but there
is no consensus on what functionalities constitute
the essential elements necessary to define an elec-
tronic health record in the hospital setting. There-
fore, we used the expert panel described earlier
to help define the functionalities that constitute
comprehensive and basic electronic-records sys-
tems in the hospital setting. The panel was asked
to identify whether individual functionalities would
be necessary to classify a hospital as having a
comprehensive or basic electronic health record.
With the use of a modified Delphi process, the
panel reached a consensus on the 24 functions that
should be present in all major clinical units of a
hospital to conclude that it had a comprehensive
electronic-records system.16 Similarly, the panel
reached a consensus on eight functionalities that
should be present in at least one major clinical
unit (e.g., the intensive care unit) in order for the
hospital to be classified as having a basic electronic-
records system. Because the panel disagreed on the
need for two additional functionalities (physicians’
notes and nursing assessments) to classify a hos-
pital as having a basic system, we developed two
definitions of a basic electronic-records system, one
that included functionalities for nursing assess-
ments and physicians’ notes and another that did
not. We present the results with the use of both
definitions.
Statistical Analysis
We compared the characteristics of respondent and
nonrespondent hospitals and found modest but
significant differences. We estimated the propen-
sity to respond to the survey with the use of a lo-
gistic-regression model that included all these
characteristics and used the inverse of this pro-
pensity value as a weight in all analyses.
We examined the proportion of hospitals that
had each of the individual functionalities and sub-
sequently calculated the prevalence of adoption of
an electronic-records system, using three defini-
tions of such a system: comprehensive, basic with
physicians’ and nurses’ notes, and basic without
physician and nursing notes. For all subsequent
analyses, we used the definition of basic electronic
health records that included clinicians’ notes.
We explored bivariate relationships between key
hospital characteristics (size, U.S. Census region,
ownership, teaching status, urban vs. rural loca-
tion, and presence or absence of markers of a high-
technology institution) and adoption of a basic or
comprehensive electronic-records system. We con-
sidered the use of various potential markers of a
high-technology institution, including the pres-
ence of a dedicated coronary care unit, a burn unit,
or a positron-emission tomographic scanner. Be-
cause the results were similar for each of these
markers, we present data based on the presence
or absence of only one — a dedicated coronary
care unit. We subsequently built a multivariable
model to calculate levels of adoption of electronic-
records systems, adjusted according to these hos-
pital characteristics. We present the unadjusted
results below and those from the multivariate mod-
els in the Supplementary Appendix.
Finally, we built logistic-regression models (ad-
justing for the hospital characteristics mentioned
above) to assess whether the presence or absence
of electronic health records was associated with
respondents’ reports of the existence of specific
barriers and facilitators of adoption. Since the
number of hospitals with comprehensive elec-
tronic-records systems was small, we combined
hospitals with comprehensive systems and those
with basic electronic-records systems and com-
pared their responses with those from institutions
without electronic health records. In all analyses,
two-sided P values of less than 0.05 were consid-
ered to indicate statistical significance.
R e s u l t s
We received responses from 3049 hospitals, or
63.1% of all acute care general hospitals that were
surveyed. After excluding federal hospitals and
those located outside the 50 states and the Dis-
trict of Columbia, we were left with 2952 institu-
tions. There were modest differences between re-
Copyright © 2009 Massachusetts Medical Society. All rights
reserved.
Downloaded from www.nejm.org on February 21, 2010 . For
personal use only. No other uses without permission.
Use of Elec tronic He a lth R ecor ds in U.S. Hospita l s
n engl j med 360;16 nejm.org april 16, 2009 1631
spondents and nonrespondents (Table 1), and all
results reported below have been adjusted for po-
tential nonresponse bias.
Adoption of Clinical Functionalities
in Electronic Format
We found large variations in the implementation
of key clinical functionalities across U.S. hospi-
tals. Only 12% of hospitals had instituted electron-
ic physicians’ notes across all clinical units, and
computerized provider-order entry for medications
was reported as having been implemented across
all clinical units in 17% of hospitals (Table 2). In
contrast, more than 75% of hospitals reported
adoption of electronic laboratory and radiologic
reporting systems. A sizable number of hospitals
reported having implemented several key func-
tionalities in one or more (but not all) units,
having begun such implementation, or having
identified resources for the purpose of such im-
plementation. These functionalities included phy-
sicians’ notes (among 44% of the hospitals) and
computerized provider-order entry (38%).
Adoption of Electronic Records
The presence of certain individual functionalities
was considered necessary for an electronic-records
system to be defined as comprehensive or basic
by our expert panel (Table 3). On the basis of these
definitions, we found that 1.5% (95% confidence
interval [CI], 1.1 to 2.0) of U.S. hospitals had a
comprehensive electronic-records system imple-
mented across all major clinical units and an ad-
ditional 7.6% (95% CI, 6.8 to 8.1) had a basic sys-
tem that included functionalities for physicians’
notes and nursing assessments in at least one
clinical unit. When defined without the require-
ment for clinical notes, a basic electronic-records
system was found in 10.9% of hospitals (95% CI,
9.7 to 12.0). If we include federal hospitals run by
the Veterans Health Administration (VHA), the
proportion of hospitals with comprehensive elec-
tronic-records systems increases to 2.9% (95% CI,
2.3 to 3.5), the proportion with basic systems that
include clinicians’ notes increases to 7.9% (95% CI,
6.9 to 8.8), and the proportion with basic systems
that do not include clinicians’ notes increases to
11.3% (95% CI, 10.2 to 12.5).
Hospitals were more likely to report having an
electronic-records system if they were larger insti-
tutions, major teaching hospitals, part of a larger
hospital system, or located in urban areas and if
they had dedicated coronary care units (Table 4);
these differences were small. We found no rela-
tionship between ownership status and level of
adoption of electronic health records: the preva-
lence of electronic-records systems in public hos-
pitals was similar to that in private institutions.
Even when we compared for-profit with nonprofit
(public and private) institutions, there were no
significant differences in adoption. In multivari-
able analyses, each of these differences diminished
Table 1. Characteristics of Responding and Nonresponding U.S.
Acute Care
Hospitals, Excluding Federal Hospitals.*
Characteristic
Respondents
(N = 2952)
Nonrespondents
(N = 1862)
percent
Size
Small (6–99 beds) 48 50
Medium (100–399 beds) 43 43
Large (≥400 beds) 10 7
Region
Northeast 14 12
Midwest 33 24
South 37 41
West 17 22
Ownership status
For-profit hospital 14 22
Private nonprofit hospital 62 55
Public hospital 24 23
Teaching status
Major teaching hospital 7 4
Minor teaching hospital 16 16
Nonteaching hospital 77 80
Member of hospital system
Yes 43 47
No 57 53
Location
Urban 62 60
Nonurban 38 40
Dedicated coronary care unit†
Yes 35 25
No 65 75
* P<0.05 for all comparisons. Numbers may not add to 100
because of rounding.
† The presence of a coronary care unit is a marker of
technological capability.
Copyright © 2009 Massachusetts Medical Society. All rights
reserved.
Downloaded from www.nejm.org on February 21, 2010 . For
personal use only. No other uses without permission.
T h e n e w e n g l a n d j o u r n a l o f m e d i c i n e
n engl j med 360;16 nejm.org april 16, 20091632
further and was less consistently significant (see
the Supplementary Appendix).
Barriers to and Facilitators of Electronic-
Records Adoption
Among hospitals without electronic-records sys-
tems, the most commonly cited barriers were in-
adequate capital for purchase (74%), concerns about
maintenance costs (44%), resistance on the part
of physicians (36%), unclear return on investment
(32%), and lack of availability of staff with ade-
quate expertise in information technology (30%)
(Fig. 1). Hospitals that had adopted electronic-
records systems were less likely to cite four of these
five concerns (all except physicians’ resistance) as
major barriers to adoption than were hospitals that
had not adopted such systems (Fig. 1).
Most hospitals that had adopted electronic-
records systems identified financial factors as hav-
ing a major positive effect on the likelihood of
adoption: additional reimbursement for electronic
health record use (82%) and financial incentives
Table 2. Selected Electronic Functionalities and Their Level of
Implementation in U.S. Hospitals.
Electronic Functionality
Fully
Implemented
in All Units
Fully
Implemented
in at Least
One Unit
Implementation
Begun or
Resources
Identified*
No
Implementation,
with No
Specific Plans
percent of hospitals
Clinical documentation
Medication lists 45 17 18 20
Nursing assessments 36 21 18 24
Physicians’ notes 12 15 29 44
Problem lists 27 17 23 34
Test and imaging results
Diagnostic-test images (e.g., electrocar-
diographic tracing)
37 11 19 32
Diagnostic-test results (e.g., echocardio-
graphic report)
52 10 15 23
Laboratory reports 77 7 7 9
Radiologic images 69 10 10 10
Radiologic reports 78 7 7 8
Computerized provider-order entry
Laboratory tests 20 12 25 42
Medications 17 11 27 45
Decision support
Clinical guidelines (e.g., beta-blockers af-
ter myocardial infarction)
17 10 25 47
Clinical reminders (e.g., pneumococcal
vaccine)
23 11 24 42
Drug-allergy alerts 46 15 16 22
Drug–drug interaction alerts 45 16 17 22
Drug–laboratory interaction alerts (e.g.,
digoxin and low level of serum potas-
sium)
34 14 21 31
Drug-dose support (e.g., renal dose gui-
dance)
31 15 21 33
* These hospitals reported that they were either beginning to
implement the specified functionality in at least one unit
or had identified the resources required for implementation in
the next year.
Copyright © 2009 Massachusetts Medical Society. All rights
reserved.
Downloaded from www.nejm.org on February 21, 2010 . For
personal use only. No other uses without permission.
Use of Elec tronic He a lth R ecor ds in U.S. Hospita l s
n engl j med 360;16 nejm.org april 16, 2009 1633
for adoption (75%). Other facilitators of adoption
included the availability of technical support for
the implementation of information technology
(47%) and objective third-party evaluations of elec-
tronic health record products (35%). Hospitals
with and those without electronic-records systems
were equally likely to cite these factors (P>0.10
for each comparison) (Fig. 2).
Table 3. Electronic Requirements for Classification of Hospitals
as Having a Comprehensive or Basic Electronic-
Records System.*
Requirement
Comprehensive
EHR System
Basic EHR
System with
Clinician Notes
Basic EHR
System without
Clinician Notes
Clinical documentation
Demographic characteristics of patients √ √ √
Physicians’ notes √ √
Nursing assessments √ √
Problem lists √ √ √
Medication lists √ √ √
Discharge summaries √ √ √
Advanced directives √
Test and imaging results
Laboratory reports √ √ √
Radiologic reports √ √ √
Radiologic images √
Diagnostic-test results √ √ √
Diagnostic-test images √
Consultant reports √
Computerized provider-order entry
Laboratory tests √
Radiologic tests √
Medications √ √ √
Consultation requests √
Nursing orders √
Decision support
Clinical guidelines √
Clinical reminders √
Drug-allergy alerts √
Drug–drug interaction alerts √
Drug–laboratory interaction alerts (e.g., digox-
in and low level of serum potassium)
√
Drug-dose support (e.g., renal dose guidance) √
Adoption level — % of hospitals (95% CI) 1.5 (1.1–2.0) 7.6
(6.8–8.1) 10.9 (9.7–12.0)
* A comprehensive electronic-health-records (EHR) system was
defined as a system with electronic functionalities in all
clinical units. A basic electronic-records system was defined as
a system with electronic functionalities in at least one
clinical unit.
Copyright © 2009 Massachusetts Medical Society. All rights
reserved.
Downloaded from www.nejm.org on February 21, 2010 . For
personal use only. No other uses without permission.
T h e n e w e n g l a n d j o u r n a l o f m e d i c i n e
n engl j med 360;16 nejm.org april 16, 20091634
D i s c u s s i o n
We found that less than 2% of acute care hospi-
tals have a comprehensive electronic-records sys-
tem, and that, depending on the definition used,
between 8 and 12% of hospitals have a basic elec-
tronic-records system. With the use of the defini-
tion that requires the presence of functionalities
for physicians’ notes and nursing assessments, in-
formation systems in more than 90% of U.S. hos-
pitals do not even meet the requirement for a basic
electronic-records system.
Although levels of adoption of electronic health
records were low, many functionalities that un-
derlie electronic-records systems have been widely
implemented. A sizable proportion of hospitals
reported that laboratory and radiologic reports,
radiologic images, medication lists, and some de-
cision-support functions are available in electronic
format. Others reported that they planned to up-
grade their information systems to an electronic-
records system by adding functionalities, such as
computerized provider-order entry, physicians’
notes, and nursing assessments. However, these
Table 4. Adoption of Comprehensive and Basic Electronic-
Records Systems According to Hospital Characteristics.*
Characteristic
Comprehensive
EHR System
Basic EHR
System†
No EHR
System
Overall
P Value
percent of hospitals
Size <0.001
Small (6–99 beds) 1.2±0.3 4.9±0.6 93.9±0.6
Medium (100–399 beds) 1.7±0.4 8.1±0.8 90.2±0.8
Large (≥400 beds) 2.6±0.9 15.9±2.2 81.5±2.3
Region 0.77
Northeast 1.1±0.5 8.9±1.4 90.1±1.5
Midwest 1.7±0.4 6.6±0.8 91.7±0.9
South 1.4±0.4 7.3±0.8 91.3±0.8
West 1.9±0.6 7.0±1.2 91.1±1.3
Profitability status 0.08
For-profit hospital 1.3±0.5 5.2±1.1 93.5±1.2
Private nonprofit hospital 1.5±0.3 8.4±0.6 90.1±0.7
Public hospital 1.7±0.5 5.8±0.9 92.4±1.0
Teaching status <0.001
Major teaching hospital 2.6±1.1 18.5±2.6 78.9±2.7
Minor teaching hospital 2.4±0.7 10.6±1.4 87.0±1.6
Nonteaching hospital 1.3±0.2 5.6±0.5 93.1±0.5
Member of hospital system 0.006
Yes 2.1±0.4 8.4±0.9 89.5±0.9
No 1.1±0.2 6.3±0.6 92.6±0.6
Location <0.001
Urban 1.9±0.3 8.4±0.6 89.7±0.6
Nonurban 0.6±0.3 4.0±0.7 95.3±0.8
Dedicated coronary care unit‡ 0.002
Yes 1.9±0.4 9.7±0.9 88.4±1.0
No 1.3±0.3 6.3±0.6 92.4±0.6
* Plus–minus values are means ±SE. EHR denotes electronic
health record.
† The definition of a basic system that included functionalities
for physicians’ notes and nursing assessments was used
for this analysis.
‡ The presence of a coronary care unit is a marker of
technological capability.
Copyright © 2009 Massachusetts Medical Society. All rights
reserved.
Downloaded from www.nejm.org on February 21, 2010 . For
personal use only. No other uses without permission.
Use of Elec tronic He a lth R ecor ds in U.S. Hospita l s
n engl j med 360;16 nejm.org april 16, 2009 1635
functionalities are typically more difficult to im-
plement than the others that we examined, and
it remains unclear whether hospitals will be able
to do so successfully.
We found high levels of decision support in
the absence of a comparable prevalence of com-
puterized provider-order entry. It is possible that
respondents reporting that their hospitals have
implemented electronic decision support were in-
cluding in that category decision-support capabili-
ties that are available only for electronic pharmacy
systems, thereby overstating the preparedness of
hospitals to provide physicians with electronic de-
cision support for patient care.
We found somewhat higher levels of adoption
among larger, urban, teaching hospitals, proba-
bly reflecting greater availability of the financial
resources necessary to acquire an electronic-records
system. We expected to find lower levels of adop-
tion among public hospitals, which might be fi-
nancially stressed and therefore less able to pur-
chase these systems. Although our results do not
support this hypothesis, we did not directly ex-
amine detailed indicators of the financial health
of the hospitals, such as their operating margins.
In 2006, we performed a comprehensive review
of the literature on hospital adoption of electronic-
records systems in the United States and found
that the most rigorous assessment made was for
computerized provider-order entry and that its
prevalence was between 5 and 10%.6,9,14 An ear-
lier AHA survey showed a higher prevalence of
computerized provider-order entry,13 but the re-
sponse rate was only 19%. A Mathematica survey
showed that 21% of U.S. hospitals had comput-
erized provider-order entry and 59% had elec-
tronic clinical documentation.10 However, this
survey’s definition of clinical documentation al-
lowed for the inclusion of systems that were only
capable of recording demographic characteristics
of patients, a definition that is likely to have in-
flated adoption levels, given that Medicare requires
electronic reporting of demographic data. A re-
cent analysis, based on a proprietary database with
an unclear sampling frame and an unknown re-
sponse rate, showed that 13% of the hospitals had
implemented computerized provider-order entry,
a prevalence similar to that in our study.11
Most reports of a beneficial effect of electronic-
records systems involved systems capable of com-
puterized provider-order entry with clinical-deci-
sion support.4 Our experts took a lenient approach
by not requiring the presence of clinical-decision
support as part of a basic electronic-records sys-
tem and by requiring adoption of computerized
provider-order entry in only one clinical unit.
33p9
80
70
60
40
30
10
50
20
0
Hospitals with EHR Hospitals without EHR
AUTHOR:
FIGURE:
JOB:
4-C
H/T
RETAKE
SIZE
ICM
CASE
EMail Line
H/T
Combo
Revised
AUTHOR, PLEASE NOTE:
Figure has been redrawn and type has been reset.
Please check carefully.
REG F
Enon
1st
2nd
3rd
Jha
1 of 2
04-16-09
ARTIST: ts
36016 ISSUE:
Inadequate capital
for purchase
Unclear ROI Maintenance
cost
Physicians’
resistance
Inadequate
IT staff
Barriers
P
ro
p
o
rt
io
n
o
f
H
o
sp
it
al
s
(%
)
Figure 1. Major Perceived Barriers to Adoption of Electronic
Health Records (EHRs) among Hospitals with Electronic-
Records Systems as Compared with Hospitals without Systems.
Hospitals with electronic-records systems include hospitals with
a comprehensive electronic-records system and
those with a basic electronic-records system that includes
functionalities for physicians’ notes and nursing assess-
ments. P<0.01 for all comparisons except physicians’ resistance
(P = 0.20). IT denotes information technology, and
ROI return on investment.
Copyright © 2009 Massachusetts Medical Society. All rights
reserved.
Downloaded from www.nejm.org on February 21, 2010 . For
personal use only. No other uses without permission.
T h e n e w e n g l a n d j o u r n a l o f m e d i c i n e
n engl j med 360;16 nejm.org april 16, 20091636
Whether a hospital that has successfully imple-
mented computerized provider-order entry in one
unit can easily implement in other units and add
clinical-decision support is unclear. Furthermore,
a nonuniform information system within the hos-
pital (paper-based in some units and electronic in
others) may increase clinical hazards as patients
move from one unit to another. Whether the ben-
efits of adoption of an electronic-records system
in some clinical units outweigh the theoretical
hazards posed by uneven adoption within the hos-
pital requires examination.
Respondents identified financial issues as the
predominant barriers to adoption, dwarfing is-
sues such as resistance on the part of physicians.
Other studies have shown that physicians’ resis-
tance, partly driven by concerns about negative
effects of the use of electronic health records on
clinical productivity,17 can be detrimental to adop-
tion efforts.18 Whether our respondents, most of
whom have not adopted electronic health records,
underestimated the challenges of overcoming this
barrier or whether physicians are becoming more
receptive to adoption is unclear. Either way, ob-
taining the support of physicians — often by get-
ting the backing of clinical leaders — can be help-
ful in ensuring successful adoption.19
Another potential barrier to adoption is con-
cern about interoperability: few electronic-records
systems allow for easy exchange of clinical data
between hospitals or from hospitals to physicians’
offices. Low levels of health information exchange
in the marketplace20,21 reduce the potential value
of these systems and may have a dampening ef-
fect on adoption.
From a policy perspective, our data suggest that
rewarding hospitals — especially financially vul-
nerable ones — for using health information tech-
nology may play a central role in a comprehensive
approach to stimulating the spread of hospital
electronic-records systems. Creating incentives for
increasing information-technology staff and har-
monizing information-technology standards and
creating disincentives for not using such technol-
ogy may also be helpful approaches.
Some providers, such as the VHA, have success-
fully implemented electronic-records systems. VHA
hospitals have used electronic health records for
more than a decade with dramatic associated im-
provements in clinical quality.22,23 Their medical
records are nearly wholly electronic, and includ-
ing them in our analyses led to a doubling of our
count of U.S. hospitals with a comprehensive sys-
tem. Some developed countries, such as the United
Kingdom and the Netherlands, have also success-
fully spurred adoption of health information tech-
33p9
100
P
ro
p
o
rt
io
n
o
f
H
o
sp
it
al
s
(%
) 80
90
70
60
40
30
10
50
20
0
Hospitals with EHR Hospitals without EHR
Additional
reimbursement
for HIT use
Financial
incentives for
implementation
Technical
support for
implementation
Facilitators
Objective EHR
evaluation
List of certified
EHRs
AUTHOR:
FIGURE:
JOB:
4-C
H/T
RETAKE
SIZE
ICM
CASE
EMail Line
H/T
Combo
Revised
AUTHOR, PLEASE NOTE:
Figure has been redrawn and type has been reset.
Please check carefully.
REG F
Enon
1st
2nd
3rd
Jha
2 of 2
04-16-09
ARTIST: ts
36016 ISSUE:
Figure 2. Perceived Facilitators of Adoption of Electronic-
Records Systems among Hospitals with Systems
as Compared with Hospitals without Systems.
Hospitals with electronic-records systems include hospitals with
a comprehensive system and those with a basic
system that includes functionalities for physicians’ notes and
nursing assessments. P>0.10 for all comparisons. EHR
denotes electronic health record, and HIT health information
technology.
Copyright © 2009 Massachusetts Medical Society. All rights
reserved.
Downloaded from www.nejm.org on February 21, 2010 . For
personal use only. No other uses without permission.
Use of Elec tronic He a lth R ecor ds in U.S. Hospita l s
n engl j med 360;16 nejm.org april 16, 2009 1637
nology, although most of their progress has been
in ambulatory care. Few countries have yet to make
substantial progress in the inpatient setting.24
There are limitations to our study. First, al-
though we achieved a 63% response rate, the hos-
pitals that did not respond to our survey were
somewhat different from those that did respond.
We attempted to compensate for these differences
by adjusting for potential nonresponse bias, but
such adjustments are imperfect. Given that non-
responding hospitals were more likely to have
characteristics associated with lower levels of
adoption of electronic health records, residual bias
may have led us to overestimate adoption levels.
Second, we focused on adoption and could not ac-
curately gauge the actual use or effectiveness of
electronic-records systems. Third, we did not as-
certain whether the systems that were adopted had
been independently certified (by parties such as
the Certification Commission for Health Informa-
tion Technology). Fourth, given low adoption lev-
els, we had limited power to identify predictors of
the adoption of comprehensive electronic-records
systems as compared with basic systems. Finally,
we did not ascertain whether users of electronic
health records were satisfied with them.
In summary, we examined levels of electronic
health record adoption in U.S. hospitals and found
that very few have a comprehensive electronic sys-
tem for recording clinical information and that
only a small minority have even a basic system.
However, many institutions have parts of an elec-
tronic-records system in place, suggesting that
policy interventions could increase the prevalence
of electronic health records in U.S. hospitals faster
than our low adoption levels might suggest. Criti-
cal strategies for policymakers hoping to promote
the adoption of electronic health records by U.S.
hospitals should focus on financial support, in-
teroperability, and training of information tech-
nology support staff.
Supported by grants from the Office of the National Coordinator
for Health Information Technology in the Department of Health
and Human Services and the Robert Wood Johnson Foundation.
Dr. Jha reports receiving consulting fees from UpToDate; Drs.
Donelan and Rao, receiving grant support from GE Corporate
Healthcare; and Dr. Blumenthal, receiving grant support from
GE Corporate Healthcare, the Macy Foundation, and the Office
of
the National Coordinator for Health Information Technology in
the Department of Health and Human Services and speaking
fees
from the FOJP Service Corporation and serving as an adviser to
the
presidential campaign of Barack Obama. He has been named
Na-
tional Coordinator for Health Information Technology. No other
potential conflict of interest relevant to this article was
reported.
We thank our expert consensus panel for their assistance in
conducting this research and Paola Miralles of the Institute for
Health Policy for assistance in the preparation of an earlier ver-
sion of the manuscript.
References
Smith C, Cowan C, Heffler S, Catlin A. 1.
National health spending in 2004: recent
slowdown led by prescription drug spend-
ing. Health Aff (Millwood) 2006;25:186-
96.
McGlynn EA, Asch SM, Adams J, et al. 2.
The quality of health care delivered to
adults in the United States. N Engl J Med
2003;348:2635-45.
Jha AK, Li Z, Orav EJ, Epstein AM. 3.
Care in U.S. hospitals — the Hospital
Quality Alliance program. N Engl J Med
2005;353:265-74.
Chaudhry B, Wang J, Wu S, et al. Sys-4.
tematic review: impact of health informa-
tion technology on quality, efficiency, and
costs of medical care. Ann Intern Med
2006;144:742-52.
Blumenthal D, Glaser JP. Information 5.
technology comes to medicine. N Engl J
Med 2007;356:2527-34.
Jha A, Ferris T, Donelan K, et al. How 6.
common are electronic health records in
the United States? A summary of the evi-
dence. Health Aff (Millwood) 2006;25:
w496-w507.
Schoen C, Osborn R, Huynh PT, Doty 7.
M, Peugh J, Zapert K. On the front lines of
care: primary care doctors’ office sys-
tems, experiences, and views in seven
countries. Health Aff (Millwood) 2006;
25:w555-w571.
DesRoches CM, Campbell EG, Rao 8.
SR, et al. Electronic health records in am-
bulatory care — a national survey of phy-
sicians. N Engl J Med 2008;359:50-60.
Cutler DM, Feldman NE, Horwitz JR. 9.
U.S. adoption of computerized physician
order entry systems. Health Aff (Millwood)
2005;24:1654-63.
Laschober M, Maxfield M, Lee M, Ko-10.
vac M, Potter F, Felt-Lisk S. Hospital re-
sponses to public reporting of quality data
to CMS: 2005 survey of hospitals. Wash-
ington, DC: Mathematica, October 12,
2005.
Furukawa MF, Raghu TS, Spaulding 11.
TJ, Vinze A. Adoption of health informa-
tion technology for medication safety in
U.S. hospitals, 2006. Health Aff (Millwood)
2008;27:865-75.
Healthcare Information and Manage-12.
ment Systems Society (HIMSS). 2002 Hot
topic survey. Chicago: HIMSS Analytics,
2002.
Forward momentum: hospital use of 13.
information technology. Chicago: Ameri-
can Hospital Association, 2005.
Ash JS, Gorman PN, Seshadri V, Hersh 14.
WR. Computerized physician order entry
in U.S. hospitals: results of a 2002 survey.
J Am Med Inform Assoc 2004;11:95-9.
Key capabilities of an electronic health 15.
record system. Washington, DC: Institute
of Medicine, 2003.
Blumenthal D, DesRoches C, Donelan 16.
K, et al. Health information technology in
the United States: the information base
for progress. Princeton, NJ: Robert Wood
Johnson Foundation, 2006.
Scott JT, Rundall TG, Vogt TM, Hsu J. 17.
Kaiser Permanente’s experience of imple-
menting an electronic medical record:
a qualitative study. BMJ 2005;331:1313-6.
Simon SR, Kaushal R, Cleary PD, et al. 18.
Correlates of electronic health record
adoption in office practices: a statewide
survey. J Am Med Inform Assoc 2007;
14:110-7.
Sequist TD, Cullen T, Hays H, Taualii 19.
MM, Simon SR, Bates DW. Implementa-
tion and use of an electronic health rec-
ord within the Indian Health Service.
J Am Med Inform Assoc 2007;14:191-7.
Copyright © 2009 Massachusetts Medical Society. All rights
reserved.
Downloaded from www.nejm.org on February 21, 2010 . For
personal use only. No other uses without permission.
n engl j med 360;16 nejm.org april 16, 20091638
Use of Elec tronic He a lth R ecor ds in U.S. Hospita l s
Adler-Milstein J, McAfee AP, Bates 20.
DW, Jha AK. The state of regional health
information organizations: current activi-
ties and financing. Health Aff (Millwood)
2008;27:w60-w69.
Adler-Milstein J, Bates DW, Jha AK. 21.
Update on regional health information
organizations: progress but critical work
remains. Health Aff (Millwood) 2009;28:
483-92.
Jha AK, Perlin JB, Kizer KW, Dudley 22.
RA. Effect of the transformation of the
Veterans Affairs health care system on
the quality of care. N Engl J Med 2003;
348:2218-27.
Perlin JB. Transformation of the US 23.
Veterans Health Administration. Health
Econ Policy Law 2006;1(Pt 2):99-105.
Jha AK, Doolan D, Grandt D, Scott T, 24.
Bates DW. The use of health information
technology in seven nations. Int J Med In-
form 2008;77:848-54.
Copyright © 2009 Massachusetts Medical Society.
Copyright © 2009 Massachusetts Medical Society. All rights
reserved.
Downloaded from www.nejm.org on February 21, 2010 . For
personal use only. No other uses without permission.
O r i g i n a l A r t i c l e s
Authors alone are responsible for opinions expressed in the
contribution and for its clearance through
their federal health agency, if required.
M IL IT A R Y M E D IC IN E, 179, 10:1090,2014
P r e d i c t o r s o f A r m y N a t i o n a l G u a r d a n d R e
s e r v e M e m b e r s ’ U s e
o f V e t e r a n H e a l t h A d m in i s t r a t io n H e a l t h
C a r e A f t e r D e m o b ili z in g
F r o m O E F / O I F D e p l o y m e n t
Alex H. S. Harris, PhD*; Cheng Chen, MA*; Beth A. Mohr, M
S f; Rachel Sayko Adams, PhD, M P H f;
Thomas V. Williams, PhD f; Mary Jo Larson, PhD, M P A f
ABSTRACT This study described rates and predictors o f Army
National Guard and Army Reserve members’
enrollment in and utilization of Veteran Health Administration
(VHA) services in the 365 days following demobiliza-
tion from an index deployment. We also explored regional and
VHA facility variation in serving eligible members in
their catchment areas. The sample included 125,434 Army
National Guard and 48,423 Army Reserve members who
demobilized after a deployment ending between FY 2008 and
FY 2011. Demographic, geographic, deployment,
and Military Health System eligibility were derived from
Defense Enrollment Eligibility Reporting System and
“Contingency Tracking System” data. The VHA National
Patient Care Databases were used to ascertain VHA utiliza-
tion and status (e.g., enrollee, TRICARE). Logistic regression
models were used to evaluate predictors o f VHA
utilization as an enrollee in the year following demobilization.
Of the study members demobilizing during the observa-
tion period, 56.9% of Army National Guard members and 45.7%
of Army Reserve members utilized VHA as an
enrollee within 12 months. Demographic, regional, health
coverage, and deployment-related factors were associated
with VHA enrollment and utilization, and significant variation
by VHA facility was found. These findings can be useful
in the design of specific outreach efforts to improve linkage
from the Military Health System to the VHA.
INTRODUCTION
Since September 11, 2001, more than 2.2 million members
of the U.S. Armed Forces have served in the Operation
Enduring Freedom (OEF) in Afghanistan and Operation Iraqi
Freedom (OIF) in Iraq.1 The length and intensity of these
operations, repeat deployments, as well as advancements in
battlefield medicine, and increases in military members sur-
*Center for Innovation to Implementation (MPD: 152), Veterans
Affairs
Palo Alto Health Care System, 795 Willow Road, Menlo Park,
CA 94025.
t Institute for Behavioral Health, Heller School for Social
Policy and Man-
agement, Brandeis University, 415 South Street, Waltham, MA
02454-9110.
^Methods, Measures, and Analyses, Defense Health Cost
Assessment
and Program Evaluation, Department of Defense, Defense
Health Agency,
7700 Arlington Boulevard, Suite 5101, Falls Church, VA
22042-5101.
This research has been conducted in compliance with all
applicable
federal regulations governing the protection of human subjects.
Dr. Thomas
V. Williams and Dr. Diana D. Jeffery are the DHA/DOD
Government Pro-
ject Managers.
The opinions and assertions herein are those of the authors and
do not
necessarily reflect the view of the U.S. Department of Defense,
Veterans
Health Administration, or National Institutes of Health,
doi: 10.7205/MILMED-D-13-00521
viving with serious injuries, including traumatic brain injury,
have placed tremendous demands on returning warriors, their
families, and the health care systems of the Department
of Defense (DoD) and Veterans Health Administration
(VHA).2-5 Additionally, many service members return from
deployments with ongoing psychological health problems,
including post-traumatic stress disorder, depression, and sub-
stance use problems.6-10
Of the military members deployed to Iraq and Afghanistan
as of 2010, roughly half have been members of the Army;
with the Reserve Component (RC), specifically Army
National Guard (ARNG) and Army Reservists (AR), com-
prising almost 44% of Army deployments.1 RC members
receiving orders to deploy and activating under Title 10
authority are offered TRICARE health insurance coverage
and free health care through the Military Health System
(MHS) operated by the DoD, although co-pays may be
required for services obtained outside the MHS. On return
from deployment, RC members go through a requirement-
based demobilization process that is designed to ensure that
they get the services and assistance they need, including
1090 M ILITARY M ED ICIN E, Vol. 179, October 2014
Predictors o f Army National Guard and Reserve Members
Linkage to the VHA
medical, dental, and behavioral health assessments, assis-
tance in areas of identified need (e.g., vocational, finan-
cial, personal), offered time-limited MHS insurance (e.g.,
TRICARE Reserve Select), and information about their
rights and benefits including those provided by VHA.
Combat veterans include members who served on active
duty in an area of combat operations after 1998 and who were
discharged under other than dishonorable conditions. The
National Defense Authorization Act of 2008 (Public Law
110-181) entitles all combat veterans, including those in the
RC, who meet minimum duty requirements up to 5 years of at
least VHA Priority Group 6 status, which includes full access
to VHA’s medical benefits package and free VHA services
for conditions potentially related to service in a war zone. To
rationalize the allocation of resources, VHA has established
Priority Groups that are determined primarily by a member’s
degree of service-related injury or disability, income, and
other service characteristics (http://www.va.gov/healthbenefits/
resources/priority_groups.asp).
This study examines rates and predictors of RC members’
enrollment and utilization of VHA services through this
entitlement. RC members are eligible to enroll in VHA
immediately after demobilization, but regular Army mem-
bers cannot enroll in the VHA until they are discharged from
military service, often years after deployments. Therefore,
RC members, the focus of this study, must be considered
separately from regular Army in understanding the predictors
and timing of VHA enrollment and utilization.
As with other transitions or hand offs in health care, the
transition from the DoD to civilian life and potential utiliza-
tion of VHA services is fraught with threats to continuity of
care. Although “seamless transitions” between the DoD and
VHA remain the stated goal, many factors continue to con-
tribute to suboptimal communication and care coordination
between the two systems, including challenges of sharing
medial record information, long wait times for determination
of benefits, and geographic accessibility.1112
As a heterogeneous group, demobilized RC members may
or may not return to civilian employment, regain private health
insurance, or receive medical care through private programs.
Some RC members enroll for and receive services from VHA
as soon as they are eligible and others do not make the transi-
tion. Some members who do not enroll for and receive VHA
services have simply chosen other good options for their health
care needs. However, other members do not engage with the
VHA system for less positive reasons including lack of knowl-
edge of benefits, frustration with the enrollment process, and
perceptions of low-quality care.5,13,14 Also, stigma exists
among combat veterans regarding treatment seeking in gen-
eral, particularly for mental health problems.15-17
Few studies have examined transitions from the DoD to
VHA for OEF/OIF service members, and none have focused
specifically on RC members. Copeland et al18 examined 994
service members (Active Duty, Guard, and Reserve) who
were traumatically injured and medically discharged from
one inpatient DoD trauma treatment facility. The service
members were followed to determine the rate, predictors,
and patterns of subsequent VHA utilization, even though not
all were discharged from the military. From this sample, 23%
used VHA services as an enrollee in the 2-year observation
period. Members wounded in action had longer transition
times to VHA, whereas those with bums had shorter transi-
tion times. These data are difficult to interpret because not all
members of the sample had been discharged from the mili-
tary and therefore might not have been eligible for VHA
services as an enrollee.
In another study, Randall13 determined that the length of
time to obtain VHA services at two VHA Medical Centers for
376 OEF/OIF combat service members who left active ser-
vice averaged 3.8 months. Respondents were from all
branches and cited several factors that impeded them from
enrolling in VHA sooner, including not knowing about bene-
fits, distance and transportation barriers, viewing help-seeking
as a sign of weakness, and negative perceptions about the
quality of care provided in VHA. Because all service members
of the sample received VHA services, predictors of linkage to
the VHA could not be examined.
The VHA Office of Public Health reported that between
October 2001 and December 2012, 56% (n = 899,752) of the
more than 1.6 million OEF/OIF/Operation New Dawn com-
bat veterans from all branches of the military who became
eligible for VHA services eventually enrolled for and utilized
VHA services.19 Of these, 688,414 were RC members of
whom 55% utilized VHA services.19 However, little is known
about the individual, geographic, or system factors that predict
transitions from DoD to VHA care among RC members. Data
on the predictors and locations of poor linkage are essential to
the effective design and targeting of outreach and quality
improvement efforts.
Thus, the purpose of this study of RC members was to
describe rates and predictors of any utilization as an enrollee
of VHA health care in the 365 days after the demobilization
date following an index deployment ending in FY 2008-FY
2011. Although prior studies have estimated that on average
half of eligible veterans eventually make use of VHA ser-
vices,19'20 the present study’s ability to track a large cohort of
returning RC members and to examine predictors of linkage to
the VHA within 1 year of their demobilization from deploy-
ment is unique. Further, we explored regional and VHA facil-
ity variability in enrolling and serving eligible veterans in their
catchment areas. Information about patient and facility-level
characteristics associated with linkage to the VHA after demo-
bilization can be used by the DoD and VHA to develop quality
improvement efforts to design organizations and systems of
care more likely to increase linkage to VHA facilities among
returning OEF/OIF combat veterans.
METHODS
This study was part of the Substance Use and Psychological
Injury Combat study (SUPIC), a longitudinal, observational
MILITARY MEDICINE, Vol. 179, October 2014 1091
Predictors o f Army National Guard and Reserve Members
Linkage to the VHA
study of Army service members returning from deployment,
funded by the National Institute on Drug Abuse and con-
ducted with the sponsorship from the Defense Health
Agency/DoD. SUPIC is designed to study postdeployment
health outcomes among Army members utilizing merged
administrative data systems of the DoD and VHA. The
SUPIC cohort is inclusive of Active Duty and RC members,
but analyses are stratified by these components, and this
study focuses only on those in the RCs. This study uses a
prospective design to examine one key outcome associated
with OEF/OIF deployment, successful linkage to the VHA
to receive entitlement health care services after demobiliza-
tion. Members who demobilize from a combat deployment
became eligible to enroll for VHA under Public Law 110-
181, the National Defense Authorization Act for Fiscal Year
2008 and previous authorizations.
S tu d y S e t tin g
VHA is composed of over 1,700 sites of care, hierarchically
organized into 140 major facilities in 21 Veterans Integrated
Service Networks. VHA serves over 6 million veterans each
year through integrated and comprehensive outpatient, resi-
dential, and inpatient services, including specialized pro-
grams for a host of issues of particular concern for Veterans
(http://www.va.gov/health/programs/index.asp). Members of
the RC become eligible to enroll after a qualifying index
deployment (i.e., called to service by federal order, served
the entire period of the order, released under Honorable or
General Under Honorable conditions). Unlike other VHA
utilization studies, SUPIC prospectively identifies a complete
VHA eligible population by selecting a cohort through DoD
records. The SUPIC deployment cohort is tracked longitudi-
nally to observe VHA enrollment, and utilization as an
enrollee, in one of the VHA facilities in the United States.
S a m p le
As a part of SUPIC, this study used the Defense Enrollment
Eligibility Reporting System, within the MHS Data Reposi-
tory, and the Contingency Tracking System of the Defense
Manpower Data Center to identify RC members who had
deployed to OEF/OIF countries (Iraq, Afghanistan, Qatar,
and Kuwait), and who had demobilization dates associated
with an index deployment end date between October 1, 2007
and September 30, 2011 (FY 2008-FY 2011). Among the
one-third of members who had multiple deployments during
the observation period, we chose an index deployment by
selecting the first deployment ending in the study window
that could be matched to a completed postdeployment health
assessment (PDHA), or the first deployment ending in the
study window for those without a completed PDHA. Service
members were excluded if their deployments did not include
OEF/OIF countries. Additional details about the sample
development, matching of PDHAs to deployments, and selec-
tion of the index deployment are described in detail else-
where.21 To be included in the analysis of linkage to a
particular VHA facility, we further restricted the sample to
those with a valid postdemobilization civilian zip code in the
United States.
O u tc o m e
The outcome for this study was the receipt of any outpatient,
inpatient, or residential care from a VHA facility as an
enrollee (i.e., not TRICARE or other sharing arrangement)
at least once during the 365 days after the index demobiliza-
tion date. We identified this utilization using the VHA admin-
istrative data including the VHA Enrollment File and
National Patient Care Databases.
P r e d ic t o r V a ria b le s
Deployment record information was derived from the Con-
tingency Tracking System and demographic characteristics at
the start and end of deployment and demobilization dates
were derived from the Defense Enrollment Eligibility
Reporting System. The following variables (measured at start
of index deployment unless indicated) were used as predic-
tors of postdemobilization VHA utilization: age, gender,
probable serious injury during deployment (defined as receiv-
ing inpatient services within a major MHS hospital after
deployment), deployment again in the postindex year, postde-
ployment enrollment DoD provided health insurance (i.e.,
PRIME/TRICARE Reserve Select (TRS)) in the postindex
year, number of deployments before the index deployment,
length of index deployment in months, rank, race, marital
status, region of residence at demobilization, and fiscal year
of deployment end date (FY 2008-FY 2011). Other predictors
derived from the VA Enrollment File and National Patient
Care databases were pre- and postindex deployment VHA
utilization as a nonenrollee (e.g., TRICARE) and preindex
deployment VHA utilization as an enrollee (presumably eligi-
ble through demobilization from a previous deployment or
active duty discharge). Driving time of the members’
postdemobilization residential zip code to the nearest VHA
facility with primary care services was determined from the
VHA Planning System Support group data. VHA Planning
System Support Group data provide driving times for VHA
patients within each 5-digit zip code to the nearest VHA facil-
ity with primary care services. Because postdemobilization zip
codes for the entire sample were at the 3-digit level, we
assigned the median driving time from distribution of VHA
patients in the underlying 5-digit zip codes to all individuals in
the sample with the same 3-digit stem.
S ta tis t ic a l A n a ly s e s
Mixed-effects logistic regression models were used to predict
VHA utilization as an enrollee in the 365 days following the
date of demobilization from the index deployment, with a
random effect for VHA facility (N = 140) to account for
the clustering of members within a facility. All candidate
1092 MILITARY MEDICINE, Vol. 179, October 2014
Predictors o f Army National Guard and Reserve Members
Linkage to the VHA
predictors were included and regression diagnostics, particu-
larly examination of variance inflation factors, were performed.
For continuous variables such as age, assumptions regarding
linearity were evaluated and found to be reasonable. Analyses
were stratified by com ponent (i.e., ARNG and AR) because of
the presence of significant interaction terms. Because o f the
large size o f the sample, we emphasize the magnitude and
confidence intervals o f effects rather than p values.
Describing VHA Facility-Level Variation in “Yield”
From the Local Population
To explore VHA facility-level variation in enrollm ent and
utilization o f VHA services, we assigned each m em ber in
the sample to one o f the 140 major VHA facilities with the
shortest drive time by the abovem entioned method. Note
that all o f VHA medical centers, clinics, and other settings
of care are organized into one o f these 140 organizational
units. This is the level o f aggregation that is used for most
system m onitoring and perform ance m easurement. Then,
using the m ultivariate m ixed-effects regression models
predicting utilization and controlling for other individual
characteristics, we estim ated the proportion (95% confidence
interval [Cl]) o f mem bers in each VHA facility’s catchment
area that received VHA services as an enrollee. The purpose
o f these analyses is to describe variation in facility-level
yield from the local population o f eligible veterans, and to
identify high and low outliers.
Protection of Human Subjects and Data Security
To ensure protection o f human subjects, Brandeis University’s
Com m ittee for Protection o f Human Subjects, the Insti-
tutional Review Boards o f the Stanford University and
T A B L E I. Characteristics of ARNG (N = 125,434) and Army
Reserve Members (N = 48,423), Returning from Deployment FY
2008-
FY 2011
Characteristic" National Guard N (%) Reserve N (%)
Female 10,887 (8.68) 7,316(15.11)
Married 63,422 (50.56) 63,422 (50.56)
Race/Ethnicity
Non-Hispanic White 95,155 (75.86) 95,155 (75.86)
Non-Hispanic African-American 14,877 (11.86) 14,877 (11.86)
Hispanic 9,963 (7.94) 9,963 (7.94)
Asian or Pacific Islander 3,358 (2.68) 3,358 (2.68)
American Indian/Alaskan Native 1,235 (0.98) 1,235 (0.98)
Other 846 (0.67) 846 (0.67)
Received Preindex6 VHA Services as Enrollee 35,939 (28.65)
35,939 (28.65)
Received Preindex VHA Services as Nonenrollee 11,708 (9.33)
11,708 (9.33)
Received Postindex VHA Services as Nonenrollee 4,583 (3.65)
4,583 (3.65)
Probable Serious Injury During Index Deployment 4,856 (3.87)
4,856 (3.87)
Redeployed in the Postindex Year 2,411 (1.92) 2,411 (1.92)
PRIME/TRSC After Index Deployment 50,364(40.15)
50,364(40.15)
Rank
Enlisted, Junior 67,173 (53.55) 67,173 (53.55)
Enlisted, Senior 45,773 (36.49) 45,773 (36.49)
Officer, Junior 7,591 (6.05) 7,591 (6.05)
Officer, Senior 2,800 (2.23) 2,800 (2.23)
Warrant Officer 2,097(1.67) 2,097 (1.67)
Residence Region at Demobilization
West 18,429(14.69) 18,429(14.69)
Midwest 31,870(25.41) 31,870 (25.41)
Northeast 21,029 (16.76) 21,029(16.76)
South 54,106 (43.14) 54,106 (43.14)
Cohortrf
2008 54,106 (43.14) 8,231 (17.00)
2009 54,106(43.14) 11,531 (23.81)
2010 17,831 (14.22) 15,625 (32.27)
2011 27,723 (22.10) 13,036 (26.92)
Mean (SD) Mean (SD)
Age in Years 8,231 (17.00) 8,231 (17.00)
Number of Deployments Before Index Deployment 11,531
(23.81) 11,531 (23.81)
Length of Index Deployment in Months 15,625 (32.27) 15,625
(32.27)
Drive Time (Minutes) to Nearest VHA Facility 13,036 (26.92)
13,036 (26.92)
“Measured at start o f index deployment unless indicated.
'’Index refers to a deployment ending in FY 2008-FY 2011 and
selected for analysis. “DoD provided
health insurance. “'Cohort refers to fiscal year of index
deployment end date.
MILITARY MEDICINE, Vol. 179, October 2014 1093
Predictors o f Army National Guard and Reserve Members
Linkage to the VHA
T A B L E II. Predictors of VHA Utilization as an Enrollee in
the 365 days Postdemobilization for 48,423 National Reserve
Members and
125,434 National Guard Members
Parameter" National Reserve OR* (95% Cl) National Guard
OR* (95% Cl)
Age in Years 1.011 (1.008, 1.014) 1.020(1.018. 1.022)
Female 1.329(1.258, 1.404) 1.241 (1.188, 1.296)
Preindex" VHA Services as Enrollee 4.210 (4.002,4.430) 2.737
(2.656, 2.820)
Preindex VHA Services as Nonenrollee 1.558 (1.465, 1.656)
1.706(1.627, 1.788)
Postindex VHA Services as Nonenrollee 2.096 (1.876,2.341)
1.857(1.727, 1.996)
Probable Serious Injury During Index Deployment
1.282(1.159,1.417) 1.103 (1.033, 1.178)
Deployed Again in the Postindex Year 0.574 (0.512,0.643)
0.604 (0.553, 0.659)
PRIME/TRS^ Enrollment in the Postindex Year 0.963 (0.924,
1.005) 1.033 (1.006, 1.060)
Number o f Deployments Before Index Deployment 0.809
(0.784, 0.834) 0.853 (0.835,0.872)
Length of Index Deployment in Months 1.012(1.006, 1.018)
1.014 (1.010, 1.019)
Drive Time (Minutes) to Nearest VHA Facility 0.997
(0.995,1.000) 0.997 (0.996, 0.999)
Rank (Junior Enlisted as Reference)
Enlisted, Senior 0.778 (0.738, 0.820) 0.797 (0.771,0.823)
Officer, Junior 0.581 (0.536, 0.629) 0.575 (0.545,0.606)
Officer, Senior 0.481 (0.437,0.528) 0.471 (0.431,0.514)
Warrant Officer 0.620 (0.525,0.733) 0.597 (0.542,0.658)
Race (Non-Hispanic White Reference)
American Indian/Alaskan Native 0.947 (0.776,1.156) 0.854
(0.755, 0.966)
Asian or Pacific Islander 0.959 (0.865, 1.063) 1.040(0.960,
1.126)
Non-Hispanic African-American 1.092(1.030, 1.157)
1.103(1.061, 1.148)
Hispanic 1.115(1.040, 1.195) 1.063 (1.008, 1.121)
Other 0.906 (0.695,1.182) 1.004(0.868, 1.162)
Married 0.962 (0.922, 1.005) 1.012(0.986, 1.037)
Residence Region at Demobilization (West Reference)
Midwest 1.162 (0.987,1.369) 1.337 (1.107,1.616)
Northeast 1.007 (0.843, 1.204) 1.107 (0.866, 1.383)
South 0.981 (0.843, 1.142) 1.336(1.116, 1.599)
Cohort" (2008 Reference)
2009 1.193 (1.121,1.269) 1.104(1.057,1.152)
2010 1.023 (0.964, 1.086) 0.935 (0.899, 0.973)
2011 0.900 (0.847, 0.957) 0.767 (0.735,0.801)
"Measured at start of index deployment unless indicated.
^Adjusted for all characteristics shown. "Index refers to a
deployment ending in FY 2008-FY 2011
and selected for analysis. *DoD provided health insurance.
"Cohort refers to fiscal year of index deployment end date.
the VA Palo Alto Health Care System, and the Human
Research Protection Program at the Office of the Assistant
Secretary of Defense for Health Affairs/Defense Health
Agency granted approval. The Defense Health Agency Pri-
vacy and Civil Liberties Office executed an annual data shar-
ing agreement.
RESULTS
Descriptive statistics for the samples are presented in Table I.
Of the 125,434 ARNG members who demobilized during the
observation period and met other eligibility criteria, 71,322
(56.9%) utilized VHA as an enrollee within 12 months of
their index demobilization date. Table II presents regression
results for predictors of ARNG members’ VHA utilization
as an enrollee. These results may be helpful in targeting
and shaping enrollment efforts for increase enrollment and
utilization of VHA services. Significant positive predictors
were older age; female gender; receiving VHA services as
an enrollee before the index deployment; receiving VHA
services as a nonenrollee (e.g., TRICARE) before the index
deployment; receiving VHA services as a nonenrollee (e.g.,
TRICARE) in the year after the index deployment; probable
serious deployment-related injury; DoD provided health
insurance (TRS or PRIME) selection or enrollment in the
postindex year; length of index deployment; being Asian/
Pacific Islander, Hispanic, African-American, or “other”
race/ethnicity compared to non-Hispanic white; residence
after demobilization in the Midwest or South compared to
the West region; and being a member of the FY 2009 cohort
compared to the FY 2008 cohort.
Significant negative predictors of ARNG members VHA
utilization as an enrollee were deployment again in the
postdemobilization year, number of deployments before
index deployment; drive time to nearest VHA facility; rank
of Senior Enlisted, Junior Officer, Senior Officer or Warrant
Officer compared to Junior Enlisted; being American Indian/
Alaskan native; and demobilization in 2010-2011 compared
to 2008.
Of the 48,423 AR members who demobilized, 22,118
(45.7%) utilized VHA as an enrollee within 12 months of
the index demobilization date. Table II presents regression
results for predictors of AR members’ VHA utilization as an
enrollee. Similar to ARNG, significant positive predictors
1094 MILITARY MEDICINE, Vol. 179, October 2014
Predictors o f Army National Guard and Reserve Members
Linkage to the VHA
Utilization of VHA Services as an Enrollee by National Guard
Members in the
Catchment Areas of 140 VHA Facilities
FIG UR E 1. Percent of National Guard Members with any VHA
utilization as an enrollee in a VHA facility catchment area.
Utilization measured in the
year following member’s return from a FY 2008-FY 2011
deployment. Adjusted for characteristics shown in Table II.
were older age, female gender, receiving VHA services as an
enrollee before the index deployment, receiving VHA ser-
vices as a nonenrollee (e.g., TRICARE) before the index
deployment, receiving VHA services as a nonenrollee in the
year after the index deployment, probable serious deployment-
related injury, DoD provided health insurance (TRS or
PRIME) selection or enrollment in the postindex year, length
of index deployment, being Hispanic or African-American
compared to non-Hispanic White, residence in the Midwest or
South compared to the West region, and being a member of the
FY 2009 cohort compared to the FY 2008 cohort.
Significant negative predictors of Army Reserve Members
VHA utilization as an enrollee were deployment again in the
postdemobilization year; number of deployments before index
deployment; longer drive time to the nearest VHA facility;
rank of Senior Enlisted, Junior Office, Senior Officer or War-
rant Officer compared to Junior Enlisted; being an American
Indian or Alaskan Native compared to non-Hispanic White;
and demobilization in 2010-2011 compared to 2008.
The percent (95% Cl) of ARNG and AR members in
each VHA facility’s catchment area who received any VHA
services as an enrollee are presented in Figures 1 and 2,
respectively. The results are adjusted for the characteristics
shown in Table II. As can be seen, substantial variation exists
(as well as variation in the Cl widths driven by differences in
the underlying sample sizes). For ARNG members, facility-
level utilization in the year following the index deployment
ranged from 31% to 89%. For AR members facility-level
utilization ranged from 27% to 81%. The percents for facili-
ties with nonoverlapping C l’s are significantly different.
DISCUSSION
This descriptive analysis found that 56.9% of ARNG and
45.7% of AR members utilized VHA services as an enrollee
within 365 days of demobilization from an index deployment
to Iraq or Afghanistan. This implies that if linkage to the
VHA does occur, most of it will occur within the first year
of return from deployment. We plan future analysis to follow
this cohort up to 3 years from deployment to determine if
linkage is delayed for some members, and if so, what charac-
teristics are associated with delayed linkage. Perhaps the most
PSYCHIATRIC SERVICES ♦ March 2002   Vol. 53   No. 3 229933.docx

More Related Content

Similar to PSYCHIATRIC SERVICES ♦ March 2002 Vol. 53 No. 3 229933.docx

1. Describe the role of finance in the healthcare system. The .docx
1. Describe the role of finance in the healthcare system. The .docx1. Describe the role of finance in the healthcare system. The .docx
1. Describe the role of finance in the healthcare system. The .docxjeremylockett77
 
Coaching employees-to-better-health
Coaching employees-to-better-healthCoaching employees-to-better-health
Coaching employees-to-better-healthGianmarco Brunetti
 
DQ 3-2Integrated health care delivery systems (IDS) was develope.docx
DQ 3-2Integrated health care delivery systems (IDS) was develope.docxDQ 3-2Integrated health care delivery systems (IDS) was develope.docx
DQ 3-2Integrated health care delivery systems (IDS) was develope.docxelinoraudley582231
 
Data Analysis ....Stepping Towards Achieving Universal Health Coverage(UHC) b...
Data Analysis ....Stepping Towards Achieving Universal Health Coverage(UHC) b...Data Analysis ....Stepping Towards Achieving Universal Health Coverage(UHC) b...
Data Analysis ....Stepping Towards Achieving Universal Health Coverage(UHC) b...Nazmulislambappy
 
How to Use HIT for CCM
How to Use HIT for CCMHow to Use HIT for CCM
How to Use HIT for CCMPhytel
 
Healthcare administrator
Healthcare administratorHealthcare administrator
Healthcare administratorModupe Sarratt
 
Three Analytics Strategies to Drive Patient-Centered Care
Three Analytics Strategies to Drive Patient-Centered CareThree Analytics Strategies to Drive Patient-Centered Care
Three Analytics Strategies to Drive Patient-Centered CareHealth Catalyst
 
Towards A Holistic Healthcare Ecosystem
Towards A Holistic Healthcare EcosystemTowards A Holistic Healthcare Ecosystem
Towards A Holistic Healthcare EcosystemProductNation/iSPIRT
 
Importance of Population Health Management
Importance of Population Health ManagementImportance of Population Health Management
Importance of Population Health ManagementNous Infosystems
 
Patient Centered Medical home talk at WVU
Patient Centered Medical home talk at WVUPatient Centered Medical home talk at WVU
Patient Centered Medical home talk at WVUPaul Grundy
 
Population health management real time state-of-health analysis
Population health management real time state-of-health analysisPopulation health management real time state-of-health analysis
Population health management real time state-of-health analysispscisolutions
 
The Important Role of Population Health Management in Enhancing Healthcare | ...
The Important Role of Population Health Management in Enhancing Healthcare | ...The Important Role of Population Health Management in Enhancing Healthcare | ...
The Important Role of Population Health Management in Enhancing Healthcare | ...Enterprise Wired
 
Impact of Telephone-Based Chronic Disease Program on Medical Expenditures_Pop...
Impact of Telephone-Based Chronic Disease Program on Medical Expenditures_Pop...Impact of Telephone-Based Chronic Disease Program on Medical Expenditures_Pop...
Impact of Telephone-Based Chronic Disease Program on Medical Expenditures_Pop...David Cook
 
Break-out session slides Session 1: 1.1 Population health management in pract...
Break-out session slides Session 1: 1.1 Population health management in pract...Break-out session slides Session 1: 1.1 Population health management in pract...
Break-out session slides Session 1: 1.1 Population health management in pract...NHS England
 
RACs, MACs and MICs
RACs, MACs and MICsRACs, MACs and MICs
RACs, MACs and MICsSelectData
 

Similar to PSYCHIATRIC SERVICES ♦ March 2002 Vol. 53 No. 3 229933.docx (20)

MiPCT
MiPCTMiPCT
MiPCT
 
1. Describe the role of finance in the healthcare system. The .docx
1. Describe the role of finance in the healthcare system. The .docx1. Describe the role of finance in the healthcare system. The .docx
1. Describe the role of finance in the healthcare system. The .docx
 
Health Reform in 2013
Health Reform in 2013Health Reform in 2013
Health Reform in 2013
 
Coaching employees-to-better-health
Coaching employees-to-better-healthCoaching employees-to-better-health
Coaching employees-to-better-health
 
DQ 3-2Integrated health care delivery systems (IDS) was develope.docx
DQ 3-2Integrated health care delivery systems (IDS) was develope.docxDQ 3-2Integrated health care delivery systems (IDS) was develope.docx
DQ 3-2Integrated health care delivery systems (IDS) was develope.docx
 
Data Analysis ....Stepping Towards Achieving Universal Health Coverage(UHC) b...
Data Analysis ....Stepping Towards Achieving Universal Health Coverage(UHC) b...Data Analysis ....Stepping Towards Achieving Universal Health Coverage(UHC) b...
Data Analysis ....Stepping Towards Achieving Universal Health Coverage(UHC) b...
 
How to Use HIT for CCM
How to Use HIT for CCMHow to Use HIT for CCM
How to Use HIT for CCM
 
Healthcare administrator
Healthcare administratorHealthcare administrator
Healthcare administrator
 
Three Analytics Strategies to Drive Patient-Centered Care
Three Analytics Strategies to Drive Patient-Centered CareThree Analytics Strategies to Drive Patient-Centered Care
Three Analytics Strategies to Drive Patient-Centered Care
 
Towards A Holistic Healthcare Ecosystem
Towards A Holistic Healthcare EcosystemTowards A Holistic Healthcare Ecosystem
Towards A Holistic Healthcare Ecosystem
 
Importance of Population Health Management
Importance of Population Health ManagementImportance of Population Health Management
Importance of Population Health Management
 
Chapter 8 Slides.pptx
Chapter 8 Slides.pptxChapter 8 Slides.pptx
Chapter 8 Slides.pptx
 
Patient Centered Medical home talk at WVU
Patient Centered Medical home talk at WVUPatient Centered Medical home talk at WVU
Patient Centered Medical home talk at WVU
 
Population health management real time state-of-health analysis
Population health management real time state-of-health analysisPopulation health management real time state-of-health analysis
Population health management real time state-of-health analysis
 
Comorbilidades
ComorbilidadesComorbilidades
Comorbilidades
 
The Important Role of Population Health Management in Enhancing Healthcare | ...
The Important Role of Population Health Management in Enhancing Healthcare | ...The Important Role of Population Health Management in Enhancing Healthcare | ...
The Important Role of Population Health Management in Enhancing Healthcare | ...
 
Catasys Corporate Presentation
Catasys Corporate PresentationCatasys Corporate Presentation
Catasys Corporate Presentation
 
Impact of Telephone-Based Chronic Disease Program on Medical Expenditures_Pop...
Impact of Telephone-Based Chronic Disease Program on Medical Expenditures_Pop...Impact of Telephone-Based Chronic Disease Program on Medical Expenditures_Pop...
Impact of Telephone-Based Chronic Disease Program on Medical Expenditures_Pop...
 
Break-out session slides Session 1: 1.1 Population health management in pract...
Break-out session slides Session 1: 1.1 Population health management in pract...Break-out session slides Session 1: 1.1 Population health management in pract...
Break-out session slides Session 1: 1.1 Population health management in pract...
 
RACs, MACs and MICs
RACs, MACs and MICsRACs, MACs and MICs
RACs, MACs and MICs
 

More from amrit47

APA, The assignment require a contemporary approach addressing Race,.docx
APA, The assignment require a contemporary approach addressing Race,.docxAPA, The assignment require a contemporary approach addressing Race,.docx
APA, The assignment require a contemporary approach addressing Race,.docxamrit47
 
APA style and all questions answered ( no min page requirements) .docx
APA style and all questions answered ( no min page requirements) .docxAPA style and all questions answered ( no min page requirements) .docx
APA style and all questions answered ( no min page requirements) .docxamrit47
 
Apa format1-2 paragraphsreferences It is often said th.docx
Apa format1-2 paragraphsreferences It is often said th.docxApa format1-2 paragraphsreferences It is often said th.docx
Apa format1-2 paragraphsreferences It is often said th.docxamrit47
 
APA format2-3 pages, double-spaced1. Choose a speech to review. It.docx
APA format2-3 pages, double-spaced1. Choose a speech to review. It.docxAPA format2-3 pages, double-spaced1. Choose a speech to review. It.docx
APA format2-3 pages, double-spaced1. Choose a speech to review. It.docxamrit47
 
APA format  httpsapastyle.apa.orghttpsowl.purd.docx
APA format     httpsapastyle.apa.orghttpsowl.purd.docxAPA format     httpsapastyle.apa.orghttpsowl.purd.docx
APA format  httpsapastyle.apa.orghttpsowl.purd.docxamrit47
 
APA format2-3 pages, double-spaced1. Choose a speech to review. .docx
APA format2-3 pages, double-spaced1. Choose a speech to review. .docxAPA format2-3 pages, double-spaced1. Choose a speech to review. .docx
APA format2-3 pages, double-spaced1. Choose a speech to review. .docxamrit47
 
APA Formatting AssignmentUse the information below to create.docx
APA Formatting AssignmentUse the information below to create.docxAPA Formatting AssignmentUse the information below to create.docx
APA Formatting AssignmentUse the information below to create.docxamrit47
 
APA style300 words10 maximum plagiarism  Mrs. Smith was.docx
APA style300 words10 maximum plagiarism  Mrs. Smith was.docxAPA style300 words10 maximum plagiarism  Mrs. Smith was.docx
APA style300 words10 maximum plagiarism  Mrs. Smith was.docxamrit47
 
APA format1. What are the three most important takeawayslessons.docx
APA format1. What are the three most important takeawayslessons.docxAPA format1. What are the three most important takeawayslessons.docx
APA format1. What are the three most important takeawayslessons.docxamrit47
 
APA General Format Summary APA (American Psychological.docx
APA General Format Summary APA (American Psychological.docxAPA General Format Summary APA (American Psychological.docx
APA General Format Summary APA (American Psychological.docxamrit47
 
Appearance When I watched the video of myself, I felt that my b.docx
Appearance When I watched the video of myself, I felt that my b.docxAppearance When I watched the video of myself, I felt that my b.docx
Appearance When I watched the video of myself, I felt that my b.docxamrit47
 
apa format1-2 paragraphsreferencesFor this week’s .docx
apa format1-2 paragraphsreferencesFor this week’s .docxapa format1-2 paragraphsreferencesFor this week’s .docx
apa format1-2 paragraphsreferencesFor this week’s .docxamrit47
 
APA Format, with 2 references for each question and an assignment..docx
APA Format, with 2 references for each question and an assignment..docxAPA Format, with 2 references for each question and an assignment..docx
APA Format, with 2 references for each question and an assignment..docxamrit47
 
APA-formatted 8-10 page research paper which examines the potential .docx
APA-formatted 8-10 page research paper which examines the potential .docxAPA-formatted 8-10 page research paper which examines the potential .docx
APA-formatted 8-10 page research paper which examines the potential .docxamrit47
 
APA    STYLE 1.Define the terms multiple disabilities and .docx
APA    STYLE 1.Define the terms multiple disabilities and .docxAPA    STYLE 1.Define the terms multiple disabilities and .docx
APA    STYLE 1.Define the terms multiple disabilities and .docxamrit47
 
APA STYLE  follow this textbook answer should be summarize for t.docx
APA STYLE  follow this textbook answer should be summarize for t.docxAPA STYLE  follow this textbook answer should be summarize for t.docx
APA STYLE  follow this textbook answer should be summarize for t.docxamrit47
 
APA7Page length 3-4, including Title Page and Reference Pag.docx
APA7Page length 3-4, including Title Page and Reference Pag.docxAPA7Page length 3-4, including Title Page and Reference Pag.docx
APA7Page length 3-4, including Title Page and Reference Pag.docxamrit47
 
APA format, 2 pagesThree general sections 1. an article s.docx
APA format, 2 pagesThree general sections 1. an article s.docxAPA format, 2 pagesThree general sections 1. an article s.docx
APA format, 2 pagesThree general sections 1. an article s.docxamrit47
 
APA Style with minimum of 450 words, with annotations, quotation.docx
APA Style with minimum of 450 words, with annotations, quotation.docxAPA Style with minimum of 450 words, with annotations, quotation.docx
APA Style with minimum of 450 words, with annotations, quotation.docxamrit47
 
APA FORMAT1.  What are the three most important takeawayslesson.docx
APA FORMAT1.  What are the three most important takeawayslesson.docxAPA FORMAT1.  What are the three most important takeawayslesson.docx
APA FORMAT1.  What are the three most important takeawayslesson.docxamrit47
 

More from amrit47 (20)

APA, The assignment require a contemporary approach addressing Race,.docx
APA, The assignment require a contemporary approach addressing Race,.docxAPA, The assignment require a contemporary approach addressing Race,.docx
APA, The assignment require a contemporary approach addressing Race,.docx
 
APA style and all questions answered ( no min page requirements) .docx
APA style and all questions answered ( no min page requirements) .docxAPA style and all questions answered ( no min page requirements) .docx
APA style and all questions answered ( no min page requirements) .docx
 
Apa format1-2 paragraphsreferences It is often said th.docx
Apa format1-2 paragraphsreferences It is often said th.docxApa format1-2 paragraphsreferences It is often said th.docx
Apa format1-2 paragraphsreferences It is often said th.docx
 
APA format2-3 pages, double-spaced1. Choose a speech to review. It.docx
APA format2-3 pages, double-spaced1. Choose a speech to review. It.docxAPA format2-3 pages, double-spaced1. Choose a speech to review. It.docx
APA format2-3 pages, double-spaced1. Choose a speech to review. It.docx
 
APA format  httpsapastyle.apa.orghttpsowl.purd.docx
APA format     httpsapastyle.apa.orghttpsowl.purd.docxAPA format     httpsapastyle.apa.orghttpsowl.purd.docx
APA format  httpsapastyle.apa.orghttpsowl.purd.docx
 
APA format2-3 pages, double-spaced1. Choose a speech to review. .docx
APA format2-3 pages, double-spaced1. Choose a speech to review. .docxAPA format2-3 pages, double-spaced1. Choose a speech to review. .docx
APA format2-3 pages, double-spaced1. Choose a speech to review. .docx
 
APA Formatting AssignmentUse the information below to create.docx
APA Formatting AssignmentUse the information below to create.docxAPA Formatting AssignmentUse the information below to create.docx
APA Formatting AssignmentUse the information below to create.docx
 
APA style300 words10 maximum plagiarism  Mrs. Smith was.docx
APA style300 words10 maximum plagiarism  Mrs. Smith was.docxAPA style300 words10 maximum plagiarism  Mrs. Smith was.docx
APA style300 words10 maximum plagiarism  Mrs. Smith was.docx
 
APA format1. What are the three most important takeawayslessons.docx
APA format1. What are the three most important takeawayslessons.docxAPA format1. What are the three most important takeawayslessons.docx
APA format1. What are the three most important takeawayslessons.docx
 
APA General Format Summary APA (American Psychological.docx
APA General Format Summary APA (American Psychological.docxAPA General Format Summary APA (American Psychological.docx
APA General Format Summary APA (American Psychological.docx
 
Appearance When I watched the video of myself, I felt that my b.docx
Appearance When I watched the video of myself, I felt that my b.docxAppearance When I watched the video of myself, I felt that my b.docx
Appearance When I watched the video of myself, I felt that my b.docx
 
apa format1-2 paragraphsreferencesFor this week’s .docx
apa format1-2 paragraphsreferencesFor this week’s .docxapa format1-2 paragraphsreferencesFor this week’s .docx
apa format1-2 paragraphsreferencesFor this week’s .docx
 
APA Format, with 2 references for each question and an assignment..docx
APA Format, with 2 references for each question and an assignment..docxAPA Format, with 2 references for each question and an assignment..docx
APA Format, with 2 references for each question and an assignment..docx
 
APA-formatted 8-10 page research paper which examines the potential .docx
APA-formatted 8-10 page research paper which examines the potential .docxAPA-formatted 8-10 page research paper which examines the potential .docx
APA-formatted 8-10 page research paper which examines the potential .docx
 
APA    STYLE 1.Define the terms multiple disabilities and .docx
APA    STYLE 1.Define the terms multiple disabilities and .docxAPA    STYLE 1.Define the terms multiple disabilities and .docx
APA    STYLE 1.Define the terms multiple disabilities and .docx
 
APA STYLE  follow this textbook answer should be summarize for t.docx
APA STYLE  follow this textbook answer should be summarize for t.docxAPA STYLE  follow this textbook answer should be summarize for t.docx
APA STYLE  follow this textbook answer should be summarize for t.docx
 
APA7Page length 3-4, including Title Page and Reference Pag.docx
APA7Page length 3-4, including Title Page and Reference Pag.docxAPA7Page length 3-4, including Title Page and Reference Pag.docx
APA7Page length 3-4, including Title Page and Reference Pag.docx
 
APA format, 2 pagesThree general sections 1. an article s.docx
APA format, 2 pagesThree general sections 1. an article s.docxAPA format, 2 pagesThree general sections 1. an article s.docx
APA format, 2 pagesThree general sections 1. an article s.docx
 
APA Style with minimum of 450 words, with annotations, quotation.docx
APA Style with minimum of 450 words, with annotations, quotation.docxAPA Style with minimum of 450 words, with annotations, quotation.docx
APA Style with minimum of 450 words, with annotations, quotation.docx
 
APA FORMAT1.  What are the three most important takeawayslesson.docx
APA FORMAT1.  What are the three most important takeawayslesson.docxAPA FORMAT1.  What are the three most important takeawayslesson.docx
APA FORMAT1.  What are the three most important takeawayslesson.docx
 

Recently uploaded

Interactive Powerpoint_How to Master effective communication
Interactive Powerpoint_How to Master effective communicationInteractive Powerpoint_How to Master effective communication
Interactive Powerpoint_How to Master effective communicationnomboosow
 
Roles & Responsibilities in Pharmacovigilance
Roles & Responsibilities in PharmacovigilanceRoles & Responsibilities in Pharmacovigilance
Roles & Responsibilities in PharmacovigilanceSamikshaHamane
 
Full Stack Web Development Course for Beginners
Full Stack Web Development Course  for BeginnersFull Stack Web Development Course  for Beginners
Full Stack Web Development Course for BeginnersSabitha Banu
 
18-04-UA_REPORT_MEDIALITERAСY_INDEX-DM_23-1-final-eng.pdf
18-04-UA_REPORT_MEDIALITERAСY_INDEX-DM_23-1-final-eng.pdf18-04-UA_REPORT_MEDIALITERAСY_INDEX-DM_23-1-final-eng.pdf
18-04-UA_REPORT_MEDIALITERAСY_INDEX-DM_23-1-final-eng.pdfssuser54595a
 
Computed Fields and api Depends in the Odoo 17
Computed Fields and api Depends in the Odoo 17Computed Fields and api Depends in the Odoo 17
Computed Fields and api Depends in the Odoo 17Celine George
 
Crayon Activity Handout For the Crayon A
Crayon Activity Handout For the Crayon ACrayon Activity Handout For the Crayon A
Crayon Activity Handout For the Crayon AUnboundStockton
 
KSHARA STURA .pptx---KSHARA KARMA THERAPY (CAUSTIC THERAPY)————IMP.OF KSHARA ...
KSHARA STURA .pptx---KSHARA KARMA THERAPY (CAUSTIC THERAPY)————IMP.OF KSHARA ...KSHARA STURA .pptx---KSHARA KARMA THERAPY (CAUSTIC THERAPY)————IMP.OF KSHARA ...
KSHARA STURA .pptx---KSHARA KARMA THERAPY (CAUSTIC THERAPY)————IMP.OF KSHARA ...M56BOOKSTORE PRODUCT/SERVICE
 
Biting mechanism of poisonous snakes.pdf
Biting mechanism of poisonous snakes.pdfBiting mechanism of poisonous snakes.pdf
Biting mechanism of poisonous snakes.pdfadityarao40181
 
EPANDING THE CONTENT OF AN OUTLINE using notes.pptx
EPANDING THE CONTENT OF AN OUTLINE using notes.pptxEPANDING THE CONTENT OF AN OUTLINE using notes.pptx
EPANDING THE CONTENT OF AN OUTLINE using notes.pptxRaymartEstabillo3
 
Hierarchy of management that covers different levels of management
Hierarchy of management that covers different levels of managementHierarchy of management that covers different levels of management
Hierarchy of management that covers different levels of managementmkooblal
 
Introduction to AI in Higher Education_draft.pptx
Introduction to AI in Higher Education_draft.pptxIntroduction to AI in Higher Education_draft.pptx
Introduction to AI in Higher Education_draft.pptxpboyjonauth
 
Alper Gobel In Media Res Media Component
Alper Gobel In Media Res Media ComponentAlper Gobel In Media Res Media Component
Alper Gobel In Media Res Media ComponentInMediaRes1
 
Presiding Officer Training module 2024 lok sabha elections
Presiding Officer Training module 2024 lok sabha electionsPresiding Officer Training module 2024 lok sabha elections
Presiding Officer Training module 2024 lok sabha electionsanshu789521
 
Meghan Sutherland In Media Res Media Component
Meghan Sutherland In Media Res Media ComponentMeghan Sutherland In Media Res Media Component
Meghan Sutherland In Media Res Media ComponentInMediaRes1
 
Final demo Grade 9 for demo Plan dessert.pptx
Final demo Grade 9 for demo Plan dessert.pptxFinal demo Grade 9 for demo Plan dessert.pptx
Final demo Grade 9 for demo Plan dessert.pptxAvyJaneVismanos
 
DATA STRUCTURE AND ALGORITHM for beginners
DATA STRUCTURE AND ALGORITHM for beginnersDATA STRUCTURE AND ALGORITHM for beginners
DATA STRUCTURE AND ALGORITHM for beginnersSabitha Banu
 
History Class XII Ch. 3 Kinship, Caste and Class (1).pptx
History Class XII Ch. 3 Kinship, Caste and Class (1).pptxHistory Class XII Ch. 3 Kinship, Caste and Class (1).pptx
History Class XII Ch. 3 Kinship, Caste and Class (1).pptxsocialsciencegdgrohi
 
Historical philosophical, theoretical, and legal foundations of special and i...
Historical philosophical, theoretical, and legal foundations of special and i...Historical philosophical, theoretical, and legal foundations of special and i...
Historical philosophical, theoretical, and legal foundations of special and i...jaredbarbolino94
 

Recently uploaded (20)

ESSENTIAL of (CS/IT/IS) class 06 (database)
ESSENTIAL of (CS/IT/IS) class 06 (database)ESSENTIAL of (CS/IT/IS) class 06 (database)
ESSENTIAL of (CS/IT/IS) class 06 (database)
 
Interactive Powerpoint_How to Master effective communication
Interactive Powerpoint_How to Master effective communicationInteractive Powerpoint_How to Master effective communication
Interactive Powerpoint_How to Master effective communication
 
Roles & Responsibilities in Pharmacovigilance
Roles & Responsibilities in PharmacovigilanceRoles & Responsibilities in Pharmacovigilance
Roles & Responsibilities in Pharmacovigilance
 
Full Stack Web Development Course for Beginners
Full Stack Web Development Course  for BeginnersFull Stack Web Development Course  for Beginners
Full Stack Web Development Course for Beginners
 
18-04-UA_REPORT_MEDIALITERAСY_INDEX-DM_23-1-final-eng.pdf
18-04-UA_REPORT_MEDIALITERAСY_INDEX-DM_23-1-final-eng.pdf18-04-UA_REPORT_MEDIALITERAСY_INDEX-DM_23-1-final-eng.pdf
18-04-UA_REPORT_MEDIALITERAСY_INDEX-DM_23-1-final-eng.pdf
 
Computed Fields and api Depends in the Odoo 17
Computed Fields and api Depends in the Odoo 17Computed Fields and api Depends in the Odoo 17
Computed Fields and api Depends in the Odoo 17
 
Crayon Activity Handout For the Crayon A
Crayon Activity Handout For the Crayon ACrayon Activity Handout For the Crayon A
Crayon Activity Handout For the Crayon A
 
KSHARA STURA .pptx---KSHARA KARMA THERAPY (CAUSTIC THERAPY)————IMP.OF KSHARA ...
KSHARA STURA .pptx---KSHARA KARMA THERAPY (CAUSTIC THERAPY)————IMP.OF KSHARA ...KSHARA STURA .pptx---KSHARA KARMA THERAPY (CAUSTIC THERAPY)————IMP.OF KSHARA ...
KSHARA STURA .pptx---KSHARA KARMA THERAPY (CAUSTIC THERAPY)————IMP.OF KSHARA ...
 
Biting mechanism of poisonous snakes.pdf
Biting mechanism of poisonous snakes.pdfBiting mechanism of poisonous snakes.pdf
Biting mechanism of poisonous snakes.pdf
 
EPANDING THE CONTENT OF AN OUTLINE using notes.pptx
EPANDING THE CONTENT OF AN OUTLINE using notes.pptxEPANDING THE CONTENT OF AN OUTLINE using notes.pptx
EPANDING THE CONTENT OF AN OUTLINE using notes.pptx
 
Hierarchy of management that covers different levels of management
Hierarchy of management that covers different levels of managementHierarchy of management that covers different levels of management
Hierarchy of management that covers different levels of management
 
Introduction to AI in Higher Education_draft.pptx
Introduction to AI in Higher Education_draft.pptxIntroduction to AI in Higher Education_draft.pptx
Introduction to AI in Higher Education_draft.pptx
 
Alper Gobel In Media Res Media Component
Alper Gobel In Media Res Media ComponentAlper Gobel In Media Res Media Component
Alper Gobel In Media Res Media Component
 
Presiding Officer Training module 2024 lok sabha elections
Presiding Officer Training module 2024 lok sabha electionsPresiding Officer Training module 2024 lok sabha elections
Presiding Officer Training module 2024 lok sabha elections
 
TataKelola dan KamSiber Kecerdasan Buatan v022.pdf
TataKelola dan KamSiber Kecerdasan Buatan v022.pdfTataKelola dan KamSiber Kecerdasan Buatan v022.pdf
TataKelola dan KamSiber Kecerdasan Buatan v022.pdf
 
Meghan Sutherland In Media Res Media Component
Meghan Sutherland In Media Res Media ComponentMeghan Sutherland In Media Res Media Component
Meghan Sutherland In Media Res Media Component
 
Final demo Grade 9 for demo Plan dessert.pptx
Final demo Grade 9 for demo Plan dessert.pptxFinal demo Grade 9 for demo Plan dessert.pptx
Final demo Grade 9 for demo Plan dessert.pptx
 
DATA STRUCTURE AND ALGORITHM for beginners
DATA STRUCTURE AND ALGORITHM for beginnersDATA STRUCTURE AND ALGORITHM for beginners
DATA STRUCTURE AND ALGORITHM for beginners
 
History Class XII Ch. 3 Kinship, Caste and Class (1).pptx
History Class XII Ch. 3 Kinship, Caste and Class (1).pptxHistory Class XII Ch. 3 Kinship, Caste and Class (1).pptx
History Class XII Ch. 3 Kinship, Caste and Class (1).pptx
 
Historical philosophical, theoretical, and legal foundations of special and i...
Historical philosophical, theoretical, and legal foundations of special and i...Historical philosophical, theoretical, and legal foundations of special and i...
Historical philosophical, theoretical, and legal foundations of special and i...
 

PSYCHIATRIC SERVICES ♦ March 2002 Vol. 53 No. 3 229933.docx

  • 1. PSYCHIATRIC SERVICES ♦ March 2002 Vol. 53 No. 3 229933 Virtually every state in the Unit-ed States now uses managedcare techniques to control be- havioral health costs for Medicaid re- cipients. Implementation of these strategies has proceeded in the ab- sence of substantial information on the resulting quality of care and ef- fectiveness of services (1). Advocates for persons who have severe mental illness have raised concerns about the application of cost-cutting techniques developed in the private sector for employed persons with acute illness- es to persons in Medicaid and other public-sector programs who have persistent serious mental illness (2). We wanted to compare the service use patterns of Medicaid recipients with serious mental illness in a full- risk (capitated) and a no-risk (fee-for- service) system of care and to deter- mine whether the type of financial risk arrangement affected patients’ health status. Many state Medicaid agencies use capitation—the prepayment of an es-
  • 2. tablished fee per person for a defined benefit over a set period—to keep their costs predictable and limited. In some instances a single capitated pay- ment is made to a managed care or- ganization (MCO). In these ostensi- bly integrated plans, behavioral health care can be provided directly by MCO providers, by behavioral health professionals who are paid on a discounted fee-for-service basis, or even by a behavioral health MCO or another agency through a subcon- tract. In other cases, the state Medic- aid agency can carve out the behav- ioral health benefit by making capi- tated payments directly to a behav- ioral health MCO. Managed care programs that use capitated payments to transfer finan- cial risk to for-profit entities that are responsible for the care of vulnerable populations are of particular concern. Specifically, the incentives of capita- tion to lower costs and limit service use may lead to worse outcomes for persons with severe mental illness, who often have multiple and inten- sive service needs. State Medicaid agencies that pay for mental health care on a fee-for- service basis also use cost-control measures. Often an administrative services organization that is not con-
  • 3. Service Use and Health Status of Persons With Severe Mental Illness in Full-Risk and No-Risk Medicaid Programs JJoosseepphh PP.. MMoorrrriisssseeyy,, PPhh..DD.. TT.. SSccootttt SSttrroouupp,, MM..DD..,, MM..PP..HH.. AAllaann RR.. EElllliiss,, MM..SS..WW.. EElliizzaabbeetthh MMeerrwwiinn,, PPhh..DD.. Dr. Morrissey, Dr. Stroup, and Mr. Ellis are affiliated with the Cecil G. Sheps Center for Health Services Research of the University of North Carolina at Chapel Hill, 275 Air- port Road, Chapel Hill, North Carolina 27599-7590 (e-mail, [email protected]). Dr. Merwin is with the Southeastern Rural Mental Health Research Center of the Uni- versity of Virginia in Charlottesville. Objective: The service use patterns and health status outcomes of Med- icaid recipients with severe mental illness in a system that assigned full financial risk to managed care organizations through capitation and a system that paid for mental health care on a no-risk fee-for- service ba- sis were compared. Methods: With use of a quasi-experimental design, initial interviews (time 1) and follow-up interviews six months later (time 2) were conducted among 92 clients in the full-risk group and 112 clients in the no-risk group. Regression models were used to compare self-reported service use and health status between the two
  • 4. groups. Re- sults: Service use patterns differed between the two groups. When symptom severity at time 1 was controlled for, clients in the full-risk group were more likely to have received case management but less like- ly to report contact with a psychiatrist or to have received counseling than clients in the no-risk group. When health status at time 1 was con- trolled for, clients in the full-risk group reported poorer mental health at time 2 than clients in the no-risk group. When physical health status at time 1 was controlled for, clients in the full-risk group reported poor- er physical health at time 2 than clients in the no-risk group. Conclu- sions: Capitation was associated with lower use of costly services. Clients with serious mental illness in the full-risk managed care system had poorer mental and physical health outcomes than those in the no-risk system. (Psychiatric Services 53:293–298, 2002) mor3.qxd 2/15/02 1:07 PM Page 293 tractually at financial risk provides utilization management, including prior authorization and concurrent review. Because the pressures to re- duce service use are less severe in no-
  • 5. risk situations than under capitated contracts, utilization management alone is not likely to lead to serious adverse consequences for clients, al- though this area needs further study. Several studies have shown that various managed care arrangements affect the use of Medicaid behavioral health services and Medicaid costs (3–10). One of the most consistent findings is that capitation lowers Medicaid costs by decreasing the use of expensive services, such as hospi- talization, while promoting less ex- pensive outpatient treatment. Rela- tively little is known about how the resulting patterns of service use affect patient outcomes. Some researchers who have compared the outcomes of persons with severe mental illness in capitated and fee-for-service systems have found no evidence that individu- als have been harmed by prepaid care (10,11). However, in Utah research- ers found a slightly lower rate of im- provement in mental health status among persons with schizophrenia in a capitated plan than among those in a fee-for-service plan (12). This article reports the results of a prospective cohort study undertaken as part of the Tidewater managed care study, which compared two or- ganization and financing strategies for
  • 6. Virginia Medicaid recipients with se- rious mental illness. A managed care program in the Tidewater region that assigned full financial risk to MCOs through capitation was compared with a program in the Richmond re- gion that paid for mental health care on a no-risk fee-for-service basis (13). In the Richmond region (no-risk condition), a Medicaid primary care case management program was in op- eration at the time of this study. In this model of managed care, mental health services were carved out of the program and were provided on a fee- for-service basis. The primary care providers were not gatekeepers for access to mental health services. The state Medicaid agency contracted with an administrative services organ- ization to provide utilization manage- ment, including prior authorization and concurrent review, for mental health services. The administrative services organization was not at finan- cial risk. In the Tidewater region (full-risk condition), Medicaid recipients were mandated to enroll in one of four health maintenance organizations (HMOs). The medical-psychiatric component of the Medicaid mental health benefit was prepaid with use of
  • 7. capitated contracts with the HMOs. The covered mental health services were inpatient hospitalization, psy- chiatric evaluation, medication man- agement, and psychotherapy. We ex- amined the HMO in the Tidewater region that had the largest market share—about 60 percent. This HMO developed a subcontract with a sub- sidiary behavioral health MCO to manage the covered mental health benefits. The behavioral health MCO sub- contracted with five local community mental health centers—known in Vir- ginia as community service boards— to provide outpatient mental health services and paid these boards on a capitated basis. Community service boards serve essentially the same function as public community mental health centers—they represent the primary locus of nonhospital care for persons with serious mental illness. A network of local hospitals provided inpatient services. The behavioral health MCO paid these hospitals on a capitated basis, placing them at risk for the costs of inpatient treatment. By withholding a portion of the capi- tated payments if utilization goals were not met, the behavioral health MCO shared financial risk for inpa-
  • 8. tient services with the community service boards and the hospitals. Under both the no-risk and the full-risk condition, case management and rehabilitation services for persons with serious mental illness were pro- vided by community service boards on a no-risk fee-for-service basis un- der Virginia’s Medicaid state plan op- tion. Under state law, only communi- ty service boards were eligible for Medicaid payments for state plan op- tion services. Substance abuse servic- es were not covered under the Vir- ginia Medicaid program; these servic- es were supported by block grant funding from the Virginia Depart- ment of Mental Health to the com- munity service boards. Methods This prospective cohort study used a quasi-experimental design. Whether a subject received the intervention (full-risk Medicaid managed care) was determined by place of residence rather than random assignment. Time 1 data collection began in August 1997, 19 months after the mandatory HMO program began. Time 2 data were col- lected six months after the initial in- terview with each participant, with the final interviews taking place in early 1999.
  • 9. The analyses were conducted with data collected from Medicaid recipi- ents with serious mental illness who were recruited as outpatients at a Tidewater area community service board and a Richmond area commu- nity service board. Trained interview- ers who had clinical experience with clients who have serious mental illness conducted initial structured research interviews with 243 outpatients—123 (51 percent) in the Tidewater area and 120 (49 percent) in the Richmond area. PSYCHIATRIC SERVICES ♦ March 2002 Vol. 53 No. 3229944 One of the most consistent findings is that capitation lowers Medicaid costs by decreasing the use of expensive services, such as hospitalization, while promoting less expensive outpatient
  • 10. treatment. mor3.qxd 2/15/02 1:07 PM Page 294 Access to study subjects was through personnel of the community service boards, who generated a list of clients and asked those who were eligible to speak with a researcher about partici- pating in a research interview. Re- search personnel then contacted those who agreed and explained the study in detail and obtained written informed consent. The consent form and other research procedures were approved by the Committee on the Protection of Human Subjects at the University of Carolina at Chapel Hill. As part of a Substance Abuse and Mental Health Services Administra- tion initiative to examine managed behavioral health care in the public sector, the Tidewater managed care study used a survey instrument devel- oped with investigators at other sites. The instrument covered several do- mains, including demographic infor- mation, quality of life, clinical history, health status, mental health symp- toms, substance use, satisfaction, and service use. We focused on service use, symp-
  • 11. toms, and health status and created dichotomous variables for each. Infor- mation about service use was obtained by asking clients whether they had used specific mental health and sub- stance abuse services in the previous three months. Physical and mental health status were measured with the physical component summary (PCS- 12) and mental component summary (MCS-12), respectively, of the Med- ical Outcomes Study 12-Item Short- Form Health Survey (SF-12) (14). Sev- erity of symptoms was measured with the global severity index of the Brief Symptom Inventory (BSI) (15). Chi square tests and t tests were used to compare the two groups in de- mographic, social, clinical, and service use variables at time 1. The analyses then focused on two research ques- tions. First, if symptom severity at time 1 is controlled for, how do the service use patterns of persons with serious mental illness compare be- tween the full-risk and no-risk condi- tions? Second, if health status at time 1 and service use are controlled for, does the type of managed care ar- rangement affect health status six months later? The SAS statistical pac- kage was used for all analyses.
  • 12. To address the first question, a list of key psychiatric and medical servic- es was adapted from the recommen- dations of the Schizophrenia Patient Outcomes Research Team (PORT) (16). Chi square tests were used to compare the crude proportions of the two groups that reported use of each key service during the three months before the time 2 interview. Logistic regression was then used to estimate an adjusted odds ratio for each key psychiatric and medical service, con- trolling for symptom severity and physical health status at time 1. The second question was addressed with use of regression models. Linear regression was used to predict scores on the SF-12 mental and physical component summaries at time 2. Backward stepwise selection was used, with a p value below .05 as the deletion criterion. The initial predic- tors in the models included the man- aged care condition, four dichoto- mous variables that indicated use of each key outpatient psychiatric serv- PSYCHIATRIC SERVICES ♦ March 2002 Vol. 53 No. 3 229955 TTaabbllee 11 Characteristics of clients with serious mental illness under no- risk and full-risk managed care arrangements at time 1
  • 13. Overall (N=204) No risk (N=112) Full risk (N=92) Domain and variable N or mean±SD % N or mean±SD % N or mean±SD % p Demographic characteristics Male sex 92 45 53 47 39 42 ns African-American race 153 76 84 76 69 76 ns Currently married 15 7 8 7 7 8 ns High school education 88 43 50 45 38 42 ns Mean age (years) 43±9.8 44±9.7 43±10.1 Social variables Board-and-care home resident 53 26 42 38 11 12 <.001 Homeless in the previous three months 18 9 5 4 13 14 <.05 Weekly family contact 106 52 51 46 55 60 <.05 Clinical history and health status Drug or alcohol problems in the previous 30 days 28 14 18 16 10 11 ns Physical illness 114 56 62 55 52 57 ns Physical disability 55 28 32 29 23 26 ns Global severity indexa .97±.8 .81±.73 1.17±.86 <.01 MCS-12b 42.7±12.1 44.3±12.6 40.8±11.2 <.05 PCS-12c 44.1±10.1 45.5±10.2 42.5±9.8 <.05 Service use in the previous three months Case management contact 123 60 55 49 68 74 <.001 Primary care contact 105 52 49 44 56 61 <.05 a Global severity index of the Brief Symptom Inventory. Possible scores range from 0 to 4, with higher scores indicating worse symptoms. b Mental component summary of the 12-Item Short-Form Health
  • 14. Survey. Norm-based standardized scores have means of 50 and standard deviations of 10 in the general U.S. population, with higher scores indicating better functioning. c Physical component summary of the 12-Item Short-Form Health Survey. Norm-based standardized scores have means of 50 and standard deviations of 10, with higher scores indicating better health. mor3.qxd 2/15/02 1:07 PM Page 295 ice—case management, contact with a psychiatrist, counseling, and voca- tional training—and a dichotomous variable that indicated the use of any key medical service—primary care, specialty care, or admission—during the three months before the time 2 visit. The interaction of risk condition and case management was also in- cluded, because the nature of case management services may differ be- tween sites. In each initial model, the time 1 score for the dependent vari- able was included as a covariate. Results Participants in the full-risk and no-risk groups who completed both the time 1 and time 2 assessments were similar demographically, as can be seen from Table 1. At time 1, the no-risk group
  • 15. (Richmond area) had a higher propor- tion of board-and-care home resi- dents, a lower proportion who report- ed homelessness in the previous three months, and a lower proportion re- porting weekly family contact than the full-risk group (Tidewater area). The no-risk group also reported better mental health, as indicated by lower scores on the global severity index of the BSI, and less use of case manage- ment and primary care than the full- risk group. Clients in the no-risk group reported better mental and physical health status, as indicated by higher MCS-12 and PCS-12 scores, than clients in the full-risk group. Six-month follow-up rates were 92 (75 percent) of 123 in the full-risk group and 112 (93 percent) of 120 in the no-risk group. In both groups, clients who were lost to follow-up had less housing stability, less disability, and fewer symptoms than those who were retained. In the full-risk group, clients who were lost to follow-up re- ported better mental health at time 1 than those who were retained. The crude and adjusted odds ratios for the full-risk group relative to the no-risk group for the three-month pe- riod preceding the time 2 interview
  • 16. are shown for each key psychiatric and medical service in Table 2. After ad- justment for time 1 symptoms, clients in the full-risk group were more likely to have received case management but less likely to report contact with a psychiatrist or receipt of individual, group, or family counseling than clients in the no-risk group. The re- sults for vocational training and psy- chiatric admission were not significant but suggested that clients in the full- risk group were less likely to have re- ceived these services. For key medical services, there was a nonsignificant pattern of more service use for clients in the full-risk group. At time 2, clients in the full-risk group continued to report worse mental and physical health than clients in the no-risk group. Respec- tive scores were 41.4 and 48.1 on the MCS-12 (t=4.15, df=190, p<.001) and 41.3 and 46.4 on the PCS-12 (t=3.30, df=190, p<.001). To control for the differences in health status at time 1, we included the time 1 scores for the dependent variables in the lin- ear regression models. After backward stepwise regression, the only significant predictors in the fi- nal model of the MCS-12 score at time 2 were the score at time 1 and the man- aged care condition (Table 3). When
  • 17. MCS-12 score at time 1 was controlled for, the full-risk managed care condi- tion was a predictor of poorer mental health. The difference of 4.1 points in the MCS-12 score that was associated with capitation in our model is of only modest clinical significance. In the study in which the validity of the SF-12 was established (14), people with seri- ous mental and physical illness scored 9.3 points lower than people with seri- ous physical illness alone, while people with mental illness alone scored 16.8 points lower than people with only a minor medical illness. In the final linear regression model for the PCS-12 score at time 2, the PSYCHIATRIC SERVICES ♦ March 2002 Vol. 53 No. 3229966 TTaabbllee 22 Service use by clients with serious mental illness under no-risk and full-risk man- aged care arrangements during the three months before six- month follow-up No risk Full risk (N=112) (N=92) Crude Adjusted odds ratio odds ratio Type of service N % N % for full risk for full riska Key psychiatric services
  • 18. Contact with psychiatrist 97 87 65 71 .37∗ ∗ .36∗ ∗ Case management 57 51 59 64 1.73 2.05∗ Counseling 45 40 23 25 .50∗ .48∗ Vocational training 37 33 24 26 .72 .68 Psychiatric admission 15 13 4 4 .30∗ .22 Key medical services Primary care 56 50 52 57 1.31 1.23 Medical prescription 48 43 44 48 1.23 1.18 Medical specialist 9 8 11 12 1.55 .97 Medical admission 6 5 9 10 1.92 1.63 a Adjusted for global severity index scores for key psychiatric services and for physical component summary scores for key medical services ∗ p<.05 ∗ ∗ p<.01 ∗ ∗ ∗ p<.001 TTaabbllee 33 Final linear regression model predicting mental component summary (MCS-12) score at time 2 Raw Standard regression regression Variable coefficient coefficient SE p Capitation –4.145 –.180 1.50 .006 MCS-12 score at time 1 .479 .490 .06 <.001 Intercept 25.548 3.03 <.001 mor3.qxd 2/15/02 1:07 PM Page 296
  • 19. managed care condition, contact with a psychiatrist in the previous three months, use of any physical health service in the previous three months, and PCS-12 score at time 1 were sig- nificant predictors, as shown in Table 4. Contact with a psychiatrist and the use of any physical health service were associated with poorer physical health status. The full-risk managed care condition was associated with poorer physical health status. Again, the 3.9-point difference in PCS-12 score that was associated with capita- tion in our model is of moderate clin- ical significance. In the study in which the validity of the SF-12 was established, people with serious men- tal and physical illness scored 2.4 points lower than people with serious physical illness alone, while people with mental illness alone scored 1.9 points higher than people with only a minor medical illness (14). Discussion and conclusions We found differences between the service use patterns of persons with serious mental illness in a full-risk Medicaid HMO and those in a no-risk Medicaid plan. Services covered by a capitated fee, including outpatient services provided by a psychiatrist
  • 20. and individual, group, and family counseling, were used significantly less by the enrollees in the full-risk HMO than by those in the no-risk Medicaid program. Use of inpatient services, also covered by a capitated fee, showed a similar trend. Case man- agement, a service paid for through separate funds on a fee-for-service basis under both arrangements, was more commonly reported by clients in the full-risk group than by those in the no-risk group. These patterns of service use sug- gest that the financial incentives asso- ciated with the full-risk arrangement had an impact in the expected direc- tion. The community service board in the full-risk setting had a strong in- centive to use case management, be- cause doing so provided income in addition to the capitated payment re- ceived from the behavioral health MCO. The incentive to provide case management and bill for it was less strong in the no-risk setting, because all services could be billed on a fee- for-service basis. The full-risk managed care model we studied in the Tidewater region had unique characteristics. Although the state Medicaid agency paid HMOs a single capitated fee to cover
  • 21. both mental and physical health serv- ices, the HMO in this study provided mental health services through a cap- itated subcontract with a subsidiary behavioral health MCO. By contract- ing with the existing public mental health centers to provide outpatient services, the behavioral health MCO ensured that persons with serious mental illness had access to providers who had appropriate experience. By allowing these mental health centers to continue to bill for case manage- ment outside the capitated contract, the state Medicaid agency limited some of the financial risk of the com- munity service boards. At time 1, study participants in the full-risk group reported poorer men- tal and physical health than partici- pants in the no-risk group. Possible explanations for the differences at time 1 include sampling bias—that is, nonrepresentativeness of the sam- ples—and real population differ- ences. Because staff of the communi- ty service boards approached every eligible client who could be located, the clients enrolled in this study can be considered a representative sam- ple of all community service board clients who have severe mental ill- ness. Other possible reasons for these differences are that the community service boards and HMOs targeted
  • 22. services for sicker clients in the full- risk setting or that the program re- sulted in poorer outcomes that were already apparent at the time of the time 1 interviews. Future research may be able to avoid the time 1 dif- ferences by focusing on new Medic- aid enrollees. We found that adults with severe mental illness in the full-risk man- aged care setting had poorer out- comes, consistent with our hypothe- ses. When scores at time 1 were con- trolled for, the full-risk condition was associated with poorer mental and physical health at time 2. The results of this study support earlier findings that the service use patterns of adults with severe mental illness are affected by risk-based managed care contracts. Previous studies have not shown a consistent effect of service use patterns on client outcomes under capitation (10–12). Because ours was a quasi-experimen- tal study, we cannot draw definite conclusions. We found that the full- risk managed care model we studied may have had an adverse effect on the mental and physical health of persons with serious mental illness. Virginia’s mandatory HMO pro-
  • 23. gram, although limited in geographic scope, saved the state Medicaid agency at least $16 million during its first two years of operation (17). The program expanded to the Richmond area in 1999, providing indirect evi- dence that the program is acceptable for MCOs and the state Medicaid agency. Whether this is sound public policy can be determined only by con- tinued evaluation and public debate. Although this observational study provided no definitive evidence on capitated mental health services for adults with serious mental illness, it did provide evidence that full-risk capitation for this population may PSYCHIATRIC SERVICES ♦ March 2002 Vol. 53 No. 3 229977 TTaabbllee 44 Final linear regression model predicting physical component summary (PCS-12) score at time 2 Raw Standard regression regression Standard Variable coefficient coefficient error p Contact with psychiatrist –3.905 –.05 1.58 .015 Use of a key medical service –2.718 –.13 1.24 .030 Capitation –3.781 –.18 1.26 .003
  • 24. PCS-12 score at time 1 .573 .56 .06 <.001 Intercept 25.739 3.50 <.001 mor3.qxd 2/15/02 1:07 PM Page 297 have adverse consequences. Although the clinical effects of capitation in our study were modest, they were found over a relatively short period. Six months is not a long follow-up period for persons who have serious mental illness. However, our findings parallel those from Utah, where adverse ef- fects became apparent only after about three years of follow-up (12). Longer-term follow-up studies would help determine whether the negative effects we found in Virginia persist or intensify. In the absence of longer-term data, caution in the use of risk-based contracts for services for persons with serious mental illness is warranted. ♦ Acknowledgment This study was supported by cooperative agreement UR-7-TI11272 with the Sub- stance Abuse and Mental Health Services Administration. References
  • 25. 1. Durham M: Mental health and managed care. Annual Review of Public Health 19: 493–505, 1998 2. Hoge MA, Davidson L, Griffith EEH, et al: Defining managed care in public-sector psychiatry. Hospital and Community Psy- chiatry 45:1085–1089, 1994 3. Christianson JB, Manning W, Lurie N, et al: Utah’s prepaid mental health plan: the first year. Health Affairs 14(3):160–172, 1995 4. Callahan JJ, Shepard DS, Beinecke RH, et al: Mental health/substance abuse treat- ment in managed care: the Massachusetts Medicaid experience. Health Affairs 14(3): 173–184, 1995 5. Dickey B, Normand SL, Norton EC, et al: Managing the care of schizophrenia: les- sons from a 4-year Massachusetts Medicaid study. Archives of General Psychiatry 53: 945–952, 1996 6. Stroup TS, Dorwart RA: The impact of a managed mental health program on Medic- aid recipients with severe mental illness. Psychiatric Services 46:885–889, 1995 7. McFarland BH, Johnson RE, Hornbrook MC: Enrollment duration, service use, and costs of care for severely mentally ill mem- bers of a health maintenance organization. Archives of General Psychiatry 53:938–944,
  • 26. 1996 8. Popkin MK, Lurie N, Manning W, et al: Changes in the process of care for Medic- aid patients with schizophrenia in Utah’s prepaid mental health plan. Psychiatric Ser- vices 515–523, 1998 9. Liu CF, Manning WG, Christianson JB, et al: Patterns of outpatient use of mental health services for Medicaid beneficiaries under a prepaid mental health carve-out. Administration and Policy in Mental Health 26:401–415, 1999 10. Warner R, Huxley P: Outcomes for people with schizophrenia before and after Medic- aid capitation at a community agency in Colorado. Psychiatric Services 49:802–807, 1998 11. Lurie N, Moscovice IS, Finch M, et al: Does capitation affect the health of the chronically mentally ill? Results from a ran- domized trial. JAMA 267:3300–3304, 1992 12. Manning WG, Liu CF, Stoner TJ, et al: Outcomes for Medicaid beneficiaries with schizophrenia under a prepaid mental health carve-out. Journal of Behavioral Health Services Research 26:442–450, 1999 13. Fried BJ, Topping S, Morrissey JP, et al: Comparing provider perceptions of access and utilization management in full-risk and
  • 27. no-risk Medicaid programs for adults with a serious mental illness. Journal of Behav- ioral Health Services Research 27:29–46, 2000 14. Ware JE, Kosinski M, Keller SD: A 12-item Short-Form Health Survey (SF-12): con- struction of scales and preliminary tests of reliability and validity. Medical Care 32: 220–233, 1996 15. Derogatis LR: A Brief Form of the SCL- 90-R: A Self-Report Symptom Inventory Designed to Measure Psychological Stress: Brief Symptom Inventory (BSI). Minneapo- lis, National Computer Systems, 1993 16. Lehman AF, Steinwachs DM: Translating research into practice: the Schizophrenia Patient Outcomes Research Team (PORT) treatment recommendations. Schizophre- nia Bulletin 24:1–10, 1998 17. Virginia Division of Medical Assistance Services: Managed Care Program Summa- ry. Richmond, 2000. Available at www.cns. state.va.us/dmas/managed_care/manged_ care.htm PSYCHIATRIC SERVICES ♦ March 2002 Vol. 53 No. 3229988 RReevviieewweerrss NNeeeeddeedd Psychiatric Services seeks expert reviewers in the following areas:
  • 28. ♦ Water intoxication ♦ Cognitive-behavioral therapy ♦ Outpatient commitment ♦ Work with the police ♦ Psychiatry in other countries ♦ Experiences of patients and former patients ♦ Telemedicine and telecommunications ♦ Outcome and clinical measurement scales Reviewers should be familiar with the literature in their areas of expertise, should have published in peer-reviewed journals, and should be familiar with the content and focus of Psychiatric Services. Prospective reviewers should send a curriculum vitae, specifying areas of interest, to John A. Talbott, M.D., Editor, Psychiatric Services, American Psychiatric Associ- ation, 1400 K Street, N.W., Washington, D.C. 20005 (e-mail, [email protected]). mor3.qxd 2/15/02 1:07 PM Page 298 special article T h e n e w e n g l a n d j o u r n a l o f m e d i c i n e n engl j med 360;16 nejm.org april 16, 20091628 Use of Electronic Health Records in U.S. Hospitals
  • 29. Ashish K. Jha, M.D., M.P.H., Catherine M. DesRoches, Dr.Ph., Eric G. Campbell, Ph.D., Karen Donelan, Sc.D., Sowmya R. Rao, Ph.D., Timothy G. Ferris, M.D., M.P.H., Alexandra Shields, Ph.D., Sara Rosenbaum, J.D., and David Blumenthal, M.D., M.P.P. From the Department of Health Policy and Management, Harvard School of Pub- lic Health (A.K.J.); the Division of General Medicine, Brigham and Women’s Hospi- tal (A.K.J.); the Veterans Affairs Boston Healthcare System (A.K.J.); and the Insti- tute for Health Policy (C.M.D., E.G.C., K.D., S.R.R., T.G.F., A.S., D.B.) and the Biostatistics Center (S.R.R.), Massachu- setts General Hospital — all in Boston; and the Department of Health Policy, George Washington University, Washing- ton, DC (S.R.). Address reprint requests to Dr. Jha at the Harvard School of Public Health, 677 Huntington Ave., Boston, MA 02115, or at [email protected] This article (10.1056/NEJMsa0900592) was published at NEJM.org on March 25, 2009. N Engl J Med 2009;360:1628-38. Copyright © 2009 Massachusetts Medical Society. A b s t r a c t Background Despite a consensus that the use of health information
  • 30. technology should lead to more efficient, safer, and higher-quality care, there are no reliable estimates of the prevalence of adoption of electronic health records in U.S. hospitals. Methods We surveyed all acute care hospitals that are members of the American Hospital Association for the presence of specific electronic-record functionalities. Using a definition of electronic health records based on expert consensus, we determined the proportion of hospitals that had such systems in their clinical areas. We also examined the relationship of adoption of electronic health records to specific hos- pital characteristics and factors that were reported to be barriers to or facilitators of adoption. Results On the basis of responses from 63.1% of hospitals surveyed, only 1.5% of U.S. hos- pitals have a comprehensive electronic-records system (i.e., present in all clinical units), and an additional 7.6% have a basic system (i.e., present in at least one clinical unit). Computerized provider-order entry for medications has been implemented in only 17% of hospitals. Larger hospitals, those located in urban areas, and teaching hospitals were more likely to have electronic-records systems. Respondents cited cap-
  • 31. ital requirements and high maintenance costs as the primary barriers to implemen- tation, although hospitals with electronic-records systems were less likely to cite these barriers than hospitals without such systems. Conclusions The very low levels of adoption of electronic health records in U.S. hospitals suggest that policymakers face substantial obstacles to the achievement of health care per- formance goals that depend on health information technology. A policy strategy fo- cused on financial support, interoperability, and training of technical support staff may be necessary to spur adoption of electronic-records systems in U.S. hospitals. Copyright © 2009 Massachusetts Medical Society. All rights reserved. Downloaded from www.nejm.org on February 21, 2010 . For personal use only. No other uses without permission. Use of Elec tronic He a lth R ecor ds in U.S. Hospita l s n engl j med 360;16 nejm.org april 16, 2009 1629 The U.S. health care system faces chal-lenges on multiple fronts, including rising costs and inconsistent quality.1-3 Health in- formation technology, especially electronic health records, has the potential to improve the efficiency and effectiveness of health care providers.4,5 Meth-
  • 32. ods to speed the adoption of health information technology have received bipartisan support among U.S. policymakers, and the American Recovery and Reinvestment Act of 2009 has made the promotion of a national, interoperable health information sys- tem a priority. Despite broad consensus on the po- tential benefits of electronic health records and other forms of health information technology, U.S. health care providers have been slow to adopt them.6,7 Using a well-specified definition of elec- tronic health records in a recent study, we found that only 17% of U.S. physicians use either a min- imally functional or a comprehensive electronic- records system.8 Prior data on hospitals’ adoption of electronic health records or key functions of electronic rec- ords (e.g., computerized provider-order entry for medications) suggest levels of adoption that range between 5%9 and 59%.10 This broad range reflects different definitions of what constitutes an elec- tronic health record,10,11 use of convenience sam- ples,12 and low survey response rates.13 To provide more precise estimates of adoption of electronic health records among U.S. hospitals, the Office of the National Coordinator for Health Informa- tion Technology of the Department of Health and Human Services commissioned a study to measure current levels of adoption to facilitate tracking of these levels over time. As in our previous study,8 we identified key clinical functions to define the minimum func- tionalities necessary to call a system an electronic- records system in the hospital setting. We also defined an advanced configuration of functional-
  • 33. ities that might be termed a comprehensive elec- tronic-records system. Our survey then determined the proportion of U.S. hospitals reporting the use of electronic health records for either of these sets of functionalities. We hypothesized that large hos- pitals would have a higher prevalence of adoption of electronic health records than smaller hospitals. Similarly, we hypothesized that major teaching hospitals would have a higher prevalence of adop- tion than nonteaching hospitals and private hos- pitals a higher prevalence than public hospitals. Finally, to guide policymakers, we sought to iden- tify frequently reported barriers to adoption and potential mechanisms for facilitating it. M e t h o d s Survey Development We developed our survey by examining and syn- thesizing prior hospital-based surveys of electronic- records systems or related functionalities (e.g., computerized provider-order entry) that have been administered in the past 5 years.9,13,14 Working with experts who had led hospital-based surveys, we developed an initial draft of the instrument. To get feedback, we shared the survey with chief information officers, other hospital leaders, and survey experts. We then obtained input from a consensus panel of experts in the fields of health information technology, health services research, survey research, and health policy. Further survey modifications were approved by our expert pan- el. The final survey instrument was approved for use by the institutional review board of Partners
  • 34. HealthCare. Survey Sample and Administration We collaborated with the American Hospital As- sociation (AHA) to survey all acute care general medical and surgical member hospitals. The sur- vey was presented as an information technology supplement to the association’s annual survey of members, and like the overall AHA questionnaire, was sent to the hospital’s chief executive officer. Hospital chief executive officers generally assigned the most knowledgeable person in the institution (in this case, typically the chief information of- ficer or equivalent) to complete the survey. Non- responding hospitals received multiple telephone calls and reminder letters asking them to com- plete the survey. The survey was initially mailed in March 2008, and our in-field period ended in September 2008. Survey Content We asked respondents to report on the presence or absence of 32 clinical functionalities of an elec- tronic-records system and on whether their hos- pital had fully implemented these functionalities in all major clinical units, had implemented them in one or more (but not all) major clinical units, or had not yet fully implemented them in any unit Copyright © 2009 Massachusetts Medical Society. All rights reserved. Downloaded from www.nejm.org on February 21, 2010 . For personal use only. No other uses without permission.
  • 35. T h e n e w e n g l a n d j o u r n a l o f m e d i c i n e n engl j med 360;16 nejm.org april 16, 20091630 in the hospital. We asked respondents to identify whether certain factors were major or minor bar- riers or were not barriers to the adoption of an electronic-records system and whether specific pol- icy changes would have a positive or negative ef- fect on their decision to adopt such a system. The questions and response categories used are listed in the Supplementary Appendix, available with the full text of this article at NEJM.org. Measures of Electronic-Records Use The Institute of Medicine has developed a com- prehensive list of the potential functionalities of an inpatient electronic health record,15 but there is no consensus on what functionalities constitute the essential elements necessary to define an elec- tronic health record in the hospital setting. There- fore, we used the expert panel described earlier to help define the functionalities that constitute comprehensive and basic electronic-records sys- tems in the hospital setting. The panel was asked to identify whether individual functionalities would be necessary to classify a hospital as having a comprehensive or basic electronic health record. With the use of a modified Delphi process, the panel reached a consensus on the 24 functions that should be present in all major clinical units of a hospital to conclude that it had a comprehensive electronic-records system.16 Similarly, the panel
  • 36. reached a consensus on eight functionalities that should be present in at least one major clinical unit (e.g., the intensive care unit) in order for the hospital to be classified as having a basic electronic- records system. Because the panel disagreed on the need for two additional functionalities (physicians’ notes and nursing assessments) to classify a hos- pital as having a basic system, we developed two definitions of a basic electronic-records system, one that included functionalities for nursing assess- ments and physicians’ notes and another that did not. We present the results with the use of both definitions. Statistical Analysis We compared the characteristics of respondent and nonrespondent hospitals and found modest but significant differences. We estimated the propen- sity to respond to the survey with the use of a lo- gistic-regression model that included all these characteristics and used the inverse of this pro- pensity value as a weight in all analyses. We examined the proportion of hospitals that had each of the individual functionalities and sub- sequently calculated the prevalence of adoption of an electronic-records system, using three defini- tions of such a system: comprehensive, basic with physicians’ and nurses’ notes, and basic without physician and nursing notes. For all subsequent analyses, we used the definition of basic electronic health records that included clinicians’ notes. We explored bivariate relationships between key hospital characteristics (size, U.S. Census region,
  • 37. ownership, teaching status, urban vs. rural loca- tion, and presence or absence of markers of a high- technology institution) and adoption of a basic or comprehensive electronic-records system. We con- sidered the use of various potential markers of a high-technology institution, including the pres- ence of a dedicated coronary care unit, a burn unit, or a positron-emission tomographic scanner. Be- cause the results were similar for each of these markers, we present data based on the presence or absence of only one — a dedicated coronary care unit. We subsequently built a multivariable model to calculate levels of adoption of electronic- records systems, adjusted according to these hos- pital characteristics. We present the unadjusted results below and those from the multivariate mod- els in the Supplementary Appendix. Finally, we built logistic-regression models (ad- justing for the hospital characteristics mentioned above) to assess whether the presence or absence of electronic health records was associated with respondents’ reports of the existence of specific barriers and facilitators of adoption. Since the number of hospitals with comprehensive elec- tronic-records systems was small, we combined hospitals with comprehensive systems and those with basic electronic-records systems and com- pared their responses with those from institutions without electronic health records. In all analyses, two-sided P values of less than 0.05 were consid- ered to indicate statistical significance. R e s u l t s We received responses from 3049 hospitals, or
  • 38. 63.1% of all acute care general hospitals that were surveyed. After excluding federal hospitals and those located outside the 50 states and the Dis- trict of Columbia, we were left with 2952 institu- tions. There were modest differences between re- Copyright © 2009 Massachusetts Medical Society. All rights reserved. Downloaded from www.nejm.org on February 21, 2010 . For personal use only. No other uses without permission. Use of Elec tronic He a lth R ecor ds in U.S. Hospita l s n engl j med 360;16 nejm.org april 16, 2009 1631 spondents and nonrespondents (Table 1), and all results reported below have been adjusted for po- tential nonresponse bias. Adoption of Clinical Functionalities in Electronic Format We found large variations in the implementation of key clinical functionalities across U.S. hospi- tals. Only 12% of hospitals had instituted electron- ic physicians’ notes across all clinical units, and computerized provider-order entry for medications was reported as having been implemented across all clinical units in 17% of hospitals (Table 2). In contrast, more than 75% of hospitals reported adoption of electronic laboratory and radiologic reporting systems. A sizable number of hospitals reported having implemented several key func- tionalities in one or more (but not all) units,
  • 39. having begun such implementation, or having identified resources for the purpose of such im- plementation. These functionalities included phy- sicians’ notes (among 44% of the hospitals) and computerized provider-order entry (38%). Adoption of Electronic Records The presence of certain individual functionalities was considered necessary for an electronic-records system to be defined as comprehensive or basic by our expert panel (Table 3). On the basis of these definitions, we found that 1.5% (95% confidence interval [CI], 1.1 to 2.0) of U.S. hospitals had a comprehensive electronic-records system imple- mented across all major clinical units and an ad- ditional 7.6% (95% CI, 6.8 to 8.1) had a basic sys- tem that included functionalities for physicians’ notes and nursing assessments in at least one clinical unit. When defined without the require- ment for clinical notes, a basic electronic-records system was found in 10.9% of hospitals (95% CI, 9.7 to 12.0). If we include federal hospitals run by the Veterans Health Administration (VHA), the proportion of hospitals with comprehensive elec- tronic-records systems increases to 2.9% (95% CI, 2.3 to 3.5), the proportion with basic systems that include clinicians’ notes increases to 7.9% (95% CI, 6.9 to 8.8), and the proportion with basic systems that do not include clinicians’ notes increases to 11.3% (95% CI, 10.2 to 12.5). Hospitals were more likely to report having an electronic-records system if they were larger insti- tutions, major teaching hospitals, part of a larger
  • 40. hospital system, or located in urban areas and if they had dedicated coronary care units (Table 4); these differences were small. We found no rela- tionship between ownership status and level of adoption of electronic health records: the preva- lence of electronic-records systems in public hos- pitals was similar to that in private institutions. Even when we compared for-profit with nonprofit (public and private) institutions, there were no significant differences in adoption. In multivari- able analyses, each of these differences diminished Table 1. Characteristics of Responding and Nonresponding U.S. Acute Care Hospitals, Excluding Federal Hospitals.* Characteristic Respondents (N = 2952) Nonrespondents (N = 1862) percent Size Small (6–99 beds) 48 50 Medium (100–399 beds) 43 43 Large (≥400 beds) 10 7 Region
  • 41. Northeast 14 12 Midwest 33 24 South 37 41 West 17 22 Ownership status For-profit hospital 14 22 Private nonprofit hospital 62 55 Public hospital 24 23 Teaching status Major teaching hospital 7 4 Minor teaching hospital 16 16 Nonteaching hospital 77 80 Member of hospital system Yes 43 47 No 57 53 Location Urban 62 60 Nonurban 38 40
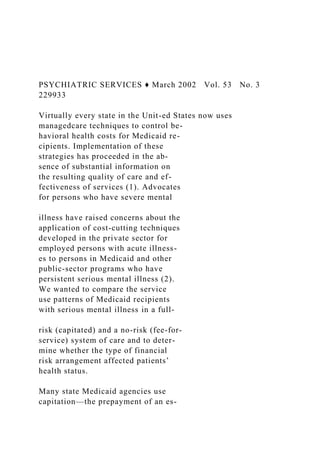
  • 42. Dedicated coronary care unit† Yes 35 25 No 65 75 * P<0.05 for all comparisons. Numbers may not add to 100 because of rounding. † The presence of a coronary care unit is a marker of technological capability. Copyright © 2009 Massachusetts Medical Society. All rights reserved. Downloaded from www.nejm.org on February 21, 2010 . For personal use only. No other uses without permission. T h e n e w e n g l a n d j o u r n a l o f m e d i c i n e n engl j med 360;16 nejm.org april 16, 20091632 further and was less consistently significant (see the Supplementary Appendix). Barriers to and Facilitators of Electronic- Records Adoption Among hospitals without electronic-records sys- tems, the most commonly cited barriers were in- adequate capital for purchase (74%), concerns about maintenance costs (44%), resistance on the part of physicians (36%), unclear return on investment (32%), and lack of availability of staff with ade- quate expertise in information technology (30%)
  • 43. (Fig. 1). Hospitals that had adopted electronic- records systems were less likely to cite four of these five concerns (all except physicians’ resistance) as major barriers to adoption than were hospitals that had not adopted such systems (Fig. 1). Most hospitals that had adopted electronic- records systems identified financial factors as hav- ing a major positive effect on the likelihood of adoption: additional reimbursement for electronic health record use (82%) and financial incentives Table 2. Selected Electronic Functionalities and Their Level of Implementation in U.S. Hospitals. Electronic Functionality Fully Implemented in All Units Fully Implemented in at Least One Unit Implementation Begun or Resources Identified* No Implementation, with No
  • 44. Specific Plans percent of hospitals Clinical documentation Medication lists 45 17 18 20 Nursing assessments 36 21 18 24 Physicians’ notes 12 15 29 44 Problem lists 27 17 23 34 Test and imaging results Diagnostic-test images (e.g., electrocar- diographic tracing) 37 11 19 32 Diagnostic-test results (e.g., echocardio- graphic report) 52 10 15 23 Laboratory reports 77 7 7 9 Radiologic images 69 10 10 10 Radiologic reports 78 7 7 8 Computerized provider-order entry Laboratory tests 20 12 25 42
  • 45. Medications 17 11 27 45 Decision support Clinical guidelines (e.g., beta-blockers af- ter myocardial infarction) 17 10 25 47 Clinical reminders (e.g., pneumococcal vaccine) 23 11 24 42 Drug-allergy alerts 46 15 16 22 Drug–drug interaction alerts 45 16 17 22 Drug–laboratory interaction alerts (e.g., digoxin and low level of serum potas- sium) 34 14 21 31 Drug-dose support (e.g., renal dose gui- dance) 31 15 21 33 * These hospitals reported that they were either beginning to implement the specified functionality in at least one unit or had identified the resources required for implementation in the next year. Copyright © 2009 Massachusetts Medical Society. All rights reserved.
  • 46. Downloaded from www.nejm.org on February 21, 2010 . For personal use only. No other uses without permission. Use of Elec tronic He a lth R ecor ds in U.S. Hospita l s n engl j med 360;16 nejm.org april 16, 2009 1633 for adoption (75%). Other facilitators of adoption included the availability of technical support for the implementation of information technology (47%) and objective third-party evaluations of elec- tronic health record products (35%). Hospitals with and those without electronic-records systems were equally likely to cite these factors (P>0.10 for each comparison) (Fig. 2). Table 3. Electronic Requirements for Classification of Hospitals as Having a Comprehensive or Basic Electronic- Records System.* Requirement Comprehensive EHR System Basic EHR System with Clinician Notes Basic EHR System without Clinician Notes
  • 47. Clinical documentation Demographic characteristics of patients √ √ √ Physicians’ notes √ √ Nursing assessments √ √ Problem lists √ √ √ Medication lists √ √ √ Discharge summaries √ √ √ Advanced directives √ Test and imaging results Laboratory reports √ √ √ Radiologic reports √ √ √ Radiologic images √ Diagnostic-test results √ √ √ Diagnostic-test images √ Consultant reports √ Computerized provider-order entry Laboratory tests √ Radiologic tests √ Medications √ √ √ Consultation requests √ Nursing orders √ Decision support Clinical guidelines √ Clinical reminders √ Drug-allergy alerts √ Drug–drug interaction alerts √ Drug–laboratory interaction alerts (e.g., digox- in and low level of serum potassium) √
  • 48. Drug-dose support (e.g., renal dose guidance) √ Adoption level — % of hospitals (95% CI) 1.5 (1.1–2.0) 7.6 (6.8–8.1) 10.9 (9.7–12.0) * A comprehensive electronic-health-records (EHR) system was defined as a system with electronic functionalities in all clinical units. A basic electronic-records system was defined as a system with electronic functionalities in at least one clinical unit. Copyright © 2009 Massachusetts Medical Society. All rights reserved. Downloaded from www.nejm.org on February 21, 2010 . For personal use only. No other uses without permission. T h e n e w e n g l a n d j o u r n a l o f m e d i c i n e n engl j med 360;16 nejm.org april 16, 20091634 D i s c u s s i o n We found that less than 2% of acute care hospi- tals have a comprehensive electronic-records sys- tem, and that, depending on the definition used, between 8 and 12% of hospitals have a basic elec- tronic-records system. With the use of the defini- tion that requires the presence of functionalities for physicians’ notes and nursing assessments, in- formation systems in more than 90% of U.S. hos- pitals do not even meet the requirement for a basic electronic-records system. Although levels of adoption of electronic health
  • 49. records were low, many functionalities that un- derlie electronic-records systems have been widely implemented. A sizable proportion of hospitals reported that laboratory and radiologic reports, radiologic images, medication lists, and some de- cision-support functions are available in electronic format. Others reported that they planned to up- grade their information systems to an electronic- records system by adding functionalities, such as computerized provider-order entry, physicians’ notes, and nursing assessments. However, these Table 4. Adoption of Comprehensive and Basic Electronic- Records Systems According to Hospital Characteristics.* Characteristic Comprehensive EHR System Basic EHR System† No EHR System Overall P Value percent of hospitals Size <0.001 Small (6–99 beds) 1.2±0.3 4.9±0.6 93.9±0.6 Medium (100–399 beds) 1.7±0.4 8.1±0.8 90.2±0.8
  • 50. Large (≥400 beds) 2.6±0.9 15.9±2.2 81.5±2.3 Region 0.77 Northeast 1.1±0.5 8.9±1.4 90.1±1.5 Midwest 1.7±0.4 6.6±0.8 91.7±0.9 South 1.4±0.4 7.3±0.8 91.3±0.8 West 1.9±0.6 7.0±1.2 91.1±1.3 Profitability status 0.08 For-profit hospital 1.3±0.5 5.2±1.1 93.5±1.2 Private nonprofit hospital 1.5±0.3 8.4±0.6 90.1±0.7 Public hospital 1.7±0.5 5.8±0.9 92.4±1.0 Teaching status <0.001 Major teaching hospital 2.6±1.1 18.5±2.6 78.9±2.7 Minor teaching hospital 2.4±0.7 10.6±1.4 87.0±1.6 Nonteaching hospital 1.3±0.2 5.6±0.5 93.1±0.5 Member of hospital system 0.006 Yes 2.1±0.4 8.4±0.9 89.5±0.9 No 1.1±0.2 6.3±0.6 92.6±0.6 Location <0.001
  • 51. Urban 1.9±0.3 8.4±0.6 89.7±0.6 Nonurban 0.6±0.3 4.0±0.7 95.3±0.8 Dedicated coronary care unit‡ 0.002 Yes 1.9±0.4 9.7±0.9 88.4±1.0 No 1.3±0.3 6.3±0.6 92.4±0.6 * Plus–minus values are means ±SE. EHR denotes electronic health record. † The definition of a basic system that included functionalities for physicians’ notes and nursing assessments was used for this analysis. ‡ The presence of a coronary care unit is a marker of technological capability. Copyright © 2009 Massachusetts Medical Society. All rights reserved. Downloaded from www.nejm.org on February 21, 2010 . For personal use only. No other uses without permission. Use of Elec tronic He a lth R ecor ds in U.S. Hospita l s n engl j med 360;16 nejm.org april 16, 2009 1635 functionalities are typically more difficult to im- plement than the others that we examined, and it remains unclear whether hospitals will be able to do so successfully. We found high levels of decision support in
  • 52. the absence of a comparable prevalence of com- puterized provider-order entry. It is possible that respondents reporting that their hospitals have implemented electronic decision support were in- cluding in that category decision-support capabili- ties that are available only for electronic pharmacy systems, thereby overstating the preparedness of hospitals to provide physicians with electronic de- cision support for patient care. We found somewhat higher levels of adoption among larger, urban, teaching hospitals, proba- bly reflecting greater availability of the financial resources necessary to acquire an electronic-records system. We expected to find lower levels of adop- tion among public hospitals, which might be fi- nancially stressed and therefore less able to pur- chase these systems. Although our results do not support this hypothesis, we did not directly ex- amine detailed indicators of the financial health of the hospitals, such as their operating margins. In 2006, we performed a comprehensive review of the literature on hospital adoption of electronic- records systems in the United States and found that the most rigorous assessment made was for computerized provider-order entry and that its prevalence was between 5 and 10%.6,9,14 An ear- lier AHA survey showed a higher prevalence of computerized provider-order entry,13 but the re- sponse rate was only 19%. A Mathematica survey showed that 21% of U.S. hospitals had comput- erized provider-order entry and 59% had elec- tronic clinical documentation.10 However, this survey’s definition of clinical documentation al-
  • 53. lowed for the inclusion of systems that were only capable of recording demographic characteristics of patients, a definition that is likely to have in- flated adoption levels, given that Medicare requires electronic reporting of demographic data. A re- cent analysis, based on a proprietary database with an unclear sampling frame and an unknown re- sponse rate, showed that 13% of the hospitals had implemented computerized provider-order entry, a prevalence similar to that in our study.11 Most reports of a beneficial effect of electronic- records systems involved systems capable of com- puterized provider-order entry with clinical-deci- sion support.4 Our experts took a lenient approach by not requiring the presence of clinical-decision support as part of a basic electronic-records sys- tem and by requiring adoption of computerized provider-order entry in only one clinical unit. 33p9 80 70 60 40 30 10 50
  • 54. 20 0 Hospitals with EHR Hospitals without EHR AUTHOR: FIGURE: JOB: 4-C H/T RETAKE SIZE ICM CASE EMail Line H/T Combo Revised AUTHOR, PLEASE NOTE: Figure has been redrawn and type has been reset. Please check carefully. REG F
  • 55. Enon 1st 2nd 3rd Jha 1 of 2 04-16-09 ARTIST: ts 36016 ISSUE: Inadequate capital for purchase Unclear ROI Maintenance cost Physicians’ resistance Inadequate IT staff Barriers P ro p o
  • 56. rt io n o f H o sp it al s (% ) Figure 1. Major Perceived Barriers to Adoption of Electronic Health Records (EHRs) among Hospitals with Electronic- Records Systems as Compared with Hospitals without Systems. Hospitals with electronic-records systems include hospitals with a comprehensive electronic-records system and those with a basic electronic-records system that includes functionalities for physicians’ notes and nursing assess- ments. P<0.01 for all comparisons except physicians’ resistance (P = 0.20). IT denotes information technology, and ROI return on investment. Copyright © 2009 Massachusetts Medical Society. All rights reserved. Downloaded from www.nejm.org on February 21, 2010 . For
  • 57. personal use only. No other uses without permission. T h e n e w e n g l a n d j o u r n a l o f m e d i c i n e n engl j med 360;16 nejm.org april 16, 20091636 Whether a hospital that has successfully imple- mented computerized provider-order entry in one unit can easily implement in other units and add clinical-decision support is unclear. Furthermore, a nonuniform information system within the hos- pital (paper-based in some units and electronic in others) may increase clinical hazards as patients move from one unit to another. Whether the ben- efits of adoption of an electronic-records system in some clinical units outweigh the theoretical hazards posed by uneven adoption within the hos- pital requires examination. Respondents identified financial issues as the predominant barriers to adoption, dwarfing is- sues such as resistance on the part of physicians. Other studies have shown that physicians’ resis- tance, partly driven by concerns about negative effects of the use of electronic health records on clinical productivity,17 can be detrimental to adop- tion efforts.18 Whether our respondents, most of whom have not adopted electronic health records, underestimated the challenges of overcoming this barrier or whether physicians are becoming more receptive to adoption is unclear. Either way, ob- taining the support of physicians — often by get- ting the backing of clinical leaders — can be help- ful in ensuring successful adoption.19
  • 58. Another potential barrier to adoption is con- cern about interoperability: few electronic-records systems allow for easy exchange of clinical data between hospitals or from hospitals to physicians’ offices. Low levels of health information exchange in the marketplace20,21 reduce the potential value of these systems and may have a dampening ef- fect on adoption. From a policy perspective, our data suggest that rewarding hospitals — especially financially vul- nerable ones — for using health information tech- nology may play a central role in a comprehensive approach to stimulating the spread of hospital electronic-records systems. Creating incentives for increasing information-technology staff and har- monizing information-technology standards and creating disincentives for not using such technol- ogy may also be helpful approaches. Some providers, such as the VHA, have success- fully implemented electronic-records systems. VHA hospitals have used electronic health records for more than a decade with dramatic associated im- provements in clinical quality.22,23 Their medical records are nearly wholly electronic, and includ- ing them in our analyses led to a doubling of our count of U.S. hospitals with a comprehensive sys- tem. Some developed countries, such as the United Kingdom and the Netherlands, have also success- fully spurred adoption of health information tech- 33p9
  • 60. 30 10 50 20 0 Hospitals with EHR Hospitals without EHR Additional reimbursement for HIT use Financial incentives for implementation Technical support for implementation Facilitators Objective EHR evaluation List of certified EHRs AUTHOR:
  • 61. FIGURE: JOB: 4-C H/T RETAKE SIZE ICM CASE EMail Line H/T Combo Revised AUTHOR, PLEASE NOTE: Figure has been redrawn and type has been reset. Please check carefully. REG F Enon 1st 2nd 3rd
  • 62. Jha 2 of 2 04-16-09 ARTIST: ts 36016 ISSUE: Figure 2. Perceived Facilitators of Adoption of Electronic- Records Systems among Hospitals with Systems as Compared with Hospitals without Systems. Hospitals with electronic-records systems include hospitals with a comprehensive system and those with a basic system that includes functionalities for physicians’ notes and nursing assessments. P>0.10 for all comparisons. EHR denotes electronic health record, and HIT health information technology. Copyright © 2009 Massachusetts Medical Society. All rights reserved. Downloaded from www.nejm.org on February 21, 2010 . For personal use only. No other uses without permission. Use of Elec tronic He a lth R ecor ds in U.S. Hospita l s n engl j med 360;16 nejm.org april 16, 2009 1637 nology, although most of their progress has been in ambulatory care. Few countries have yet to make substantial progress in the inpatient setting.24
  • 63. There are limitations to our study. First, al- though we achieved a 63% response rate, the hos- pitals that did not respond to our survey were somewhat different from those that did respond. We attempted to compensate for these differences by adjusting for potential nonresponse bias, but such adjustments are imperfect. Given that non- responding hospitals were more likely to have characteristics associated with lower levels of adoption of electronic health records, residual bias may have led us to overestimate adoption levels. Second, we focused on adoption and could not ac- curately gauge the actual use or effectiveness of electronic-records systems. Third, we did not as- certain whether the systems that were adopted had been independently certified (by parties such as the Certification Commission for Health Informa- tion Technology). Fourth, given low adoption lev- els, we had limited power to identify predictors of the adoption of comprehensive electronic-records systems as compared with basic systems. Finally, we did not ascertain whether users of electronic health records were satisfied with them. In summary, we examined levels of electronic health record adoption in U.S. hospitals and found that very few have a comprehensive electronic sys- tem for recording clinical information and that only a small minority have even a basic system. However, many institutions have parts of an elec- tronic-records system in place, suggesting that policy interventions could increase the prevalence of electronic health records in U.S. hospitals faster than our low adoption levels might suggest. Criti- cal strategies for policymakers hoping to promote
  • 64. the adoption of electronic health records by U.S. hospitals should focus on financial support, in- teroperability, and training of information tech- nology support staff. Supported by grants from the Office of the National Coordinator for Health Information Technology in the Department of Health and Human Services and the Robert Wood Johnson Foundation. Dr. Jha reports receiving consulting fees from UpToDate; Drs. Donelan and Rao, receiving grant support from GE Corporate Healthcare; and Dr. Blumenthal, receiving grant support from GE Corporate Healthcare, the Macy Foundation, and the Office of the National Coordinator for Health Information Technology in the Department of Health and Human Services and speaking fees from the FOJP Service Corporation and serving as an adviser to the presidential campaign of Barack Obama. He has been named Na- tional Coordinator for Health Information Technology. No other potential conflict of interest relevant to this article was reported. We thank our expert consensus panel for their assistance in conducting this research and Paola Miralles of the Institute for Health Policy for assistance in the preparation of an earlier ver- sion of the manuscript. References Smith C, Cowan C, Heffler S, Catlin A. 1. National health spending in 2004: recent slowdown led by prescription drug spend- ing. Health Aff (Millwood) 2006;25:186-
  • 65. 96. McGlynn EA, Asch SM, Adams J, et al. 2. The quality of health care delivered to adults in the United States. N Engl J Med 2003;348:2635-45. Jha AK, Li Z, Orav EJ, Epstein AM. 3. Care in U.S. hospitals — the Hospital Quality Alliance program. N Engl J Med 2005;353:265-74. Chaudhry B, Wang J, Wu S, et al. Sys-4. tematic review: impact of health informa- tion technology on quality, efficiency, and costs of medical care. Ann Intern Med 2006;144:742-52. Blumenthal D, Glaser JP. Information 5. technology comes to medicine. N Engl J Med 2007;356:2527-34. Jha A, Ferris T, Donelan K, et al. How 6. common are electronic health records in the United States? A summary of the evi- dence. Health Aff (Millwood) 2006;25: w496-w507. Schoen C, Osborn R, Huynh PT, Doty 7. M, Peugh J, Zapert K. On the front lines of care: primary care doctors’ office sys- tems, experiences, and views in seven countries. Health Aff (Millwood) 2006; 25:w555-w571.
  • 66. DesRoches CM, Campbell EG, Rao 8. SR, et al. Electronic health records in am- bulatory care — a national survey of phy- sicians. N Engl J Med 2008;359:50-60. Cutler DM, Feldman NE, Horwitz JR. 9. U.S. adoption of computerized physician order entry systems. Health Aff (Millwood) 2005;24:1654-63. Laschober M, Maxfield M, Lee M, Ko-10. vac M, Potter F, Felt-Lisk S. Hospital re- sponses to public reporting of quality data to CMS: 2005 survey of hospitals. Wash- ington, DC: Mathematica, October 12, 2005. Furukawa MF, Raghu TS, Spaulding 11. TJ, Vinze A. Adoption of health informa- tion technology for medication safety in U.S. hospitals, 2006. Health Aff (Millwood) 2008;27:865-75. Healthcare Information and Manage-12. ment Systems Society (HIMSS). 2002 Hot topic survey. Chicago: HIMSS Analytics, 2002. Forward momentum: hospital use of 13. information technology. Chicago: Ameri- can Hospital Association, 2005. Ash JS, Gorman PN, Seshadri V, Hersh 14. WR. Computerized physician order entry in U.S. hospitals: results of a 2002 survey.
  • 67. J Am Med Inform Assoc 2004;11:95-9. Key capabilities of an electronic health 15. record system. Washington, DC: Institute of Medicine, 2003. Blumenthal D, DesRoches C, Donelan 16. K, et al. Health information technology in the United States: the information base for progress. Princeton, NJ: Robert Wood Johnson Foundation, 2006. Scott JT, Rundall TG, Vogt TM, Hsu J. 17. Kaiser Permanente’s experience of imple- menting an electronic medical record: a qualitative study. BMJ 2005;331:1313-6. Simon SR, Kaushal R, Cleary PD, et al. 18. Correlates of electronic health record adoption in office practices: a statewide survey. J Am Med Inform Assoc 2007; 14:110-7. Sequist TD, Cullen T, Hays H, Taualii 19. MM, Simon SR, Bates DW. Implementa- tion and use of an electronic health rec- ord within the Indian Health Service. J Am Med Inform Assoc 2007;14:191-7. Copyright © 2009 Massachusetts Medical Society. All rights reserved. Downloaded from www.nejm.org on February 21, 2010 . For personal use only. No other uses without permission.
  • 68. n engl j med 360;16 nejm.org april 16, 20091638 Use of Elec tronic He a lth R ecor ds in U.S. Hospita l s Adler-Milstein J, McAfee AP, Bates 20. DW, Jha AK. The state of regional health information organizations: current activi- ties and financing. Health Aff (Millwood) 2008;27:w60-w69. Adler-Milstein J, Bates DW, Jha AK. 21. Update on regional health information organizations: progress but critical work remains. Health Aff (Millwood) 2009;28: 483-92. Jha AK, Perlin JB, Kizer KW, Dudley 22. RA. Effect of the transformation of the Veterans Affairs health care system on the quality of care. N Engl J Med 2003; 348:2218-27. Perlin JB. Transformation of the US 23. Veterans Health Administration. Health Econ Policy Law 2006;1(Pt 2):99-105. Jha AK, Doolan D, Grandt D, Scott T, 24. Bates DW. The use of health information technology in seven nations. Int J Med In- form 2008;77:848-54. Copyright © 2009 Massachusetts Medical Society. Copyright © 2009 Massachusetts Medical Society. All rights reserved.
  • 69. Downloaded from www.nejm.org on February 21, 2010 . For personal use only. No other uses without permission. O r i g i n a l A r t i c l e s Authors alone are responsible for opinions expressed in the contribution and for its clearance through their federal health agency, if required. M IL IT A R Y M E D IC IN E, 179, 10:1090,2014 P r e d i c t o r s o f A r m y N a t i o n a l G u a r d a n d R e s e r v e M e m b e r s ’ U s e o f V e t e r a n H e a l t h A d m in i s t r a t io n H e a l t h C a r e A f t e r D e m o b ili z in g F r o m O E F / O I F D e p l o y m e n t Alex H. S. Harris, PhD*; Cheng Chen, MA*; Beth A. Mohr, M S f; Rachel Sayko Adams, PhD, M P H f; Thomas V. Williams, PhD f; Mary Jo Larson, PhD, M P A f ABSTRACT This study described rates and predictors o f Army National Guard and Army Reserve members’ enrollment in and utilization of Veteran Health Administration (VHA) services in the 365 days following demobiliza- tion from an index deployment. We also explored regional and VHA facility variation in serving eligible members in their catchment areas. The sample included 125,434 Army National Guard and 48,423 Army Reserve members who demobilized after a deployment ending between FY 2008 and FY 2011. Demographic, geographic, deployment, and Military Health System eligibility were derived from
  • 70. Defense Enrollment Eligibility Reporting System and “Contingency Tracking System” data. The VHA National Patient Care Databases were used to ascertain VHA utiliza- tion and status (e.g., enrollee, TRICARE). Logistic regression models were used to evaluate predictors o f VHA utilization as an enrollee in the year following demobilization. Of the study members demobilizing during the observa- tion period, 56.9% of Army National Guard members and 45.7% of Army Reserve members utilized VHA as an enrollee within 12 months. Demographic, regional, health coverage, and deployment-related factors were associated with VHA enrollment and utilization, and significant variation by VHA facility was found. These findings can be useful in the design of specific outreach efforts to improve linkage from the Military Health System to the VHA. INTRODUCTION Since September 11, 2001, more than 2.2 million members of the U.S. Armed Forces have served in the Operation Enduring Freedom (OEF) in Afghanistan and Operation Iraqi Freedom (OIF) in Iraq.1 The length and intensity of these operations, repeat deployments, as well as advancements in battlefield medicine, and increases in military members sur- *Center for Innovation to Implementation (MPD: 152), Veterans Affairs Palo Alto Health Care System, 795 Willow Road, Menlo Park, CA 94025. t Institute for Behavioral Health, Heller School for Social Policy and Man- agement, Brandeis University, 415 South Street, Waltham, MA 02454-9110. ^Methods, Measures, and Analyses, Defense Health Cost Assessment
  • 71. and Program Evaluation, Department of Defense, Defense Health Agency, 7700 Arlington Boulevard, Suite 5101, Falls Church, VA 22042-5101. This research has been conducted in compliance with all applicable federal regulations governing the protection of human subjects. Dr. Thomas V. Williams and Dr. Diana D. Jeffery are the DHA/DOD Government Pro- ject Managers. The opinions and assertions herein are those of the authors and do not necessarily reflect the view of the U.S. Department of Defense, Veterans Health Administration, or National Institutes of Health, doi: 10.7205/MILMED-D-13-00521 viving with serious injuries, including traumatic brain injury, have placed tremendous demands on returning warriors, their families, and the health care systems of the Department of Defense (DoD) and Veterans Health Administration (VHA).2-5 Additionally, many service members return from deployments with ongoing psychological health problems, including post-traumatic stress disorder, depression, and sub- stance use problems.6-10 Of the military members deployed to Iraq and Afghanistan as of 2010, roughly half have been members of the Army; with the Reserve Component (RC), specifically Army National Guard (ARNG) and Army Reservists (AR), com- prising almost 44% of Army deployments.1 RC members receiving orders to deploy and activating under Title 10
  • 72. authority are offered TRICARE health insurance coverage and free health care through the Military Health System (MHS) operated by the DoD, although co-pays may be required for services obtained outside the MHS. On return from deployment, RC members go through a requirement- based demobilization process that is designed to ensure that they get the services and assistance they need, including 1090 M ILITARY M ED ICIN E, Vol. 179, October 2014 Predictors o f Army National Guard and Reserve Members Linkage to the VHA medical, dental, and behavioral health assessments, assis- tance in areas of identified need (e.g., vocational, finan- cial, personal), offered time-limited MHS insurance (e.g., TRICARE Reserve Select), and information about their rights and benefits including those provided by VHA. Combat veterans include members who served on active duty in an area of combat operations after 1998 and who were discharged under other than dishonorable conditions. The National Defense Authorization Act of 2008 (Public Law 110-181) entitles all combat veterans, including those in the RC, who meet minimum duty requirements up to 5 years of at least VHA Priority Group 6 status, which includes full access to VHA’s medical benefits package and free VHA services for conditions potentially related to service in a war zone. To rationalize the allocation of resources, VHA has established Priority Groups that are determined primarily by a member’s degree of service-related injury or disability, income, and other service characteristics (http://www.va.gov/healthbenefits/ resources/priority_groups.asp).
  • 73. This study examines rates and predictors of RC members’ enrollment and utilization of VHA services through this entitlement. RC members are eligible to enroll in VHA immediately after demobilization, but regular Army mem- bers cannot enroll in the VHA until they are discharged from military service, often years after deployments. Therefore, RC members, the focus of this study, must be considered separately from regular Army in understanding the predictors and timing of VHA enrollment and utilization. As with other transitions or hand offs in health care, the transition from the DoD to civilian life and potential utiliza- tion of VHA services is fraught with threats to continuity of care. Although “seamless transitions” between the DoD and VHA remain the stated goal, many factors continue to con- tribute to suboptimal communication and care coordination between the two systems, including challenges of sharing medial record information, long wait times for determination of benefits, and geographic accessibility.1112 As a heterogeneous group, demobilized RC members may or may not return to civilian employment, regain private health insurance, or receive medical care through private programs. Some RC members enroll for and receive services from VHA as soon as they are eligible and others do not make the transi- tion. Some members who do not enroll for and receive VHA services have simply chosen other good options for their health care needs. However, other members do not engage with the VHA system for less positive reasons including lack of knowl- edge of benefits, frustration with the enrollment process, and perceptions of low-quality care.5,13,14 Also, stigma exists among combat veterans regarding treatment seeking in gen- eral, particularly for mental health problems.15-17 Few studies have examined transitions from the DoD to VHA for OEF/OIF service members, and none have focused
  • 74. specifically on RC members. Copeland et al18 examined 994 service members (Active Duty, Guard, and Reserve) who were traumatically injured and medically discharged from one inpatient DoD trauma treatment facility. The service members were followed to determine the rate, predictors, and patterns of subsequent VHA utilization, even though not all were discharged from the military. From this sample, 23% used VHA services as an enrollee in the 2-year observation period. Members wounded in action had longer transition times to VHA, whereas those with bums had shorter transi- tion times. These data are difficult to interpret because not all members of the sample had been discharged from the mili- tary and therefore might not have been eligible for VHA services as an enrollee. In another study, Randall13 determined that the length of time to obtain VHA services at two VHA Medical Centers for 376 OEF/OIF combat service members who left active ser- vice averaged 3.8 months. Respondents were from all branches and cited several factors that impeded them from enrolling in VHA sooner, including not knowing about bene- fits, distance and transportation barriers, viewing help-seeking as a sign of weakness, and negative perceptions about the quality of care provided in VHA. Because all service members of the sample received VHA services, predictors of linkage to the VHA could not be examined. The VHA Office of Public Health reported that between October 2001 and December 2012, 56% (n = 899,752) of the more than 1.6 million OEF/OIF/Operation New Dawn com- bat veterans from all branches of the military who became eligible for VHA services eventually enrolled for and utilized VHA services.19 Of these, 688,414 were RC members of whom 55% utilized VHA services.19 However, little is known about the individual, geographic, or system factors that predict
  • 75. transitions from DoD to VHA care among RC members. Data on the predictors and locations of poor linkage are essential to the effective design and targeting of outreach and quality improvement efforts. Thus, the purpose of this study of RC members was to describe rates and predictors of any utilization as an enrollee of VHA health care in the 365 days after the demobilization date following an index deployment ending in FY 2008-FY 2011. Although prior studies have estimated that on average half of eligible veterans eventually make use of VHA ser- vices,19'20 the present study’s ability to track a large cohort of returning RC members and to examine predictors of linkage to the VHA within 1 year of their demobilization from deploy- ment is unique. Further, we explored regional and VHA facil- ity variability in enrolling and serving eligible veterans in their catchment areas. Information about patient and facility-level characteristics associated with linkage to the VHA after demo- bilization can be used by the DoD and VHA to develop quality improvement efforts to design organizations and systems of care more likely to increase linkage to VHA facilities among returning OEF/OIF combat veterans. METHODS This study was part of the Substance Use and Psychological Injury Combat study (SUPIC), a longitudinal, observational MILITARY MEDICINE, Vol. 179, October 2014 1091 Predictors o f Army National Guard and Reserve Members Linkage to the VHA study of Army service members returning from deployment, funded by the National Institute on Drug Abuse and con-
  • 76. ducted with the sponsorship from the Defense Health Agency/DoD. SUPIC is designed to study postdeployment health outcomes among Army members utilizing merged administrative data systems of the DoD and VHA. The SUPIC cohort is inclusive of Active Duty and RC members, but analyses are stratified by these components, and this study focuses only on those in the RCs. This study uses a prospective design to examine one key outcome associated with OEF/OIF deployment, successful linkage to the VHA to receive entitlement health care services after demobiliza- tion. Members who demobilize from a combat deployment became eligible to enroll for VHA under Public Law 110- 181, the National Defense Authorization Act for Fiscal Year 2008 and previous authorizations. S tu d y S e t tin g VHA is composed of over 1,700 sites of care, hierarchically organized into 140 major facilities in 21 Veterans Integrated Service Networks. VHA serves over 6 million veterans each year through integrated and comprehensive outpatient, resi- dential, and inpatient services, including specialized pro- grams for a host of issues of particular concern for Veterans (http://www.va.gov/health/programs/index.asp). Members of the RC become eligible to enroll after a qualifying index deployment (i.e., called to service by federal order, served the entire period of the order, released under Honorable or General Under Honorable conditions). Unlike other VHA utilization studies, SUPIC prospectively identifies a complete VHA eligible population by selecting a cohort through DoD records. The SUPIC deployment cohort is tracked longitudi- nally to observe VHA enrollment, and utilization as an enrollee, in one of the VHA facilities in the United States. S a m p le
  • 77. As a part of SUPIC, this study used the Defense Enrollment Eligibility Reporting System, within the MHS Data Reposi- tory, and the Contingency Tracking System of the Defense Manpower Data Center to identify RC members who had deployed to OEF/OIF countries (Iraq, Afghanistan, Qatar, and Kuwait), and who had demobilization dates associated with an index deployment end date between October 1, 2007 and September 30, 2011 (FY 2008-FY 2011). Among the one-third of members who had multiple deployments during the observation period, we chose an index deployment by selecting the first deployment ending in the study window that could be matched to a completed postdeployment health assessment (PDHA), or the first deployment ending in the study window for those without a completed PDHA. Service members were excluded if their deployments did not include OEF/OIF countries. Additional details about the sample development, matching of PDHAs to deployments, and selec- tion of the index deployment are described in detail else- where.21 To be included in the analysis of linkage to a particular VHA facility, we further restricted the sample to those with a valid postdemobilization civilian zip code in the United States. O u tc o m e The outcome for this study was the receipt of any outpatient, inpatient, or residential care from a VHA facility as an enrollee (i.e., not TRICARE or other sharing arrangement) at least once during the 365 days after the index demobiliza- tion date. We identified this utilization using the VHA admin- istrative data including the VHA Enrollment File and National Patient Care Databases. P r e d ic t o r V a ria b le s
  • 78. Deployment record information was derived from the Con- tingency Tracking System and demographic characteristics at the start and end of deployment and demobilization dates were derived from the Defense Enrollment Eligibility Reporting System. The following variables (measured at start of index deployment unless indicated) were used as predic- tors of postdemobilization VHA utilization: age, gender, probable serious injury during deployment (defined as receiv- ing inpatient services within a major MHS hospital after deployment), deployment again in the postindex year, postde- ployment enrollment DoD provided health insurance (i.e., PRIME/TRICARE Reserve Select (TRS)) in the postindex year, number of deployments before the index deployment, length of index deployment in months, rank, race, marital status, region of residence at demobilization, and fiscal year of deployment end date (FY 2008-FY 2011). Other predictors derived from the VA Enrollment File and National Patient Care databases were pre- and postindex deployment VHA utilization as a nonenrollee (e.g., TRICARE) and preindex deployment VHA utilization as an enrollee (presumably eligi- ble through demobilization from a previous deployment or active duty discharge). Driving time of the members’ postdemobilization residential zip code to the nearest VHA facility with primary care services was determined from the VHA Planning System Support group data. VHA Planning System Support Group data provide driving times for VHA patients within each 5-digit zip code to the nearest VHA facil- ity with primary care services. Because postdemobilization zip codes for the entire sample were at the 3-digit level, we assigned the median driving time from distribution of VHA patients in the underlying 5-digit zip codes to all individuals in the sample with the same 3-digit stem. S ta tis t ic a l A n a ly s e s Mixed-effects logistic regression models were used to predict
  • 79. VHA utilization as an enrollee in the 365 days following the date of demobilization from the index deployment, with a random effect for VHA facility (N = 140) to account for the clustering of members within a facility. All candidate 1092 MILITARY MEDICINE, Vol. 179, October 2014 Predictors o f Army National Guard and Reserve Members Linkage to the VHA predictors were included and regression diagnostics, particu- larly examination of variance inflation factors, were performed. For continuous variables such as age, assumptions regarding linearity were evaluated and found to be reasonable. Analyses were stratified by com ponent (i.e., ARNG and AR) because of the presence of significant interaction terms. Because o f the large size o f the sample, we emphasize the magnitude and confidence intervals o f effects rather than p values. Describing VHA Facility-Level Variation in “Yield” From the Local Population To explore VHA facility-level variation in enrollm ent and utilization o f VHA services, we assigned each m em ber in the sample to one o f the 140 major VHA facilities with the shortest drive time by the abovem entioned method. Note that all o f VHA medical centers, clinics, and other settings of care are organized into one o f these 140 organizational units. This is the level o f aggregation that is used for most system m onitoring and perform ance m easurement. Then, using the m ultivariate m ixed-effects regression models predicting utilization and controlling for other individual characteristics, we estim ated the proportion (95% confidence interval [Cl]) o f mem bers in each VHA facility’s catchment
  • 80. area that received VHA services as an enrollee. The purpose o f these analyses is to describe variation in facility-level yield from the local population o f eligible veterans, and to identify high and low outliers. Protection of Human Subjects and Data Security To ensure protection o f human subjects, Brandeis University’s Com m ittee for Protection o f Human Subjects, the Insti- tutional Review Boards o f the Stanford University and T A B L E I. Characteristics of ARNG (N = 125,434) and Army Reserve Members (N = 48,423), Returning from Deployment FY 2008- FY 2011 Characteristic" National Guard N (%) Reserve N (%) Female 10,887 (8.68) 7,316(15.11) Married 63,422 (50.56) 63,422 (50.56) Race/Ethnicity Non-Hispanic White 95,155 (75.86) 95,155 (75.86) Non-Hispanic African-American 14,877 (11.86) 14,877 (11.86) Hispanic 9,963 (7.94) 9,963 (7.94) Asian or Pacific Islander 3,358 (2.68) 3,358 (2.68) American Indian/Alaskan Native 1,235 (0.98) 1,235 (0.98) Other 846 (0.67) 846 (0.67) Received Preindex6 VHA Services as Enrollee 35,939 (28.65) 35,939 (28.65) Received Preindex VHA Services as Nonenrollee 11,708 (9.33) 11,708 (9.33) Received Postindex VHA Services as Nonenrollee 4,583 (3.65) 4,583 (3.65) Probable Serious Injury During Index Deployment 4,856 (3.87) 4,856 (3.87)
  • 81. Redeployed in the Postindex Year 2,411 (1.92) 2,411 (1.92) PRIME/TRSC After Index Deployment 50,364(40.15) 50,364(40.15) Rank Enlisted, Junior 67,173 (53.55) 67,173 (53.55) Enlisted, Senior 45,773 (36.49) 45,773 (36.49) Officer, Junior 7,591 (6.05) 7,591 (6.05) Officer, Senior 2,800 (2.23) 2,800 (2.23) Warrant Officer 2,097(1.67) 2,097 (1.67) Residence Region at Demobilization West 18,429(14.69) 18,429(14.69) Midwest 31,870(25.41) 31,870 (25.41) Northeast 21,029 (16.76) 21,029(16.76) South 54,106 (43.14) 54,106 (43.14) Cohortrf 2008 54,106 (43.14) 8,231 (17.00) 2009 54,106(43.14) 11,531 (23.81) 2010 17,831 (14.22) 15,625 (32.27) 2011 27,723 (22.10) 13,036 (26.92) Mean (SD) Mean (SD) Age in Years 8,231 (17.00) 8,231 (17.00) Number of Deployments Before Index Deployment 11,531 (23.81) 11,531 (23.81) Length of Index Deployment in Months 15,625 (32.27) 15,625 (32.27) Drive Time (Minutes) to Nearest VHA Facility 13,036 (26.92) 13,036 (26.92) “Measured at start o f index deployment unless indicated. '’Index refers to a deployment ending in FY 2008-FY 2011 and selected for analysis. “DoD provided
  • 82. health insurance. “'Cohort refers to fiscal year of index deployment end date. MILITARY MEDICINE, Vol. 179, October 2014 1093 Predictors o f Army National Guard and Reserve Members Linkage to the VHA T A B L E II. Predictors of VHA Utilization as an Enrollee in the 365 days Postdemobilization for 48,423 National Reserve Members and 125,434 National Guard Members Parameter" National Reserve OR* (95% Cl) National Guard OR* (95% Cl) Age in Years 1.011 (1.008, 1.014) 1.020(1.018. 1.022) Female 1.329(1.258, 1.404) 1.241 (1.188, 1.296) Preindex" VHA Services as Enrollee 4.210 (4.002,4.430) 2.737 (2.656, 2.820) Preindex VHA Services as Nonenrollee 1.558 (1.465, 1.656) 1.706(1.627, 1.788) Postindex VHA Services as Nonenrollee 2.096 (1.876,2.341) 1.857(1.727, 1.996) Probable Serious Injury During Index Deployment 1.282(1.159,1.417) 1.103 (1.033, 1.178) Deployed Again in the Postindex Year 0.574 (0.512,0.643) 0.604 (0.553, 0.659) PRIME/TRS^ Enrollment in the Postindex Year 0.963 (0.924, 1.005) 1.033 (1.006, 1.060) Number o f Deployments Before Index Deployment 0.809 (0.784, 0.834) 0.853 (0.835,0.872) Length of Index Deployment in Months 1.012(1.006, 1.018) 1.014 (1.010, 1.019) Drive Time (Minutes) to Nearest VHA Facility 0.997
  • 83. (0.995,1.000) 0.997 (0.996, 0.999) Rank (Junior Enlisted as Reference) Enlisted, Senior 0.778 (0.738, 0.820) 0.797 (0.771,0.823) Officer, Junior 0.581 (0.536, 0.629) 0.575 (0.545,0.606) Officer, Senior 0.481 (0.437,0.528) 0.471 (0.431,0.514) Warrant Officer 0.620 (0.525,0.733) 0.597 (0.542,0.658) Race (Non-Hispanic White Reference) American Indian/Alaskan Native 0.947 (0.776,1.156) 0.854 (0.755, 0.966) Asian or Pacific Islander 0.959 (0.865, 1.063) 1.040(0.960, 1.126) Non-Hispanic African-American 1.092(1.030, 1.157) 1.103(1.061, 1.148) Hispanic 1.115(1.040, 1.195) 1.063 (1.008, 1.121) Other 0.906 (0.695,1.182) 1.004(0.868, 1.162) Married 0.962 (0.922, 1.005) 1.012(0.986, 1.037) Residence Region at Demobilization (West Reference) Midwest 1.162 (0.987,1.369) 1.337 (1.107,1.616) Northeast 1.007 (0.843, 1.204) 1.107 (0.866, 1.383) South 0.981 (0.843, 1.142) 1.336(1.116, 1.599) Cohort" (2008 Reference) 2009 1.193 (1.121,1.269) 1.104(1.057,1.152) 2010 1.023 (0.964, 1.086) 0.935 (0.899, 0.973) 2011 0.900 (0.847, 0.957) 0.767 (0.735,0.801) "Measured at start of index deployment unless indicated. ^Adjusted for all characteristics shown. "Index refers to a deployment ending in FY 2008-FY 2011 and selected for analysis. *DoD provided health insurance. "Cohort refers to fiscal year of index deployment end date.
  • 84. the VA Palo Alto Health Care System, and the Human Research Protection Program at the Office of the Assistant Secretary of Defense for Health Affairs/Defense Health Agency granted approval. The Defense Health Agency Pri- vacy and Civil Liberties Office executed an annual data shar- ing agreement. RESULTS Descriptive statistics for the samples are presented in Table I. Of the 125,434 ARNG members who demobilized during the observation period and met other eligibility criteria, 71,322 (56.9%) utilized VHA as an enrollee within 12 months of their index demobilization date. Table II presents regression results for predictors of ARNG members’ VHA utilization as an enrollee. These results may be helpful in targeting and shaping enrollment efforts for increase enrollment and utilization of VHA services. Significant positive predictors were older age; female gender; receiving VHA services as an enrollee before the index deployment; receiving VHA services as a nonenrollee (e.g., TRICARE) before the index deployment; receiving VHA services as a nonenrollee (e.g., TRICARE) in the year after the index deployment; probable serious deployment-related injury; DoD provided health insurance (TRS or PRIME) selection or enrollment in the postindex year; length of index deployment; being Asian/ Pacific Islander, Hispanic, African-American, or “other” race/ethnicity compared to non-Hispanic white; residence after demobilization in the Midwest or South compared to the West region; and being a member of the FY 2009 cohort compared to the FY 2008 cohort. Significant negative predictors of ARNG members VHA utilization as an enrollee were deployment again in the postdemobilization year, number of deployments before index deployment; drive time to nearest VHA facility; rank
  • 85. of Senior Enlisted, Junior Officer, Senior Officer or Warrant Officer compared to Junior Enlisted; being American Indian/ Alaskan native; and demobilization in 2010-2011 compared to 2008. Of the 48,423 AR members who demobilized, 22,118 (45.7%) utilized VHA as an enrollee within 12 months of the index demobilization date. Table II presents regression results for predictors of AR members’ VHA utilization as an enrollee. Similar to ARNG, significant positive predictors 1094 MILITARY MEDICINE, Vol. 179, October 2014 Predictors o f Army National Guard and Reserve Members Linkage to the VHA Utilization of VHA Services as an Enrollee by National Guard Members in the Catchment Areas of 140 VHA Facilities FIG UR E 1. Percent of National Guard Members with any VHA utilization as an enrollee in a VHA facility catchment area. Utilization measured in the year following member’s return from a FY 2008-FY 2011 deployment. Adjusted for characteristics shown in Table II. were older age, female gender, receiving VHA services as an enrollee before the index deployment, receiving VHA ser- vices as a nonenrollee (e.g., TRICARE) before the index deployment, receiving VHA services as a nonenrollee in the year after the index deployment, probable serious deployment- related injury, DoD provided health insurance (TRS or PRIME) selection or enrollment in the postindex year, length of index deployment, being Hispanic or African-American
  • 86. compared to non-Hispanic White, residence in the Midwest or South compared to the West region, and being a member of the FY 2009 cohort compared to the FY 2008 cohort. Significant negative predictors of Army Reserve Members VHA utilization as an enrollee were deployment again in the postdemobilization year; number of deployments before index deployment; longer drive time to the nearest VHA facility; rank of Senior Enlisted, Junior Office, Senior Officer or War- rant Officer compared to Junior Enlisted; being an American Indian or Alaskan Native compared to non-Hispanic White; and demobilization in 2010-2011 compared to 2008. The percent (95% Cl) of ARNG and AR members in each VHA facility’s catchment area who received any VHA services as an enrollee are presented in Figures 1 and 2, respectively. The results are adjusted for the characteristics shown in Table II. As can be seen, substantial variation exists (as well as variation in the Cl widths driven by differences in the underlying sample sizes). For ARNG members, facility- level utilization in the year following the index deployment ranged from 31% to 89%. For AR members facility-level utilization ranged from 27% to 81%. The percents for facili- ties with nonoverlapping C l’s are significantly different. DISCUSSION This descriptive analysis found that 56.9% of ARNG and 45.7% of AR members utilized VHA services as an enrollee within 365 days of demobilization from an index deployment to Iraq or Afghanistan. This implies that if linkage to the VHA does occur, most of it will occur within the first year of return from deployment. We plan future analysis to follow this cohort up to 3 years from deployment to determine if linkage is delayed for some members, and if so, what charac- teristics are associated with delayed linkage. Perhaps the most