2. proo
f
proo
f
Introduction
Financial statements are an important manage-
ment tool. When correctly prepared and properly
interpreted, they contribute to an understanding
of the current financial condition, problems, and
possibilities of a company.
This explanation has been prepared to help
financial and nonfinancial managers and owners
make better use of the information in
financial statements.
Specifically, this brochure describes five
financial statements:
The Balance Sheet, which is sometimes
referred to as the Statement of Financial
Condition or Statement of Financial
Position.
The Income Statement, which
is sometimes referred to as the
Statement of Income, Statement
of Operations or the Profit and
Loss Statement.
The Statement of Cash Flows.
The Statement of Comprehensive Income.
3. The Statement of Stockholders’ Equity, also
called the Statement of Changes in Stockholders’
Equity. If the only change in the equity accounts
is in retained earnings, this statement may be
called a Statement of Retained Earnings or simply
included on the face of the Income Statement.
These statements are prepared and presented
using technical terms and rules that are becoming
increasingly complex. Interpretation of these
statements may be a formidable challenge to
many managers and owners.
We firmly believe that — no matter how
technically correct they are — financial
statements are not useful unless they
are actually used in making business
decisions. When the statements
“gather dust” because managers
and owners do not understand what
they are saying, we feel an obligation
to help. We hope this guide to Reading
and Understanding Financial Statements will
help you to use financial statements in making
decisions, monitoring your business, and plan-
ning for future growth.
Income Statement
Summary of activity
4. for a period of time
Balance Sheet
Financial condition
at a point in time
Balance Sheet
Financial condition
at a point in time
proo
f
proo
f
proo
f
proo
f
◆2
Reporting of
Business Activity
Beginning of Year
January 1, 2009
End of Year
December 31, 2009
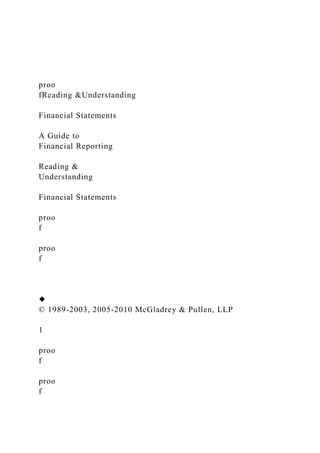
5. The Balance Sheet is a “photograph”: It represents, at a
moment in time, the financial position of the business
entity. It needs to be compared to other “photographs”
to provide meaningful information on changes in finan-
cial position. For that reason, the balance sheet as of the
end of one or more preceding years is usually presented
with the balance sheet as of the end of the current year.
The other primary financial statements — the Income
Statement, Statement of Cash Flows, Statement of
Comprehensive Income, and Statement of Stockholders’
Equity — present a summary of activities over a period
of time, usually a fiscal quarter or year. The Income
Statement presents revenues less associated expenses and
the resulting net income. The Statement of Cash Flows
provides information about the sources and uses of cash,
and the Statement of Comprehensive Income and the
Statement of Stockholders’ Equity show changes in items
contained in the equity section of the balance sheet.
How Do Financial Statements Relate to the Passage of Time?
Statement of
Cash Flows
Summary of activity
for a period of time
Statement of
Stockholders’ Equity
Summary of activity
for a period of time
6. Statement of
Comprehensive Income
Summary of activity
for a period of time
Balance Sheet
Financial condition
at a point in time
Income Statement
Summary of activity
for a period of time
proo
f
proo
f
proo
f
proo
f
◆3
The Balance Sheet (or Statement of Financial Position/
7. Condition) is so named because it represents the
following equation:
At any point in time this basic equation holds,
although the amounts assigned to the individual
elements will fluctuate.
Assets increase or decrease as resources are obtained,
disposed of, become more or less valuable, or are used
up (expensed) in the course of operations.
Liabilities increase or decrease as obligations to
suppliers, lenders, and other creditors are incurred or
repaid. In some cases, the amounts of liabilities need
to be estimated (referred to as “accruals”) and are
subject to adjustment (upward or downward) in later
periods. In limited circumstances, recorded liabilities
are contingent upon the occurrence of future events,
and may not be paid in part or full.
Equity increases or decreases as a result of income or
loss from operations of the business. It also increases
when the owners contribute capital to the business, and
decreases when the capital is withdrawn or dividends
are paid.
The Income Statement (or Statement of Operations) is
a summary of revenues and expenses, the latter usually
broken down (or summarized) by major categories.
Income from operations is an important measure of
the entity’s performance, since it represents the pretax
income earned (or loss incurred) from the core operations
of the business, before considering certain financial
costs, other nonoperating items, and extraordinary
gains or losses.
8. Other income and expense include financial costs
(interest expense) and other items that are not directly
related to the primary purposes of the business.
Revenue (or sales)
– Cost of sales
= Gross profit (or gross margin)
– Selling expenses
– Administrative expenses
= Income from operations
+/– Other income and expense
– Income taxes
= Income before
extraordinary items
+/– Extraordinary items
= Net income
OVERVIEW: The Balance Sheet
OVERVIEW: The Income Statement
Assets Liabilities
(Resources of = (Amounts owed to
the business) outside creditors)
+
Equity
(Capital provided
9. by owners)
proo
f
proo
f
proo
f
proo
f
◆4
The Statement of Cash Flows reports the sources and
uses of cash for the period, as separated into three
major classifications:
Operations include the cash effects of essentially
all items identified in the Income Statement, such
as sales, costs of sales, operating expenses, and
extraordinary items.
Investing activities include the purchase of property
and equipment or the proceeds from their disposition,
and also certain transactions involving investments in
securities or other nonoperating assets.
Financing activities include debt borrowings and
repayments, as well as the contribution and withdrawal
of equity capital, and the payment of dividends to
owners.
10. Cash provided by or used for operations
+/– Cash provided by or used for investing
activities
+/– Cash provided by or used for financing
activities
= Net increase or decrease in cash
Extraordinary items are defined as those which are
unusual and occur infrequently, and include such
losses as those from natural disasters and expropria-
tion of foreign properties. While not extraordinary
per se, certain other items, including the results of
discontinued operations and the cumulative effects of
changes in accounting principles, are also presented
separately at the bottom of the Income Statement,
where the reader can distinguish them from ongoing
results of operations.
Net income or loss is the all-inclusive “bottom line”
that reflects all economic activity by the enterprise for
the period being reported on (year, quarter, month,
etc.), except for transactions with owners.
OVERVIEW: The Statement of Cash Flows
The Statement of Comprehensive Income applies to
companies whose balance sheet equity includes
certain items such as foreign currency adjustments,
pension liability adjustments, and gains and losses on
certain types of investments. Companies that do not
11. have these items on their balance sheets will not
need to present this statement. Companies that do
have these items on their balance sheets may present
this statement separately or combine it with the
Statement of Income.
OVERVIEW: The Statement of Comprehensive Income
The Statement of Stockholders’ Equity details changes
in the interests of the company’s owners, including
stock issuances, stock repurchases, stock conversions,
dividends paid, other comprehensive income or loss,
and net income or loss. A company is required to
disclose all changes in equity accounts and in the
number of shares outstanding. This can be accom-
plished through disclosure in the footnotes, or as is
often the case, in a separate Statement of
Stockholders’ Equity.
OVERVIEW: The Statement of Stockholders’ Equity
proo
f
proo
f
proo
f
proo
f
12. ◆
In addition to the basic financial statements, most
financial statements which have been prepared for
delivery to third parties (i.e., those outside the report-
ing entity) will have a section of Notes to Financial
Statements.
The Notes to Financial Statements set forth the major
accounting principles used in developing the amounts
reported in the statements (where a choice was made
from among alternative generally accepted accounting
principles or “GAAP”), and also provide additional
details about major balances and transactions. Examples
of the latter include details about
long-term leases, long- and
short-term debt (including
interest rates and maturities),
transactions with related
parties, contingent
liabilities, and
commitments.
Financial reports
may also include
supplementary
schedules, which
provide more detailed infor-
mation about major expense
captions (such as administrative expenses)
or other items appearing in the basic financial
statements. Except in rare instances, the presentation
of supplementary schedules is not required under
generally accepted accounting principles, but repre-
sents a choice made by the preparer of the financial
statements to provide the reader with additional
13. information.
If independent accountants have been associated with
the financial statements, their report will be included
with the statements. The report will identify what pro-
fessional service was provided — an audit, a review,
or a compilation — and indicate what conclusions, if
any, were reached regarding the financial statements.
In the case of an audit, the independent accountant
will provide positive assurances that the financial state-
ments materially “present fairly” the financial position,
results of operations, and cash flows of the company in
accordance with generally accepted accounting princi-
ples, if it can be concluded that this is the case. If the
statements contain a departure from generally accepted
accounting principles, or if the audit was subject to a
scope limitation, or if there is doubt about the entity’s
ability to continue as a going concern — these matters
must also be described in the auditor’s report. In a
review engagement, at best the accountant will express
negative assurance — i.e., that based on performing
limited procedures, nothing came to the accountant’s
attention that would indicate that the financial
statements were not fairly presented. An
accountant performing a compilation
merely assists the company in
assembling the financial
statements, and offers
neither positive nor
negative assurances
14. about whether they are
presented fairly. The level
of assurance offered by the
independent accountant on
supplementary schedules may
be lower than that offered on the
basic financial statements. Thus,
the basic statements may have been
reviewed, and the accountant may have also reviewed
the supplementary information, or alternatively the
accountant may only have compiled the supplementary
data. If the basic financial statements have been audited,
the supplementary information may have also been
subjected to audit procedures, or, if not, the accoun-
tant’s report will note that the supplementary data
have not been audited.
Other Elements of Financial Reports
5
ABC Corporation
Balance Sheets
December 31, 2009 and 2008
Assets 2009 2008
Current Assets
Cash and cash equivalents. . . . . . . . . . . . . . . . . . . . . . . . . . . .
21. proo
f
◆
Current Assets are those assets of a company which
are reasonably expected to be realized in cash, sold,
or consumed during the normal operating cycle of the
business or one year, if less. These assets generally
include cash and cash equivalents such as money
market accounts, certain investments in debt and
marketable equity securities, accounts receivable,
inventories, and certain prepaid expenses such as
insurance.
Property and Equipment are assets of a
durable nature and a relatively long life
that are used in the regular operations of
the business.
Accumulated Depreciation is the aggre-
gate of charges to expense or to write off
the cost of property and equipment over
its estimated useful life. It is the result
of a bookkeeping entry and does not
represent any current cash outlay.
Other Assets may consist of intangibles,
such as goodwill, patents or trademarks;
assets, such as the cash surrender value
of life insurance; and prepaid expenses,
including unexpired multi-year insurance
premiums.
In certain industries, such as real estate, assets are
presented without being classified in the categories
22. shown in this example.
Current Liabilities are those obligations that are
reasonably expected to be paid using current assets.
These liabilities generally include notes payable,
current maturities of long-term debt, accounts
payable, income taxes payable, and accrued
expenses such as salaries and interest.
Long-term Debt is debt less current maturities and
includes those obligations that are not expected to
be paid within one year. Bonds and mortgages are
common long-term liabilities.
Deferred Income Taxes result from differences
between taxable income and accounting income.
Common items giving rise to deferred income taxes
include depreciation methods that are allowed by tax
law but do not match the estimated useful life of the
asset, deferred compensation that is not
deductible until paid but gives rise to
currently reported expense, and certain
prepaid income such as rent received by
the business in advance of the date it is
due, which is deferred to later periods
for accounting purposes, but which is
taxed currently.
Common Stock and Preferred Stock,
if any, represent the ownership interests
in a corporation. The preferred stock
will have preferential rights as to divi-
dends or in the event of liquidation of
the business. Common stock represents
23. the residual ownership interest.
Additional Paid-in Capital is the
difference between the amount of money obtained by
a corporation on the issuance of its own stock and the
par value of the stock.
Retained Earnings are the portions of all the company’s
past earnings that were not distributed to the owners.
Treasury Stock is stock that was once issued by the
company but later was reacquired. Treasury stock
receives no dividends and has no vote while held by
the company.
Total Liabilities and Stockholders’ Equity is always
equal to total assets.
“ Deferred
Income Taxes
result from
differences
between taxable
income and
accounting
income.”
The Balance Sheet in Greater Detail
7
proo
f
26. . . . . . . . . . . . . . $3,120,000 $2,809,000
proo
f
proo
f
proo
f
proo
f
◆9
Sales result when a company provides customers those
products or services that it is in business to sell.
Cost of Goods Sold represents the cost of producing
goods for sale. For example, cost of goods sold in a
manufacturing company is comprised of direct labor,
direct materials, and overhead.
Gross Profit is a measure of the profit
contribution from the sales of products
and/or services, before considering
administrative overhead.
Selling, General and Administrative
Expenses are costs associated with the sale
and delivery of products and the general
costs associated with the operation and
management of a business, other than those
27. charged to cost of goods sold.
Income from Operations is another
measure of profitability, equal to gross
profit less selling, general and administrative
costs.
Other Income and Expense arise from transactions not
related directly to the primary operations of the business.
Items frequently reported in this nonoperating category
are dividend income, interest income, and certain gains
or losses.
Interest Expense refers to interest paid
periodically during the term of a loan by
a borrower to the lender for the use of
money. Interest expense must be separately
stated, usually as a subcategory of other
income and expense.
Income Taxes is an estimate of the amount of
income tax that will eventually be paid, or has
been paid, on the reported earnings.
Extraordinary Items are income or losses
of an unusual and infrequent nature.
Net Income is the “bottom line” measure
of the earnings performance of the company
for the period reported on, after considering
all elements of income and expense.
The Income Statement in Greater Detail
32. Increase (decrease) in cash and cash equivalents . . . . . . . . . . . .
. . . . . . 63,000 (214,000)
Cash and cash equivalents, beginning of year . . . . . . . . . . . . . .
. . 314,000 528,000
Cash and cash equivalents, end of year . . . . . . . . . . . . . . . . . .
. . . . . . $ 377,000 $ 314,000
proo
f
proo
f
proo
f
proo
f
◆11
Operating Activities include all transactions and other
events that are the result of delivering or producing
goods for sale and providing services.
Cash inflows from operating activities include cash
receipts from the sale of goods or services and from
interest and dividend income. Cash outflows for oper-
ating activities include cash payments for the purchase
of inventory, wages and benefits to employees, to
government taxing bodies, as interest to
33. lending institutions, and to various other
suppliers.
Investing Activities include lending
money and collecting on those loans,
acquiring and selling investment securi-
ties, and acquiring and selling produc-
tive assets such as land and equipment.
Cash inflows from investing activities
include principal repayments from bor-
rowers, proceeds from sales of loans
and receipts from sales of assets such
as investment securities or property and
equipment. Cash outflows for investing
activities include loans made, loans
purchased, and payments to acquire assets such as
investment securities or property and equipment.
Financing Activities include obtaining resources from
owners, providing owners with a return on (of) their
investment, obtaining resources from lenders, and
repaying amounts borrowed. Interest on borrowings,
however, is an operating activity.
Cash inflows from financing activities include pro-
ceeds from the issuance of the company’s stock and
from long- and short-term borrowings. Cash outflows
for financing activities include payment of dividends,
cash paid to reacquire the company’s stock, and repay-
ment of amounts borrowed.
The form of the cash flow statement
illustrated on page 10 is the so-called
34. “indirect method” favored by most
companies. However, an alternative
format, the “direct method” is also
acceptable. Under that approach, the
Cash Provided by (Used for) Operating
Activities section will list each major
source or use of cash which corresponds
to major captions in the income statement.
For example, corresponding to sales will
be the cash flow statement caption “Cash
Collected from Customers”; correspond-
ing to cost of sales will be “Cash Paid
to Suppliers”; etc. If the direct method
is used, the cash flow statement (or a supplementary
schedule) will present the reconciliation between net
income and cash from operations — which will closely
resemble the cash from operations section of the state-
ment illustrated on page 10.
“Cash outflows
for investing
activities include
loans made,
loans
purchased . . . .”
The Statement of Cash Flows in Greater Detail
The Statement of Comprehensive Income
Certain companies present the Statement of Compre-
hensive Income. This statement is only presented when
the equity section of the company’s balance sheet
contains adjustments relating to pensions, foreign
35. currencies, or certain types of investments. The changes
in these items from period to period, instead of being
reflected on the income statement as part of net income,
are reflected directly on the balance sheet. The
Statement of Comprehensive Income simply reconciles
the change in these items for the periods presented.
There are a variety of ways that this information can
be presented. It can be simply added to the bottom
of the income statement (which would be retitled the
Statement of Income and Comprehensive Income),
shown as a separate statement, or shown in a statement
reconciling all changes in the equity section of the
balance sheet which would be titled the Statement of
Stockholders’ Equity.
proo
f
proo
f
proo
f
proo
f
◆12
Although the basic financial statements — discussed
in the preceding sections — do present the company’s
financial position, results of operations, and cash flows,
there are other important disclosures, both mandatory
36. and voluntary, that cannot be incorporated on the face
of the statements. For this reason, most complete sets
of financial statements will include a section of notes
after the basic statements. (These are sometimes still
called “footnotes,” a term that is a holdover from a
simpler era when these disclosures were actually
presented at the bottom of the financial statements.)
Certain notes are always found in GAAP financial
statements. For example, the “summary of significant
accounting policies,” usually the first note, identifies
which among equally acceptable GAAP the company
has elected to use (e.g., straight line versus accelerated
depreciation; LIFO versus FIFO inventory costing, etc.).
Other notes will only be presented when conditions
warrant (e.g., details of debt maturities, capital lease
obligations, related party transactions, major customers,
etc.). Finally, some disclosures will appear because
management believes they give useful insight into the
company’s economic prospects (e.g., details of long-
term contracts with customers, summary of key ratios,
financial highlights).
Notes are considered to be an integral part of the basic
financial statements. Thus, standards for accuracy and
clarity apply equally to the notes, and the independent
accountant must apply the same level of service (audit,
review, or compilation) to the notes as to the basic
financial statements themselves. If well-written and
organized, notes should help the user to better under-
stand the financial statements and the reporting entity’s
financial and operating prospects. However, because
of the substantial amount of detail they often contain,
the notes do require a careful study by the reader.
Many financial statements also contain a section of
37. supplementary information. Usually this information
is in the nature of additional detail (e.g., the elements
comprising “selling expenses”), although sometimes
it is a recasting of the basic financial statements on an
alternative basis of accounting (such as FIFO inven-
tory costing when the basic statements were prepared
using the LIFO basis). Supplementary information
may have received the same level of attention from the
independent accountant as the basic statements and
notes, or it might have a lesser degree of assurance
associated with it. In either case, the accountants’
report letter(s) will indicate the responsibility they
assume, if any.
Notes to Financial Statements and Supplementar y Schedules
The Statement of Stockholders’ Equity
When both a balance sheet and income statement are
presented, disclosure of all changes in equity accounts
and in the number of shares outstanding during at
least the most recent annual fiscal period presented is
required. There are a number of ways this information
can be presented. Disclosure of these changes may
be made in a separate statement, called the Statement
of Stockholders’ Equity, or may be made in the basic
financial statements or notes thereto. Companies fre-
quently choose to provide a Statement of Stockholders’
Equity with their other financial statements.
The purpose of the Statement of Stockholders’ Equity is
to report the events that caused individual stockholders’
equity accounts to change during the accounting period.
Accordingly, the Statement of Stockholders’ Equity is
dated like the income statement. It covers a period of
38. time. The Statement of Stockholders’ Equity summa-
rizes the changes in the various components of the
stockholders’ equity section of the balance sheet. In
many cases the specific events that caused the change
in one or more stockholders’ equity accounts are of
interest to the financial statement user. The Statement
of Stockholders’ Equity includes stock issuances, stock
repurchases, stock conversions, dividends paid, and
other comprehensive income or loss components which
may be important and useful information to many
readers of the financial statements.
◆13
Ratios To Measure Return on Investments
Measures the annual percentage yield on the investment made
by the owners.
Measures the annual percentage yield on the gross investment in
the business financed collectively by the owners and
creditors. The relationship between the returns on assets and on
equity is indicative of the effect of the business’s
financial leverage — if the leverage is positive, the return on
equity will be greater than the return on assets.
Businesses that perform in this manner make effective use of
debt financing to increase returns to their stockholders.
1. Return on equity
Net income (Income Statement)
Average stockholders’ equity (Balance Sheet)
465,000
39. (5,239,000 + 4,860,000) ÷ 2
Ratio Example*
= 9.2%
2. Return on assets
Ratio Example*
Using the Financial Statements To Analyze the Performance of
the Business
*Figures in examples are from the sample financial statements
presented earlier.
proo
f
proo
f
proo
f
proo
f
The information contained in the basic financial state-
ments and notes can and should be used to provide
insight into the financial strength and earnings capacity
of the business. This extends beyond such single state-
ment captions as “net income,” and necessitates that
relationships between amounts be examined. While
an almost unlimited number of such ratios and compar-
isons are possible, a relatively small group of these
40. are traditionally the object of most readers’ attention.
The nature of the analysis depends on the perspective
of the reader. For example, the short-term note holder
would be primarily concerned with the company’s
ability to pay its current obligations. The holder of
long-term debt might look to both historical and
projected earnings and cash flows. The stockholders,
current and future, would share a viewpoint similar to
that of the long-term debtholder, with perhaps more
concern for earnings (vis-a-vis cash flows) and growth
trends than the creditors might exhibit.
The management of a company is concerned with all
of the above factors and, in addition, needs financial
information that is useful for decision-making purposes.
A selection of the financial ratios that are most often
computed to analyze a business is shown on the
following pages.
Measures the annual percentage yield on the gross investment in
the business financed collectively by the owners and
creditors. The relationship between the returns on assets and on
equity is indicative of the effect of the business’s
financial leverage — if the leverage is positive, the return on
equity will be greater than the return on assets.
Businesses that perform in this manner make effective use of
debt financing to increase returns to their stockholders.
Net income (Income Statement)
Average total assets (Balance Sheet)
= 4.1%
465,000
41. (11,636,000 + 11,004,000) ÷ 2
◆14
Ratios To Measure Safety and Liquidity
1. Net working capital
–
Example*
Current assets (Balance Sheet)
Current liabilities (Balance Sheet)
$2,292,000
$1,924,000
Ratio Example*
= 1.19:1
3. Liabilities to equity ratio**
Total liabilities (Balance Sheet)
Stockholders’ equity (Balance Sheet)
$6,397,000
$5,239,000
Ratio Example*
= 1.22:1
42. 4. Times interest earned
Income before interest and taxes (Income Statement)
Interest expense (Income Statement)
$840,000 + 242,000
$242,000
Ratio
= 4.5 times
Example*
= 1.9 times
*Figures in examples are from the sample financial statements
presented earlier.
**Many analysts refer to this ratio as the “debt to equity ratio”
even though, technically, the term “debt” normally refers to
loans made to
the company and excludes other liabilities.
Another measure of the ability to pay current liabilities as they
mature. A ratio of 1:1 or greater corresponds to
positive net working capital.
Indicates the mix of funding provided by owners (common and
preferred stockholders) and creditors. The greater
the number, the “more leveraged” is the company.
Measures the company’s ability to pay both the interest and the
current principal installments on its outstanding
debt and suggests the degree of safety for creditors concerning
currently due debt service obligations.
43. proo
f
proo
f
proo
f
proo
f
A measure of the shorter-term, more liquid assets available to
meet short-term obligations and serve as a cushion
against unforeseen needs for resources.
$2,292,000
–1,924,000
$ 368,000
2. Current ratio
5. Debt service ratio
Income before interest and taxes (Income Statement)
Interest expense plus amounts of scheduled debt repay-
ments (Income Statement and Statement of Cash Flows)
$840,000 + 242,000
$242,000 + 322,000
Ratio Example*
Measures the ability of a company to cover the payment of
interest to creditors.
44. Current assets (Balance Sheet)
Current liabilities (Balance Sheet)
proo
f
proo
f
proo
f
proo
f
◆15
1. Average collection period
Average accounts receivable (Balance Sheet)
Average daily sales (Income Statement)
(1,178,000 + 1,175,000) ÷ 2
7,934,000 ÷ 365
Ratio Example*
Ratios To Measure Operating Efficiency
1,176,500
21,737
= = 54.1 days
45. Measures the average number of days’ sales that are uncollected
in accounts receivable, providing an idea of how
successful the firm is in collecting amounts due from its
customers.
2. Receivables turnover
Total sales (Income Statement)
Average accounts receivable (Balance Sheet)
7,934,000
(1,178,000 + 1,175,000) ÷ 2
Ratio Example*
= 6.7 times
An alternative, but equivalent, measure of the efficiency of the
company’s receivable collection efforts. If the
company also makes sales for cash, “total credit sales” should
be substituted for “total sales.”
3. Number of days’ sales in inventory
Average inventory (Balance Sheet)
Average daily cost of sales (Income Statement)
(458,000 + 424,000) ÷ 2
6,816,000 ÷ 365
Ratio Example*
= 23.6 days
441,000
18,674
46. =
4. Inventory turnover
Cost of goods sold (Income Statement)
Average inventory (Balance Sheet)
6,816,000
(458,000 + 424,000) ÷ 2
Ratio Example*
= 15.5 times
An indicator of the amount of inventory maintained relative to
the average number of days’ shipments that would
be filled. This measure can be used to assess the efficiency of
the company’s distribution system.
An alternative measure of how quickly inventory is sold and
how efficiently it is managed.
*Figures in examples are from the sample financial statements
presented earlier.
◆ RUF 1/1016
proo
f
proo
f
47. SUMMARY
Financial analysis involves many different
approaches; the ratio analysis presented on the
preceding pages is only one of several means of
gaining an understanding about a company from
its financial data. Other approaches, such as the
careful study of the financial statement notes,
examination of the company’s accounting policies,
and an analysis of operations by division or product-
line should also be considered. We can assist in
developing other procedures that will be useful on
a day-to-day operating basis.
We want your financial statements to be used and
useful. If you would like further information,
please call.