The X axis shows how far away from the equator the population lives. The Y axis captures the
skin pigmentation of the population. Note that this data is recorded as "skin reflectance," which
is a measure of skin lightness (i.e., high values indicate lighter skin). Two curves should be
drawn, one for populations living in the Northern Hemisphere and one for populations in the
Southern hemisphere. Part II - Is UV Radiation Linked to Skin Pigmentation? Nina has a hunch
that melanin evolved in our skin to protect us from the sun's harmful UV radiation, and that the
most heavily pigmented human popu- lations have evolved in areas of high UV intensity. This
can account for the variability in human skin pigmentation only if different populations are
exposed to different levels of UV light. Is there evidence that the amount of UV light varies
across different environments on this planet? Nina asked her husband, Penn State University
geographer George Chaplin, for help. At her request, he created a map showing the UV Index, a
standard- ized scale that forecasts the intensity of UV radiation at any given time and location on
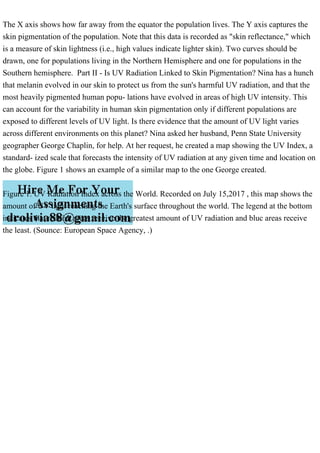
the globe. Figure 1 shows an example of a similar map to the one George created.
Figure 1. UV Radiation Index across the World. Recorded on July 15,2017 , this map shows the
amount of UV light reaching the Earth's surface throughout the world. The legend at the bottom
indicates that reddish areas receive the greatest amount of UV radiation and bluc areas receive
the least. (Sounce: European Space Agency, .).
The X axis shows how far away from the equator the population lives..pdf
1. The X axis shows how far away from the equator the population lives. The Y axis captures the
skin pigmentation of the population. Note that this data is recorded as "skin reflectance," which
is a measure of skin lightness (i.e., high values indicate lighter skin). Two curves should be
drawn, one for populations living in the Northern Hemisphere and one for populations in the
Southern hemisphere. Part II - Is UV Radiation Linked to Skin Pigmentation? Nina has a hunch
that melanin evolved in our skin to protect us from the sun's harmful UV radiation, and that the
most heavily pigmented human popu- lations have evolved in areas of high UV intensity. This
can account for the variability in human skin pigmentation only if different populations are
exposed to different levels of UV light. Is there evidence that the amount of UV light varies
across different environments on this planet? Nina asked her husband, Penn State University
geographer George Chaplin, for help. At her request, he created a map showing the UV Index, a
standard- ized scale that forecasts the intensity of UV radiation at any given time and location on
the globe. Figure 1 shows an example of a similar map to the one George created.
Figure 1. UV Radiation Index across the World. Recorded on July 15,2017 , this map shows the
amount of UV light reaching the Earth's surface throughout the world. The legend at the bottom
indicates that reddish areas receive the greatest amount of UV radiation and bluc areas receive
the least. (Sounce: European Space Agency, .)