US Hispanic Population Stats - 2014
•
1 like•935 views

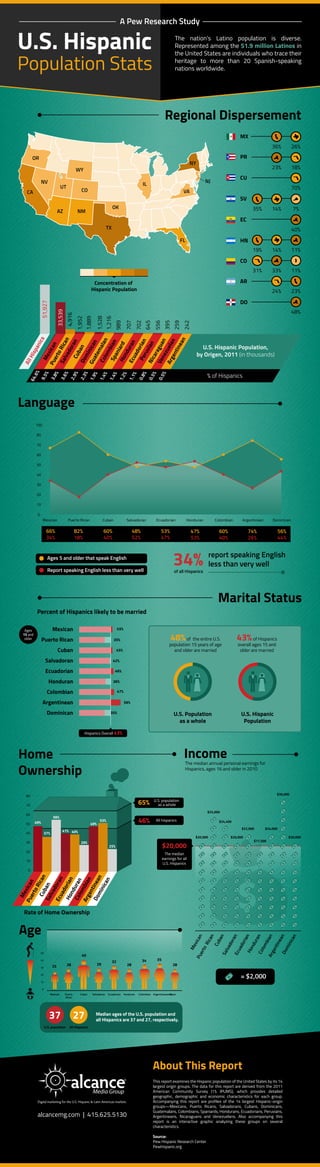
The nation’s Latino population is diverse. Represented among the 51.9 million Latinos in the United States are individuals who trace their heritage to more than 20 Spanish-speaking nations worldwide.
Recommended

Recommended
More Related Content
What's hot
What's hot (7)
Similar to US Hispanic Population Stats - 2014
Similar to US Hispanic Population Stats - 2014 (20)
More from Alfredo Cisneros
More from Alfredo Cisneros (20)
Recently uploaded
Recently uploaded (20)
US Hispanic Population Stats - 2014
- 1. Marital Status Percent of Hispanics likely to be married 45% 35% 45% 42% 46% 47% 56% 35% 36% Mexican Puerto Rican Cuban Salvadoran Ecuadorian Honduran Colombian Argentinean Dominican 48%of the entire U.S. population 15 years of age and older are married U.S. Population as a whole U.S. Hispanic Population 43%of Hispanics overall ages 15 and older are married Regional Dispersement Concentration of Hispanic Population U.S. Hispanic Population, by Origen, 2011 (in thousands) % of Hispanics Digital marketing for the U.S. Hispanic & Latin American markets This report examines the Hispanic population of the United States by its 14 largest origin groups. The data for this report are derived from the 2011 American Community Survey (1% IPUMS), which provides detailed geographic, demographic and economic characteristics for each group. Accompanying this report are profiles of the 14 largest Hispanic-origin groups—Mexicans, Puerto Ricans, Salvadorans, Cubans, Dominicans, Guatemalans, Colombians, Spaniards, Hondurans, Ecuadorians, Peruvians, Argentineans, Nicaraguans and Venezuelans. Also accompanying this report is an interactive graphic analyzing these groups on several characteristics. Source: Pew Hispanic Research Center Pewhispanic.org alcancemg.com | 415.625.5130 Median ages of the U.S. population and all Hispanics are 37 and 27, respectively. 37 27 U.S. population All Hispanics The nation’s Latino population is diverse. Represented among the 51.9 million Latinos in the United States are individuals who trace their heritage to more than 20 Spanish-speaking nations worldwide. A Pew Research Study Language 100 80 70 60 50 40 30 20 10 0 Ages 5 and older that speak English Report speaking English less than very well of all Hispanics report speaking English less than very well34% Home Ownership Rate of Home Ownership 80 70 60 50 40 30 20 10 0 49% 37% 56% 41% 40% 49% 53% 25% 29% U.S. population as a whole All hispanics 65% 46% About This Report 25 28 40 29 32 34 35 2828 50 40 30 20 10 0 Age CA TX FL NY IL OK NMAZ NV UT CO WY OR VA NJ Ages 15 and older Hispanics Overall 43% The median annual personal earnings for Hispanics, ages 16 and older in 2010 $20,000 The median earnings for all U.S. Hispanics = $2,000