SlideShare a Scribd company logo
1 of 9
Download to read offline
American International Journal of Business Management (AIJBM)
ISSN- 2379-106X, www.aijbm.com Volume 3, Issue 4 (April 2020), PP 59-67
*Corresponding Author: Dian Putri Pradana www.aijbm.com 59 | Page
Analysis of Housing Affordability by Generation Y Based On
Price to Income Ratio In Jakarta Region
Dian Putri Pradana, Raden Aswin Rahadi
ABSTRACT:- This paper will discuss about Generation Y preferences in purchasing their first house and
how it affects their affordability using price to income ratio. The approach being used is by analysing twenty-
three papers related to preferences and housing affordability, making synthesis from collected papers, and
generating critical view from papers that have been read. From this paper researcher find that Gen Y
preferences mainly focuses on three aspects such as product specifications, future considerations, and dwellers
characteristics. It is also shown that supplemental factors such as taxes and mortgage payments also included in
Gen Y preferences and further affects price and affordability. All of these papers will be analysed to find the
most proper objectives, deeper understandings, methodologies, and conclusion.
Keywords:- Gen Y, Housing Preferences, Affordability, Price to Income Ratio
I. INTRODUCTION
Generation Y (or simply Gen Y) is determined by the researchers and popular media as the generation
who is born between early 1980 to early 2000. In Indonesia, Generation Y is currently dominating the society
based on the data gathered from Ministry of National Development Planning back in year 2018 and actively
contributed to the Indonesian’s GDP.
Ting Xu (2017) explained that GDP influences building values and bank credit to stimulate investment
needs, thus it influences house prices. Rumah123 as the largest property site in Indonesia stated that more than
95% of Indonesian Gen Y will not able to own a house based on their survey because of the consumptive
lifestyle and a veryhigh-rise in propertyasset price. In order to gain more information, Rumah123 conducted the
survey in cooperation with karir.com. Based on that research, the data gathered that the increase in house prices
in Indonesia reached 17%, far higher than the salary increase of at most only 10% due to improvements of
economic growth and decreasing in inflation.
Figure 1: House Price Change (Source: Bank Indonesia, Global Property Guide 2019)
= Looking from the other side, property or house investment in Indonesia is not as attractive as other
investments such as mutual funds, stocks, gold or peer to peer lending because the amount of money they have to
spend and time of return. The Deloitte Gen Y Survey (2019) clarify that only 49% from 13416 respondents (with
300 Indonesian respondents in it) who put owning their property asset as their first priority.
Analysis Of Housing Affordability By Generation Y Based On Price To Income Ratio In Jakarta...
*Corresponding Author: Dian Putri Pradana www.aijbm.com 60 | Page
Figure 2: House Ownership by Gen Y, Processed by Lokadata (Source: Susenas 2017,
Badan Pusat Statistik).
As a real solution the government has provided a KPR program, but that is not an easy matter. An
important point Gen Y must have is the bank's trust in your financial capabilities. Banks, of course, are not just
about approving KPR applications, especially for those who have just worked. Gen Y need to make sure that the
loan repayments related to the bank are paid smoothly. In addition, KPR will only help Gen Y to get their own
house based on their ability, and most of it located in the supporting city.
Indonesia also experiencing the increasing number of urbanisations (Oxford Business Group, 2019)
and according to the law of supply and demand, if the demand is greater than the supply so the product
providers will increase the price. The current demand for housing in Jakarta itself already 11.4 million units
by the year of 2018 and continue to increase 8% from year to year while the current supply being brought to the
market represents only 400,000 to 500,000 per year (Investor Daily, 2019). While in fact, it is very important
for Gen Y to have their own at least one property asset because it is a part of the human primary needs and really
beneficial for the buyers for example it will increase in value, build equity and provide a nest egg for the future
(Weintraub, 2019).
According to Survei Sosial Ekonomi Nasional (SUSENAS), research agency under Statistics Indonesia
(BPS), in 2017, Gen Y families that have house in Jakarta are still very few, especially in the central and
northern Jakarta areas with the exact numbers of 13% and15.6%. Most of them still live in the houses they rent,
and some live in the service house provided by the instances they work. As many as 46% of Gen Y in Jakarta
still have salary below 4 million rupiah and the rise in property prices is faster than the rise in income. Solutions
such as KPR, lowering BI rate, and expansion development to supported areas also has been conducted by the
government but the house ownership is still quite low.
With this issue going on in Indonesia, the researcher aims to understand the deeper reasons why Indonesian Gen
Y aren’t that aware with owning a house and the Price to Income Ratio as an indicator of the industry on which
factor the parties needs to develop.
II. LITERATURE REVIEW
2.1 Real Estate Industry
Real estate can be defined as the property, land, buildings, air rights above the land and underground
rights below the land. The term of real estate means real or physical property. The industry can be classified into
four types, the first one is residential. It is including the undeveloped land, houses, condominiums and
townhouses, which the structures may be single- family or multi-family dwellings and may be owner-occupied or
Analysis Of Housing Affordability By Generation Y Based On Price To Income Ratio In Jakarta...
*Corresponding Author: Dian Putri Pradana www.aijbm.com 61 | Page
rental properties (Chen, 2017). Different from the residential, the second type of real estate is commercial (CRE).
It is property used exclusively for business purposes rather than a living space and usually leased to tenants to
conduct business (Chen, 2019). While the third one is industrial or it can be simply understood as a region that
consist everything such as industrial warehouses and any other special purposes real estate over long-term
agreements, and the last one is retail where the landlord also receives a percentage of sales generated by tenant
in addition to the rent fees (Kennon, 2017).
2.2 Global Problematic Issues, Trends, and Challenges in Real Estate Industry
After nine years of continuous expansion, Asia’s real estate market are currently facing an unstable
condition. It is shown by the strictly competitive market, increasing interest rate, tightening access to credit, and
decreasing buyer’s affordability in purchasing property asset (Urban Land Institute, 2019). Mass and luxury
home prices are likely to increase by 5 to 10% in 2013 due to rising minimum wages and electric costs leading
to higher building material costs. It is also affected because of the limited land and secondary market supply.
With average prices expected to grow 10-20% in 2013 despite prices already reaching an all-time-high (Frank,
2013).
Indonesian real estate market condition itself was first discussed by Firman (1999). He recommended
on his paper that due to the urban crisis, the real estate market has been negatively affected. It resulted in the
increasing price of property asset that unconsciously affected the economic condition in Indonesia as a whole
(Oxford Business Group, 2014). The price of the real estate in Indonesia is increasing at a serious phase because
of the significant number in just 5 years shown in various growing areas near Jakarta such as Serpong, Bogor,
Bekasi, and areas within Jakarta itself (Global Property Guide, 2013; Bland, 2014).
2.3. Housing Affordability
Housing affordability is one of the elements that can determine the socioeconomic stability and
development of a region with the goal to understand is the house provided affordable for every income groups
(Suhaida, 2011). Stone (2006), defined housing affordability as a process of decision function which is made by
a family between housing and non-housing product expenditure. After comparing two countries (Reed, 2008), it
came to conclusion that measurement of housing affordability can be measured into three; purchase
affordability, repayment affordability, and income affordability (Gan & Hill, 2009).
2.4. Solution in Improving Housing Affordability
As a solution to improve housing affordability, Ivan Rijavec (2013) argues that affordability can be improved
by matching housing demand and supply to more deliberative way. While Sharam (2015) suggested that there
needs to be a structure of housing provider that is able to respond the purpose of housing planning scheme while
the public policy needs to facilitate the housing development so it will affect the project viability and further
affect the housing price and supply.
Poon (2012) stated that increases in new housing supply will help to improve the housing affordability,
this statement further added by The Baker Review (2012) that changes in the planning system were needed not
only to increase the housing supply but also to make the supply more sensitive to the demand.
2.5. Generation Y Preferences in Purchasing a House
Before we further determined the Generation Y preferences, it is important to first understand the general
customer preferences in purchasing a house. Those preferences are presented on the figure below;
Analysis Of Housing Affordability By Generation Y Based On Price To Income Ratio In Jakarta...
*Corresponding Author: Dian Putri Pradana www.aijbm.com 62 | Page
Figure 2.2: Housing Preferences from Various Literature Resources (Source: Author’s Analysis)
Analysis Of Housing Affordability By Generation Y Based On Price To Income Ratio In Jakarta...
*Corresponding Author: Dian Putri Pradana www.aijbm.com 63 | Page
Based on 18 possible reasons offered on survey conducted by Lachman Associates Survey (2014),
Generation Y preferences in deciding which house to purchase is mostly because of wanted more space (24%)
and job location accessibility with the same amount of percentage (24%). While their least reasons are
educational facilities (10%) followed by their indecisive choice of living by wanting to trynew places to live with
the same amount ofpercentage (10%).
Still from the Lachman Associates Survey (2014) Gen Y preferences mostly focus on management
handles in repairs and maintenances, flexibility in how long the buyer can do the mortgage, and the
commitment duration between the seller and the buyer. Several facilities such as garage parking, internet
connection, and eco-friendly features as energy saving appliances are also considerations. While in the
neighbourhood aspect, they prefers neighbour that has the same lifestyle as them.
2.6. Indonesian Generation Y Population Profile
There are 63 million Generation Y in Indonesia or equals to 24% of working age populations and
categorized as a majority group in Indonesia demographic structure, which further it can be classified into two
categories; Junior Gen Y who was born in 1991 to 1998, and Senior Gen Y who was born in 1983 to 1990
(Bappenas, 2019).
According to IDN Research Institute (2019); when it comes to priority, Senior Generation Y
differentiate it into three which are becoming good parents (58%), buying a house (51,5%), and making parents
happy (52,7%). Similar to it, Junior Generation Y classified it into two which are buying a house on their top
priority list (56,7%) and making parents happy (55,9%). Generation Y mostly spends their salary or income
focuses on 5 products. Defined as clothes or garment, mobile phone, computer or laptop, and household items.
While in entertainment and recreation expenses it divided into music, movies, games, photos, and traveling.
2.7. Jakarta’s Real Estate Problem
The retail industry continues to grow, housing in Jakarta remains as a problem. According to
Perumnas Official Website, Perumnas finally decided to do massive improvement by building 30.000 low-cost
housing units as a solution while in fact it’s not. Global Business Guide Indonesia (2014) reported that Jakarta
required an additional 800.000 new housing units annually because of the increasing population caused by
urbanisation.
2.8. Price to Income Method
Journal of Economics, Business and Management, Vol. 3, No. 12 (2015) stated that Price to Income Ratio can
be defined as a “Median Multiple” or median house price divided by median annual gross pre-tax household
income. Simply as the average house price divided byaverage household income.
Table 1: Previous Research using Price to Income Ratio (Source: Author’s Analysis)
Analysis Of Housing Affordability By Generation Y Based On Price To Income Ratio In Jakarta...
*Corresponding Author: Dian Putri Pradana www.aijbm.com 64 | Page
2.9. Mixed Method Analysis
Mixed methods research classified as a research where the researcher combines the elements of
qualitative and quantitative research in order to gain wider and deeper understanding (Schoonenboom &
Johnson, 2007). In order to fulfil the research objectives, researcher need to use the mixed methods analysis and
convinced by the previous research Table 2: Previous Research using Mixed-Methods Analysis (Source:
Author’s Analysis)
Table 2: Previous Research using Mixed-Methods Analysis (Source: Author’s Analysis)
Analysis Of Housing Affordability By Generation Y Based On Price To Income Ratio In Jakarta...
*Corresponding Author: Dian Putri Pradana www.aijbm.com 65 | Page
III. HYPOTHESIS DEVELOPMENT
3.1. Product Specifications towards House Pricing
Product specifications can be further determined as building façade and interior design (Hofman,
2010), brand (Rahadi, 2012), security and accessibility (Hapsariniaty, 2013) in affecting customer preferences
to buy a house. Those preferences gathered from literature review and interview questions conducted by Rahadi
(2012), with ten questions focusing on underlying reasons for real estate developer when deciding to set a price.
Based on that interviews the data can be concluded that seven respondents agreed that design affect housing
price, six respondents considered brand, five respondents considered facilities, and four respondents considered
the accessibility. Based on the statements above, it can be concluded the hypothesis formula as follows:
H1: Product Specifications has a significant positive influence on the growth of housing price
3.2. Future Considerations towards House Pricing
Future considerations consist of the reputation and reinvestment value (Rahadi, 2012) which can be further
described the influence of low interest rate and the continued investment of multinational corporations and easy
homeownership have developed new property investors from wealthy group. At the same time, rising market
has increased the housing price (Kamal, 2016).
H2: Future considerations has a significant positive influence on the growth of housing price
3.3. Dwellers Characteristics towards House Pricing
Dwellers characteristics consist of the demographics, social economy and neighbourhood (Hapsariniaty, 2013)
which can be further determined as the population increases and can be attributed to migration of local citizens
and foreign workforce also the returns of people from overseas has contributed to the increasing of demand that
is positively related to the house price (Kamal, 2016). While the social-economy is affected from the increasing
of construction cost that isn’t aligned with the increasing of dwellers’ income (Hassan & Osmadi, 2016).
H3: Dwellers characteristics has a significant positive influence on the growth of housing price
3.4. Supplemental Factors towards House Pricing
Bourassa (1996) stated a concept where house pricing is affected by the supplemental factors such as mortgage
payments, maintenance expenses and property taxes. While other factors focus on the developer point of view,
supplemental factors affected by the government policy also and financial factor. Abdullah (2012) said that for
the first-time buyer, financial factor is the most crucial consideration for them in purchasing a house.
H4: Supplemental factors has a significant positive influence on the growth of housing price
3.5. House Pricing towards Affordability
In calculating the affordability, house price is the most-used factor in the ratio. An already high or increasing
price-income ratio should immediately signal to urban managers that they should take urgent action in fixing the
condition (Bertand, 2018). A high price-income indicates a discrepancy between housing supply and demand,
so when the demand is high and the supply is low it causes the house price to increase and lower the
affordability (Bertand, 2018).
H5: House pricing has a significant negative influence on the growth of affordability.
IV. CONCLUSION
The following conceptual framework is developed to meet the objectives of this study. This conceptual
framework explained the correlation between the independent variables toward house pricing and affordability.
The conceptual framework of this research can be seen in Figure 3 below:
Analysis Of Housing Affordability By Generation Y Based On Price To Income Ratio In Jakarta...
*Corresponding Author: Dian Putri Pradana www.aijbm.com 66 | Page
Figure 3. Conceptual Framework (Source: Author’s Analysis)
From the data analysis above, we can conclude that there are three main preferences in purchasing a
house such as product specifications (building façade, interior design, brand, security, and accessibility), future
considerations (reputation and reinvestment value), and dwellers characteristics (demographics, social economy
and neighbourhood). Supplemental factors (mortgage payments, maintenance expenses and property taxes)
unconsciously also affects the housing price outside the preferences that will further influence the housing price
and affordability.
Further research should be conducted to improve the findings of this research by conducting interviews
to the real estate experts and survey to Gen Y in order to gain their specific preferences and wages. Those
findings can be used to calculate the Price to Income Ratio and find the solutions to achieve the ideal condition.
REFERENCES
[1]. Anon (2010), “No place like home: the generation who can’t afford to buy”, The Independent, 16
March, available at: www.independent.co.uk/life-style/house-and-home/property/no-place-like-home-
the-generation-who-cant-afford-to-buy-1921781.html
[2]. Baker, D. (2008). The housing bubble and the financial crisis. Washington DC: Center for Economic
and Policy Research.
[3]. Global Property Guide (2013), “Indonesia’s property market - a real estate boom in the making?”,
Global Property Guide, available at: www.globalpropertyguide.com/Asia/indonesia/Price-History
[4]. Hapsariniaty, A.W. (2013), “Analisis Perbandingan Preferensi Masyarakat Golongan Menengah
Dalam Memilih Hunian pada Gated Communities di Kawasan Kota dan Pinggiran Kota Bandung:
Studi KasusKec. Kiara Condong dan Kec. Parongpong (Comparative Analysis of Middle-Class’
Preferences Choosing to Live in Gated Communities in the Urban and Suburban area of Bandung:
Case Study Kec. Kiara Condong and Kec. Parongpong), Master Thesis”, School of Architecture,
Planning, and Policy Development, Institut Teknologi Bandung, Bandung.
[5]. Hashim, Z.A., House Price and Affordability in Housing in Malaysia Akademika, 2010. 78: p. 37-46.
[6]. Hofman, E., Halman, J.I. and Ion, R.A. (2006), “Variation in housing design: identifying customer
preferences”, Housing Studies, Vol. 21 No. 6, pp. 929-943.
[7]. Opoku, R. A., Abdul-Muhmin, A. G. (2009), Housing preferences and attribute importance among
low-income consumers in Saudi Arabia, Habitat International, 2009.
[8]. Purwandi l, 2016, “Indonesia 2020: The Urban Middle Class Millenials”, Alvara Research Center
[9]. Purwandi l., 2017,” Milenial Nusantara”, PT Gramedia Pustaka Utama
[10]. Rahadi, R.A., Wiryono, S.K., Koesrindartoto, D.P. and Syamwil, I.B. (2013), “Factors influencing
housing product value and price in Jakarta metropolitan region”, 2013 AMER International Conference
on Quality of Life, Langkawi, 8 November, Procedia - Social and Behavioral Sciences, pp. 368-378.
Analysis Of Housing Affordability By Generation Y Based On Price To Income Ratio In Jakarta...
*Corresponding Author: Dian Putri Pradana www.aijbm.com 67 | Page
[11]. Rahadi, R. A., Wiryono, S. K., Koesrindartoto, D. P., Syamwil, I. B. (2012). Relationship between
Consumer Preferences and Value Propositions: A Study of Residential Product. AcE-Bs 2012 Bangkok
Procedia - Social and Behavioral Sciences
[12]. Ratnaningsih, I. Z., & Prasetyo, A. R. (2017). Work-Life Balance pada Generasi Y. Dalam Asosiasi
Psikologi Industri dan Organisasi, Prosiding Temu Ilmiah Nasional APIO 2017 (hal. 208-216). Jakarta:
Himpunan Psikologi Indonesia.
[13]. Sezin, Baysal, 2014, “Working with Generations X and Y In Generation Z Period: Management Of
Different Generations In Business Life”, Mediterranean Journal of Social Sciences MCSER
Publishing, Rome-Italy The Council of Economic Advisers. (2014). 15 Economic Facts about
Millennials. Washington D.C: The Council of Economic Advisers.
[14]. Sharam, A. 2012. ‘Smart Housing’, Presentation to the Housing Melbourne Symposium, 7th
November, Office of the Victorian Government Architect, Swinburne University and the Princes
Foundation, National Gallery of Victoria.
http://www.ovga.vic.gov.au/images/Alves_Sharam_McShane_words.pdf.
[15]. Stone, M. E.. What is housing affordability? The case for the residual income approach. Housing
Policy debate, 2006. 17(1), Pp. 151–184.
[16]. Tan, T.H., Affordable Housing for First-Time Homebuyers: Issues and Implications from the
Malaysian Experience, in 1st International Conference on Innovation and Sustainability (ICOIS
2013)2013: Sunway Resort Hotel, Kuala Lumpur.
[17]. Thalmann, Phillippe. 2003. “House Poor” or Simply “Poor”? Journal of Housing Economics
12(4):291–317.
[18]. Tan, T.H. (2011), “Measuring the willingness to pay for houses in a sustainable neighborhood”, The
International Journal of Environmental, Cultural, Economic and Social Sustainability, No. 7, pp. 1-12.
[19]. Tan, T.H. (2012), “Meeting first-time buyers’ housing needs and preferences in greater Kuala
Lumpur”, Cities, Vol. 29 No. 1, pp. 389-396.
[20]. Wang, D. and Li, S.M. (2006), “Socio-economic differentials and stated housing preferences in
Guangzhou, China”, Habitat International, Vol. 30 No. 2, pp. 305-326.
[21]. Yang, Z., & Shen, Y.. The affordability of owner occupied housing in Beijing. Journal of Housing and
the Built Environment, 2008. 23(4), Pp. 317-335.
[22]. Yin, Robert K. 2013. Case study research: Design and methods. 5th Los Angeles: Sage.

More Related Content

Similar to F345967

HFSeptOct - Rusmin
HFSeptOct - RusminHFSeptOct - Rusmin
HFSeptOct - RusminRusmin Lawin
 
Macroeconomic drivers of home prices in malaysia
Macroeconomic drivers of home prices in malaysiaMacroeconomic drivers of home prices in malaysia
Macroeconomic drivers of home prices in malaysiaShanmuga Pillaiyan
 
4 factors influencing real estate 34-53
4 factors influencing real estate  34-534 factors influencing real estate  34-53
4 factors influencing real estate 34-53Alexander Decker
 
Macroeconomics of Real Estate
Macroeconomics of Real EstateMacroeconomics of Real Estate
Macroeconomics of Real Estatekamal taliyan
 
Factors Determining the Continuous Price Appreciation of Condominium Units in...
Factors Determining the Continuous Price Appreciation of Condominium Units in...Factors Determining the Continuous Price Appreciation of Condominium Units in...
Factors Determining the Continuous Price Appreciation of Condominium Units in...Premier Publishers
 
Influence of Government Regulations on the relationship between Borrower's C...
Influence of Government Regulations on the relationship between  Borrower's C...Influence of Government Regulations on the relationship between  Borrower's C...
Influence of Government Regulations on the relationship between Borrower's C...MUTURIPETERGITHAE
 
Affordable Housing : A Case Study from 7th Annual Affordable Housing Projects
Affordable Housing : A Case Study from 7th Annual Affordable Housing ProjectsAffordable Housing : A Case Study from 7th Annual Affordable Housing Projects
Affordable Housing : A Case Study from 7th Annual Affordable Housing Projectsmarcus evans
 
Real estate in indian context
Real estate in indian contextReal estate in indian context
Real estate in indian contextVijayakumar Kumar
 
111210-FINAL-RusminLawin
111210-FINAL-RusminLawin111210-FINAL-RusminLawin
111210-FINAL-RusminLawinRusmin Lawin
 
EFFECTS OF MORTGAGE FINANCING ON THE FINANCIAL PERFORMANCE OF COMMERCIAL BANK...
EFFECTS OF MORTGAGE FINANCING ON THE FINANCIAL PERFORMANCE OF COMMERCIAL BANK...EFFECTS OF MORTGAGE FINANCING ON THE FINANCIAL PERFORMANCE OF COMMERCIAL BANK...
EFFECTS OF MORTGAGE FINANCING ON THE FINANCIAL PERFORMANCE OF COMMERCIAL BANK...paperpublications3
 
11.real estate industry in chittagong
11.real estate industry in chittagong11.real estate industry in chittagong
11.real estate industry in chittagongAlexander Decker
 
Real estate industry in chittagong
Real estate industry in chittagongReal estate industry in chittagong
Real estate industry in chittagongAlexander Decker
 
Problems of Housing Finance in India
Problems of Housing Finance in IndiaProblems of Housing Finance in India
Problems of Housing Finance in IndiaDr. Amarjeet Singh
 
Problems Faced by the Housing Finance Borrowers: A study Conducted in Punjab
Problems Faced by the Housing Finance Borrowers: A study Conducted in PunjabProblems Faced by the Housing Finance Borrowers: A study Conducted in Punjab
Problems Faced by the Housing Finance Borrowers: A study Conducted in Punjabinventionjournals
 
A Study on Housing Loan Evolution and Performance in India
A Study on Housing Loan Evolution and Performance in IndiaA Study on Housing Loan Evolution and Performance in India
A Study on Housing Loan Evolution and Performance in Indiaijtsrd
 
Affordable housing icc - final
Affordable housing icc - finalAffordable housing icc - final
Affordable housing icc - finalsumit2512
 
Real estate - Making India_Ernst and Young
Real estate - Making India_Ernst and YoungReal estate - Making India_Ernst and Young
Real estate - Making India_Ernst and YoungPratik Chawla
 

Similar to F345967 (20)

HFSeptOct - Rusmin
HFSeptOct - RusminHFSeptOct - Rusmin
HFSeptOct - Rusmin
 
Macroeconomic drivers of home prices in malaysia
Macroeconomic drivers of home prices in malaysiaMacroeconomic drivers of home prices in malaysia
Macroeconomic drivers of home prices in malaysia
 
4 factors influencing real estate 34-53
4 factors influencing real estate  34-534 factors influencing real estate  34-53
4 factors influencing real estate 34-53
 
Macroeconomics of Real Estate
Macroeconomics of Real EstateMacroeconomics of Real Estate
Macroeconomics of Real Estate
 
Real Estate Level Forecasting - Review
Real Estate Level Forecasting - ReviewReal Estate Level Forecasting - Review
Real Estate Level Forecasting - Review
 
Factors Determining the Continuous Price Appreciation of Condominium Units in...
Factors Determining the Continuous Price Appreciation of Condominium Units in...Factors Determining the Continuous Price Appreciation of Condominium Units in...
Factors Determining the Continuous Price Appreciation of Condominium Units in...
 
Rahul todi
Rahul todiRahul todi
Rahul todi
 
Influence of Government Regulations on the relationship between Borrower's C...
Influence of Government Regulations on the relationship between  Borrower's C...Influence of Government Regulations on the relationship between  Borrower's C...
Influence of Government Regulations on the relationship between Borrower's C...
 
Affordable Housing : A Case Study from 7th Annual Affordable Housing Projects
Affordable Housing : A Case Study from 7th Annual Affordable Housing ProjectsAffordable Housing : A Case Study from 7th Annual Affordable Housing Projects
Affordable Housing : A Case Study from 7th Annual Affordable Housing Projects
 
Real estate in indian context
Real estate in indian contextReal estate in indian context
Real estate in indian context
 
111210-FINAL-RusminLawin
111210-FINAL-RusminLawin111210-FINAL-RusminLawin
111210-FINAL-RusminLawin
 
EFFECTS OF MORTGAGE FINANCING ON THE FINANCIAL PERFORMANCE OF COMMERCIAL BANK...
EFFECTS OF MORTGAGE FINANCING ON THE FINANCIAL PERFORMANCE OF COMMERCIAL BANK...EFFECTS OF MORTGAGE FINANCING ON THE FINANCIAL PERFORMANCE OF COMMERCIAL BANK...
EFFECTS OF MORTGAGE FINANCING ON THE FINANCIAL PERFORMANCE OF COMMERCIAL BANK...
 
11.real estate industry in chittagong
11.real estate industry in chittagong11.real estate industry in chittagong
11.real estate industry in chittagong
 
Real estate industry in chittagong
Real estate industry in chittagongReal estate industry in chittagong
Real estate industry in chittagong
 
Problems of Housing Finance in India
Problems of Housing Finance in IndiaProblems of Housing Finance in India
Problems of Housing Finance in India
 
Problems Faced by the Housing Finance Borrowers: A study Conducted in Punjab
Problems Faced by the Housing Finance Borrowers: A study Conducted in PunjabProblems Faced by the Housing Finance Borrowers: A study Conducted in Punjab
Problems Faced by the Housing Finance Borrowers: A study Conducted in Punjab
 
C2102936
C2102936C2102936
C2102936
 
A Study on Housing Loan Evolution and Performance in India
A Study on Housing Loan Evolution and Performance in IndiaA Study on Housing Loan Evolution and Performance in India
A Study on Housing Loan Evolution and Performance in India
 
Affordable housing icc - final
Affordable housing icc - finalAffordable housing icc - final
Affordable housing icc - final
 
Real estate - Making India_Ernst and Young
Real estate - Making India_Ernst and YoungReal estate - Making India_Ernst and Young
Real estate - Making India_Ernst and Young
 

More from aijbm

E582740.pdf
E582740.pdfE582740.pdf
E582740.pdfaijbm
 
A580108.pdf
A580108.pdfA580108.pdf
A580108.pdfaijbm
 
F584145.pdf
F584145.pdfF584145.pdf
F584145.pdfaijbm
 
B580914.pdf
B580914.pdfB580914.pdf
B580914.pdfaijbm
 
H585357.pdf
H585357.pdfH585357.pdf
H585357.pdfaijbm
 
G584652.pdf
G584652.pdfG584652.pdf
G584652.pdfaijbm
 
D582026.pdf
D582026.pdfD582026.pdf
D582026.pdfaijbm
 
C581519.pdf
C581519.pdfC581519.pdf
C581519.pdfaijbm
 
P57130135.pdf
P57130135.pdfP57130135.pdf
P57130135.pdfaijbm
 
M5799113.pdf
M5799113.pdfM5799113.pdf
M5799113.pdfaijbm
 
O57120129.pdf
O57120129.pdfO57120129.pdf
O57120129.pdfaijbm
 
R57139145.pdf
R57139145.pdfR57139145.pdf
R57139145.pdfaijbm
 
J577177.pdf
J577177.pdfJ577177.pdf
J577177.pdfaijbm
 
Q57136138.pdf
Q57136138.pdfQ57136138.pdf
Q57136138.pdfaijbm
 
C572126.pdf
C572126.pdfC572126.pdf
C572126.pdfaijbm
 
F574050.pdf
F574050.pdfF574050.pdf
F574050.pdfaijbm
 
E573539.pdf
E573539.pdfE573539.pdf
E573539.pdfaijbm
 
I576670.pdf
I576670.pdfI576670.pdf
I576670.pdfaijbm
 
S57146154.pdf
S57146154.pdfS57146154.pdf
S57146154.pdfaijbm
 
K577886.pdf
K577886.pdfK577886.pdf
K577886.pdfaijbm
 

More from aijbm (20)

E582740.pdf
E582740.pdfE582740.pdf
E582740.pdf
 
A580108.pdf
A580108.pdfA580108.pdf
A580108.pdf
 
F584145.pdf
F584145.pdfF584145.pdf
F584145.pdf
 
B580914.pdf
B580914.pdfB580914.pdf
B580914.pdf
 
H585357.pdf
H585357.pdfH585357.pdf
H585357.pdf
 
G584652.pdf
G584652.pdfG584652.pdf
G584652.pdf
 
D582026.pdf
D582026.pdfD582026.pdf
D582026.pdf
 
C581519.pdf
C581519.pdfC581519.pdf
C581519.pdf
 
P57130135.pdf
P57130135.pdfP57130135.pdf
P57130135.pdf
 
M5799113.pdf
M5799113.pdfM5799113.pdf
M5799113.pdf
 
O57120129.pdf
O57120129.pdfO57120129.pdf
O57120129.pdf
 
R57139145.pdf
R57139145.pdfR57139145.pdf
R57139145.pdf
 
J577177.pdf
J577177.pdfJ577177.pdf
J577177.pdf
 
Q57136138.pdf
Q57136138.pdfQ57136138.pdf
Q57136138.pdf
 
C572126.pdf
C572126.pdfC572126.pdf
C572126.pdf
 
F574050.pdf
F574050.pdfF574050.pdf
F574050.pdf
 
E573539.pdf
E573539.pdfE573539.pdf
E573539.pdf
 
I576670.pdf
I576670.pdfI576670.pdf
I576670.pdf
 
S57146154.pdf
S57146154.pdfS57146154.pdf
S57146154.pdf
 
K577886.pdf
K577886.pdfK577886.pdf
K577886.pdf
 

Recently uploaded

RE Capital's Visionary Leadership under Newman Leech
RE Capital's Visionary Leadership under Newman LeechRE Capital's Visionary Leadership under Newman Leech
RE Capital's Visionary Leadership under Newman LeechNewman George Leech
 
Banana Powder Manufacturing Plant Project Report 2024 Edition.pptx
Banana Powder Manufacturing Plant Project Report 2024 Edition.pptxBanana Powder Manufacturing Plant Project Report 2024 Edition.pptx
Banana Powder Manufacturing Plant Project Report 2024 Edition.pptxgeorgebrinton95
 
Monte Carlo simulation : Simulation using MCSM
Monte Carlo simulation : Simulation using MCSMMonte Carlo simulation : Simulation using MCSM
Monte Carlo simulation : Simulation using MCSMRavindra Nath Shukla
 
Call Girls in Mehrauli Delhi 💯Call Us 🔝8264348440🔝
Call Girls in Mehrauli Delhi 💯Call Us 🔝8264348440🔝Call Girls in Mehrauli Delhi 💯Call Us 🔝8264348440🔝
Call Girls in Mehrauli Delhi 💯Call Us 🔝8264348440🔝soniya singh
 
Pitch Deck Teardown: NOQX's $200k Pre-seed deck
Pitch Deck Teardown: NOQX's $200k Pre-seed deckPitch Deck Teardown: NOQX's $200k Pre-seed deck
Pitch Deck Teardown: NOQX's $200k Pre-seed deckHajeJanKamps
 
0183760ssssssssssssssssssssssssssss00101011 (27).pdf
0183760ssssssssssssssssssssssssssss00101011 (27).pdf0183760ssssssssssssssssssssssssssss00101011 (27).pdf
0183760ssssssssssssssssssssssssssss00101011 (27).pdfRenandantas16
 
FULL ENJOY - 9953040155 Call Girls in Chhatarpur | Delhi
FULL ENJOY - 9953040155 Call Girls in Chhatarpur | DelhiFULL ENJOY - 9953040155 Call Girls in Chhatarpur | Delhi
FULL ENJOY - 9953040155 Call Girls in Chhatarpur | DelhiMalviyaNagarCallGirl
 
Call Girls in Gomti Nagar - 7388211116 - With room Service
Call Girls in Gomti Nagar - 7388211116  - With room ServiceCall Girls in Gomti Nagar - 7388211116  - With room Service
Call Girls in Gomti Nagar - 7388211116 - With room Servicediscovermytutordmt
 
VIP Call Girl Jamshedpur Aashi 8250192130 Independent Escort Service Jamshedpur
VIP Call Girl Jamshedpur Aashi 8250192130 Independent Escort Service JamshedpurVIP Call Girl Jamshedpur Aashi 8250192130 Independent Escort Service Jamshedpur
VIP Call Girl Jamshedpur Aashi 8250192130 Independent Escort Service JamshedpurSuhani Kapoor
 
Cash Payment 9602870969 Escort Service in Udaipur Call Girls
Cash Payment 9602870969 Escort Service in Udaipur Call GirlsCash Payment 9602870969 Escort Service in Udaipur Call Girls
Cash Payment 9602870969 Escort Service in Udaipur Call GirlsApsara Of India
 
Call Girls Miyapur 7001305949 all area service COD available Any Time
Call Girls Miyapur 7001305949 all area service COD available Any TimeCall Girls Miyapur 7001305949 all area service COD available Any Time
Call Girls Miyapur 7001305949 all area service COD available Any Timedelhimodelshub1
 
/:Call Girls In Indirapuram Ghaziabad ➥9990211544 Independent Best Escorts In...
/:Call Girls In Indirapuram Ghaziabad ➥9990211544 Independent Best Escorts In.../:Call Girls In Indirapuram Ghaziabad ➥9990211544 Independent Best Escorts In...
/:Call Girls In Indirapuram Ghaziabad ➥9990211544 Independent Best Escorts In...lizamodels9
 
Call Girls In Radisson Blu Hotel New Delhi Paschim Vihar ❤️8860477959 Escorts...
Call Girls In Radisson Blu Hotel New Delhi Paschim Vihar ❤️8860477959 Escorts...Call Girls In Radisson Blu Hotel New Delhi Paschim Vihar ❤️8860477959 Escorts...
Call Girls In Radisson Blu Hotel New Delhi Paschim Vihar ❤️8860477959 Escorts...lizamodels9
 
The CMO Survey - Highlights and Insights Report - Spring 2024
The CMO Survey - Highlights and Insights Report - Spring 2024The CMO Survey - Highlights and Insights Report - Spring 2024
The CMO Survey - Highlights and Insights Report - Spring 2024christinemoorman
 
Progress Report - Oracle Database Analyst Summit
Progress  Report - Oracle Database Analyst SummitProgress  Report - Oracle Database Analyst Summit
Progress Report - Oracle Database Analyst SummitHolger Mueller
 
VIP Call Girls Pune Kirti 8617697112 Independent Escort Service Pune
VIP Call Girls Pune Kirti 8617697112 Independent Escort Service PuneVIP Call Girls Pune Kirti 8617697112 Independent Escort Service Pune
VIP Call Girls Pune Kirti 8617697112 Independent Escort Service PuneCall girls in Ahmedabad High profile
 
Lowrate Call Girls In Laxmi Nagar Delhi ❤️8860477959 Escorts 100% Genuine Ser...
Lowrate Call Girls In Laxmi Nagar Delhi ❤️8860477959 Escorts 100% Genuine Ser...Lowrate Call Girls In Laxmi Nagar Delhi ❤️8860477959 Escorts 100% Genuine Ser...
Lowrate Call Girls In Laxmi Nagar Delhi ❤️8860477959 Escorts 100% Genuine Ser...lizamodels9
 
GD Birla and his contribution in management
GD Birla and his contribution in managementGD Birla and his contribution in management
GD Birla and his contribution in managementchhavia330
 
Sales & Marketing Alignment: How to Synergize for Success
Sales & Marketing Alignment: How to Synergize for SuccessSales & Marketing Alignment: How to Synergize for Success
Sales & Marketing Alignment: How to Synergize for SuccessAggregage
 

Recently uploaded (20)

RE Capital's Visionary Leadership under Newman Leech
RE Capital's Visionary Leadership under Newman LeechRE Capital's Visionary Leadership under Newman Leech
RE Capital's Visionary Leadership under Newman Leech
 
Banana Powder Manufacturing Plant Project Report 2024 Edition.pptx
Banana Powder Manufacturing Plant Project Report 2024 Edition.pptxBanana Powder Manufacturing Plant Project Report 2024 Edition.pptx
Banana Powder Manufacturing Plant Project Report 2024 Edition.pptx
 
Monte Carlo simulation : Simulation using MCSM
Monte Carlo simulation : Simulation using MCSMMonte Carlo simulation : Simulation using MCSM
Monte Carlo simulation : Simulation using MCSM
 
Call Girls in Mehrauli Delhi 💯Call Us 🔝8264348440🔝
Call Girls in Mehrauli Delhi 💯Call Us 🔝8264348440🔝Call Girls in Mehrauli Delhi 💯Call Us 🔝8264348440🔝
Call Girls in Mehrauli Delhi 💯Call Us 🔝8264348440🔝
 
Pitch Deck Teardown: NOQX's $200k Pre-seed deck
Pitch Deck Teardown: NOQX's $200k Pre-seed deckPitch Deck Teardown: NOQX's $200k Pre-seed deck
Pitch Deck Teardown: NOQX's $200k Pre-seed deck
 
0183760ssssssssssssssssssssssssssss00101011 (27).pdf
0183760ssssssssssssssssssssssssssss00101011 (27).pdf0183760ssssssssssssssssssssssssssss00101011 (27).pdf
0183760ssssssssssssssssssssssssssss00101011 (27).pdf
 
FULL ENJOY - 9953040155 Call Girls in Chhatarpur | Delhi
FULL ENJOY - 9953040155 Call Girls in Chhatarpur | DelhiFULL ENJOY - 9953040155 Call Girls in Chhatarpur | Delhi
FULL ENJOY - 9953040155 Call Girls in Chhatarpur | Delhi
 
Call Girls in Gomti Nagar - 7388211116 - With room Service
Call Girls in Gomti Nagar - 7388211116  - With room ServiceCall Girls in Gomti Nagar - 7388211116  - With room Service
Call Girls in Gomti Nagar - 7388211116 - With room Service
 
VIP Call Girl Jamshedpur Aashi 8250192130 Independent Escort Service Jamshedpur
VIP Call Girl Jamshedpur Aashi 8250192130 Independent Escort Service JamshedpurVIP Call Girl Jamshedpur Aashi 8250192130 Independent Escort Service Jamshedpur
VIP Call Girl Jamshedpur Aashi 8250192130 Independent Escort Service Jamshedpur
 
Cash Payment 9602870969 Escort Service in Udaipur Call Girls
Cash Payment 9602870969 Escort Service in Udaipur Call GirlsCash Payment 9602870969 Escort Service in Udaipur Call Girls
Cash Payment 9602870969 Escort Service in Udaipur Call Girls
 
Call Girls Miyapur 7001305949 all area service COD available Any Time
Call Girls Miyapur 7001305949 all area service COD available Any TimeCall Girls Miyapur 7001305949 all area service COD available Any Time
Call Girls Miyapur 7001305949 all area service COD available Any Time
 
/:Call Girls In Indirapuram Ghaziabad ➥9990211544 Independent Best Escorts In...
/:Call Girls In Indirapuram Ghaziabad ➥9990211544 Independent Best Escorts In.../:Call Girls In Indirapuram Ghaziabad ➥9990211544 Independent Best Escorts In...
/:Call Girls In Indirapuram Ghaziabad ➥9990211544 Independent Best Escorts In...
 
Call Girls In Radisson Blu Hotel New Delhi Paschim Vihar ❤️8860477959 Escorts...
Call Girls In Radisson Blu Hotel New Delhi Paschim Vihar ❤️8860477959 Escorts...Call Girls In Radisson Blu Hotel New Delhi Paschim Vihar ❤️8860477959 Escorts...
Call Girls In Radisson Blu Hotel New Delhi Paschim Vihar ❤️8860477959 Escorts...
 
The CMO Survey - Highlights and Insights Report - Spring 2024
The CMO Survey - Highlights and Insights Report - Spring 2024The CMO Survey - Highlights and Insights Report - Spring 2024
The CMO Survey - Highlights and Insights Report - Spring 2024
 
Progress Report - Oracle Database Analyst Summit
Progress  Report - Oracle Database Analyst SummitProgress  Report - Oracle Database Analyst Summit
Progress Report - Oracle Database Analyst Summit
 
VIP Call Girls Pune Kirti 8617697112 Independent Escort Service Pune
VIP Call Girls Pune Kirti 8617697112 Independent Escort Service PuneVIP Call Girls Pune Kirti 8617697112 Independent Escort Service Pune
VIP Call Girls Pune Kirti 8617697112 Independent Escort Service Pune
 
Lowrate Call Girls In Laxmi Nagar Delhi ❤️8860477959 Escorts 100% Genuine Ser...
Lowrate Call Girls In Laxmi Nagar Delhi ❤️8860477959 Escorts 100% Genuine Ser...Lowrate Call Girls In Laxmi Nagar Delhi ❤️8860477959 Escorts 100% Genuine Ser...
Lowrate Call Girls In Laxmi Nagar Delhi ❤️8860477959 Escorts 100% Genuine Ser...
 
KestrelPro Flyer Japan IT Week 2024 (English)
KestrelPro Flyer Japan IT Week 2024 (English)KestrelPro Flyer Japan IT Week 2024 (English)
KestrelPro Flyer Japan IT Week 2024 (English)
 
GD Birla and his contribution in management
GD Birla and his contribution in managementGD Birla and his contribution in management
GD Birla and his contribution in management
 
Sales & Marketing Alignment: How to Synergize for Success
Sales & Marketing Alignment: How to Synergize for SuccessSales & Marketing Alignment: How to Synergize for Success
Sales & Marketing Alignment: How to Synergize for Success
 

F345967

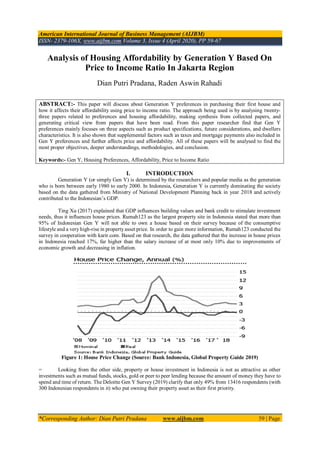
  • 1. American International Journal of Business Management (AIJBM) ISSN- 2379-106X, www.aijbm.com Volume 3, Issue 4 (April 2020), PP 59-67 *Corresponding Author: Dian Putri Pradana www.aijbm.com 59 | Page Analysis of Housing Affordability by Generation Y Based On Price to Income Ratio In Jakarta Region Dian Putri Pradana, Raden Aswin Rahadi ABSTRACT:- This paper will discuss about Generation Y preferences in purchasing their first house and how it affects their affordability using price to income ratio. The approach being used is by analysing twenty- three papers related to preferences and housing affordability, making synthesis from collected papers, and generating critical view from papers that have been read. From this paper researcher find that Gen Y preferences mainly focuses on three aspects such as product specifications, future considerations, and dwellers characteristics. It is also shown that supplemental factors such as taxes and mortgage payments also included in Gen Y preferences and further affects price and affordability. All of these papers will be analysed to find the most proper objectives, deeper understandings, methodologies, and conclusion. Keywords:- Gen Y, Housing Preferences, Affordability, Price to Income Ratio I. INTRODUCTION Generation Y (or simply Gen Y) is determined by the researchers and popular media as the generation who is born between early 1980 to early 2000. In Indonesia, Generation Y is currently dominating the society based on the data gathered from Ministry of National Development Planning back in year 2018 and actively contributed to the Indonesian’s GDP. Ting Xu (2017) explained that GDP influences building values and bank credit to stimulate investment needs, thus it influences house prices. Rumah123 as the largest property site in Indonesia stated that more than 95% of Indonesian Gen Y will not able to own a house based on their survey because of the consumptive lifestyle and a veryhigh-rise in propertyasset price. In order to gain more information, Rumah123 conducted the survey in cooperation with karir.com. Based on that research, the data gathered that the increase in house prices in Indonesia reached 17%, far higher than the salary increase of at most only 10% due to improvements of economic growth and decreasing in inflation. Figure 1: House Price Change (Source: Bank Indonesia, Global Property Guide 2019) = Looking from the other side, property or house investment in Indonesia is not as attractive as other investments such as mutual funds, stocks, gold or peer to peer lending because the amount of money they have to spend and time of return. The Deloitte Gen Y Survey (2019) clarify that only 49% from 13416 respondents (with 300 Indonesian respondents in it) who put owning their property asset as their first priority.
  • 2. Analysis Of Housing Affordability By Generation Y Based On Price To Income Ratio In Jakarta... *Corresponding Author: Dian Putri Pradana www.aijbm.com 60 | Page Figure 2: House Ownership by Gen Y, Processed by Lokadata (Source: Susenas 2017, Badan Pusat Statistik). As a real solution the government has provided a KPR program, but that is not an easy matter. An important point Gen Y must have is the bank's trust in your financial capabilities. Banks, of course, are not just about approving KPR applications, especially for those who have just worked. Gen Y need to make sure that the loan repayments related to the bank are paid smoothly. In addition, KPR will only help Gen Y to get their own house based on their ability, and most of it located in the supporting city. Indonesia also experiencing the increasing number of urbanisations (Oxford Business Group, 2019) and according to the law of supply and demand, if the demand is greater than the supply so the product providers will increase the price. The current demand for housing in Jakarta itself already 11.4 million units by the year of 2018 and continue to increase 8% from year to year while the current supply being brought to the market represents only 400,000 to 500,000 per year (Investor Daily, 2019). While in fact, it is very important for Gen Y to have their own at least one property asset because it is a part of the human primary needs and really beneficial for the buyers for example it will increase in value, build equity and provide a nest egg for the future (Weintraub, 2019). According to Survei Sosial Ekonomi Nasional (SUSENAS), research agency under Statistics Indonesia (BPS), in 2017, Gen Y families that have house in Jakarta are still very few, especially in the central and northern Jakarta areas with the exact numbers of 13% and15.6%. Most of them still live in the houses they rent, and some live in the service house provided by the instances they work. As many as 46% of Gen Y in Jakarta still have salary below 4 million rupiah and the rise in property prices is faster than the rise in income. Solutions such as KPR, lowering BI rate, and expansion development to supported areas also has been conducted by the government but the house ownership is still quite low. With this issue going on in Indonesia, the researcher aims to understand the deeper reasons why Indonesian Gen Y aren’t that aware with owning a house and the Price to Income Ratio as an indicator of the industry on which factor the parties needs to develop. II. LITERATURE REVIEW 2.1 Real Estate Industry Real estate can be defined as the property, land, buildings, air rights above the land and underground rights below the land. The term of real estate means real or physical property. The industry can be classified into four types, the first one is residential. It is including the undeveloped land, houses, condominiums and townhouses, which the structures may be single- family or multi-family dwellings and may be owner-occupied or
  • 3. Analysis Of Housing Affordability By Generation Y Based On Price To Income Ratio In Jakarta... *Corresponding Author: Dian Putri Pradana www.aijbm.com 61 | Page rental properties (Chen, 2017). Different from the residential, the second type of real estate is commercial (CRE). It is property used exclusively for business purposes rather than a living space and usually leased to tenants to conduct business (Chen, 2019). While the third one is industrial or it can be simply understood as a region that consist everything such as industrial warehouses and any other special purposes real estate over long-term agreements, and the last one is retail where the landlord also receives a percentage of sales generated by tenant in addition to the rent fees (Kennon, 2017). 2.2 Global Problematic Issues, Trends, and Challenges in Real Estate Industry After nine years of continuous expansion, Asia’s real estate market are currently facing an unstable condition. It is shown by the strictly competitive market, increasing interest rate, tightening access to credit, and decreasing buyer’s affordability in purchasing property asset (Urban Land Institute, 2019). Mass and luxury home prices are likely to increase by 5 to 10% in 2013 due to rising minimum wages and electric costs leading to higher building material costs. It is also affected because of the limited land and secondary market supply. With average prices expected to grow 10-20% in 2013 despite prices already reaching an all-time-high (Frank, 2013). Indonesian real estate market condition itself was first discussed by Firman (1999). He recommended on his paper that due to the urban crisis, the real estate market has been negatively affected. It resulted in the increasing price of property asset that unconsciously affected the economic condition in Indonesia as a whole (Oxford Business Group, 2014). The price of the real estate in Indonesia is increasing at a serious phase because of the significant number in just 5 years shown in various growing areas near Jakarta such as Serpong, Bogor, Bekasi, and areas within Jakarta itself (Global Property Guide, 2013; Bland, 2014). 2.3. Housing Affordability Housing affordability is one of the elements that can determine the socioeconomic stability and development of a region with the goal to understand is the house provided affordable for every income groups (Suhaida, 2011). Stone (2006), defined housing affordability as a process of decision function which is made by a family between housing and non-housing product expenditure. After comparing two countries (Reed, 2008), it came to conclusion that measurement of housing affordability can be measured into three; purchase affordability, repayment affordability, and income affordability (Gan & Hill, 2009). 2.4. Solution in Improving Housing Affordability As a solution to improve housing affordability, Ivan Rijavec (2013) argues that affordability can be improved by matching housing demand and supply to more deliberative way. While Sharam (2015) suggested that there needs to be a structure of housing provider that is able to respond the purpose of housing planning scheme while the public policy needs to facilitate the housing development so it will affect the project viability and further affect the housing price and supply. Poon (2012) stated that increases in new housing supply will help to improve the housing affordability, this statement further added by The Baker Review (2012) that changes in the planning system were needed not only to increase the housing supply but also to make the supply more sensitive to the demand. 2.5. Generation Y Preferences in Purchasing a House Before we further determined the Generation Y preferences, it is important to first understand the general customer preferences in purchasing a house. Those preferences are presented on the figure below;
  • 4. Analysis Of Housing Affordability By Generation Y Based On Price To Income Ratio In Jakarta... *Corresponding Author: Dian Putri Pradana www.aijbm.com 62 | Page Figure 2.2: Housing Preferences from Various Literature Resources (Source: Author’s Analysis)
  • 5. Analysis Of Housing Affordability By Generation Y Based On Price To Income Ratio In Jakarta... *Corresponding Author: Dian Putri Pradana www.aijbm.com 63 | Page Based on 18 possible reasons offered on survey conducted by Lachman Associates Survey (2014), Generation Y preferences in deciding which house to purchase is mostly because of wanted more space (24%) and job location accessibility with the same amount of percentage (24%). While their least reasons are educational facilities (10%) followed by their indecisive choice of living by wanting to trynew places to live with the same amount ofpercentage (10%). Still from the Lachman Associates Survey (2014) Gen Y preferences mostly focus on management handles in repairs and maintenances, flexibility in how long the buyer can do the mortgage, and the commitment duration between the seller and the buyer. Several facilities such as garage parking, internet connection, and eco-friendly features as energy saving appliances are also considerations. While in the neighbourhood aspect, they prefers neighbour that has the same lifestyle as them. 2.6. Indonesian Generation Y Population Profile There are 63 million Generation Y in Indonesia or equals to 24% of working age populations and categorized as a majority group in Indonesia demographic structure, which further it can be classified into two categories; Junior Gen Y who was born in 1991 to 1998, and Senior Gen Y who was born in 1983 to 1990 (Bappenas, 2019). According to IDN Research Institute (2019); when it comes to priority, Senior Generation Y differentiate it into three which are becoming good parents (58%), buying a house (51,5%), and making parents happy (52,7%). Similar to it, Junior Generation Y classified it into two which are buying a house on their top priority list (56,7%) and making parents happy (55,9%). Generation Y mostly spends their salary or income focuses on 5 products. Defined as clothes or garment, mobile phone, computer or laptop, and household items. While in entertainment and recreation expenses it divided into music, movies, games, photos, and traveling. 2.7. Jakarta’s Real Estate Problem The retail industry continues to grow, housing in Jakarta remains as a problem. According to Perumnas Official Website, Perumnas finally decided to do massive improvement by building 30.000 low-cost housing units as a solution while in fact it’s not. Global Business Guide Indonesia (2014) reported that Jakarta required an additional 800.000 new housing units annually because of the increasing population caused by urbanisation. 2.8. Price to Income Method Journal of Economics, Business and Management, Vol. 3, No. 12 (2015) stated that Price to Income Ratio can be defined as a “Median Multiple” or median house price divided by median annual gross pre-tax household income. Simply as the average house price divided byaverage household income. Table 1: Previous Research using Price to Income Ratio (Source: Author’s Analysis)
  • 6. Analysis Of Housing Affordability By Generation Y Based On Price To Income Ratio In Jakarta... *Corresponding Author: Dian Putri Pradana www.aijbm.com 64 | Page 2.9. Mixed Method Analysis Mixed methods research classified as a research where the researcher combines the elements of qualitative and quantitative research in order to gain wider and deeper understanding (Schoonenboom & Johnson, 2007). In order to fulfil the research objectives, researcher need to use the mixed methods analysis and convinced by the previous research Table 2: Previous Research using Mixed-Methods Analysis (Source: Author’s Analysis) Table 2: Previous Research using Mixed-Methods Analysis (Source: Author’s Analysis)
  • 7. Analysis Of Housing Affordability By Generation Y Based On Price To Income Ratio In Jakarta... *Corresponding Author: Dian Putri Pradana www.aijbm.com 65 | Page III. HYPOTHESIS DEVELOPMENT 3.1. Product Specifications towards House Pricing Product specifications can be further determined as building façade and interior design (Hofman, 2010), brand (Rahadi, 2012), security and accessibility (Hapsariniaty, 2013) in affecting customer preferences to buy a house. Those preferences gathered from literature review and interview questions conducted by Rahadi (2012), with ten questions focusing on underlying reasons for real estate developer when deciding to set a price. Based on that interviews the data can be concluded that seven respondents agreed that design affect housing price, six respondents considered brand, five respondents considered facilities, and four respondents considered the accessibility. Based on the statements above, it can be concluded the hypothesis formula as follows: H1: Product Specifications has a significant positive influence on the growth of housing price 3.2. Future Considerations towards House Pricing Future considerations consist of the reputation and reinvestment value (Rahadi, 2012) which can be further described the influence of low interest rate and the continued investment of multinational corporations and easy homeownership have developed new property investors from wealthy group. At the same time, rising market has increased the housing price (Kamal, 2016). H2: Future considerations has a significant positive influence on the growth of housing price 3.3. Dwellers Characteristics towards House Pricing Dwellers characteristics consist of the demographics, social economy and neighbourhood (Hapsariniaty, 2013) which can be further determined as the population increases and can be attributed to migration of local citizens and foreign workforce also the returns of people from overseas has contributed to the increasing of demand that is positively related to the house price (Kamal, 2016). While the social-economy is affected from the increasing of construction cost that isn’t aligned with the increasing of dwellers’ income (Hassan & Osmadi, 2016). H3: Dwellers characteristics has a significant positive influence on the growth of housing price 3.4. Supplemental Factors towards House Pricing Bourassa (1996) stated a concept where house pricing is affected by the supplemental factors such as mortgage payments, maintenance expenses and property taxes. While other factors focus on the developer point of view, supplemental factors affected by the government policy also and financial factor. Abdullah (2012) said that for the first-time buyer, financial factor is the most crucial consideration for them in purchasing a house. H4: Supplemental factors has a significant positive influence on the growth of housing price 3.5. House Pricing towards Affordability In calculating the affordability, house price is the most-used factor in the ratio. An already high or increasing price-income ratio should immediately signal to urban managers that they should take urgent action in fixing the condition (Bertand, 2018). A high price-income indicates a discrepancy between housing supply and demand, so when the demand is high and the supply is low it causes the house price to increase and lower the affordability (Bertand, 2018). H5: House pricing has a significant negative influence on the growth of affordability. IV. CONCLUSION The following conceptual framework is developed to meet the objectives of this study. This conceptual framework explained the correlation between the independent variables toward house pricing and affordability. The conceptual framework of this research can be seen in Figure 3 below:
  • 8. Analysis Of Housing Affordability By Generation Y Based On Price To Income Ratio In Jakarta... *Corresponding Author: Dian Putri Pradana www.aijbm.com 66 | Page Figure 3. Conceptual Framework (Source: Author’s Analysis) From the data analysis above, we can conclude that there are three main preferences in purchasing a house such as product specifications (building façade, interior design, brand, security, and accessibility), future considerations (reputation and reinvestment value), and dwellers characteristics (demographics, social economy and neighbourhood). Supplemental factors (mortgage payments, maintenance expenses and property taxes) unconsciously also affects the housing price outside the preferences that will further influence the housing price and affordability. Further research should be conducted to improve the findings of this research by conducting interviews to the real estate experts and survey to Gen Y in order to gain their specific preferences and wages. Those findings can be used to calculate the Price to Income Ratio and find the solutions to achieve the ideal condition. REFERENCES [1]. Anon (2010), “No place like home: the generation who can’t afford to buy”, The Independent, 16 March, available at: www.independent.co.uk/life-style/house-and-home/property/no-place-like-home- the-generation-who-cant-afford-to-buy-1921781.html [2]. Baker, D. (2008). The housing bubble and the financial crisis. Washington DC: Center for Economic and Policy Research. [3]. Global Property Guide (2013), “Indonesia’s property market - a real estate boom in the making?”, Global Property Guide, available at: www.globalpropertyguide.com/Asia/indonesia/Price-History [4]. Hapsariniaty, A.W. (2013), “Analisis Perbandingan Preferensi Masyarakat Golongan Menengah Dalam Memilih Hunian pada Gated Communities di Kawasan Kota dan Pinggiran Kota Bandung: Studi KasusKec. Kiara Condong dan Kec. Parongpong (Comparative Analysis of Middle-Class’ Preferences Choosing to Live in Gated Communities in the Urban and Suburban area of Bandung: Case Study Kec. Kiara Condong and Kec. Parongpong), Master Thesis”, School of Architecture, Planning, and Policy Development, Institut Teknologi Bandung, Bandung. [5]. Hashim, Z.A., House Price and Affordability in Housing in Malaysia Akademika, 2010. 78: p. 37-46. [6]. Hofman, E., Halman, J.I. and Ion, R.A. (2006), “Variation in housing design: identifying customer preferences”, Housing Studies, Vol. 21 No. 6, pp. 929-943. [7]. Opoku, R. A., Abdul-Muhmin, A. G. (2009), Housing preferences and attribute importance among low-income consumers in Saudi Arabia, Habitat International, 2009. [8]. Purwandi l, 2016, “Indonesia 2020: The Urban Middle Class Millenials”, Alvara Research Center [9]. Purwandi l., 2017,” Milenial Nusantara”, PT Gramedia Pustaka Utama [10]. Rahadi, R.A., Wiryono, S.K., Koesrindartoto, D.P. and Syamwil, I.B. (2013), “Factors influencing housing product value and price in Jakarta metropolitan region”, 2013 AMER International Conference on Quality of Life, Langkawi, 8 November, Procedia - Social and Behavioral Sciences, pp. 368-378.
  • 9. Analysis Of Housing Affordability By Generation Y Based On Price To Income Ratio In Jakarta... *Corresponding Author: Dian Putri Pradana www.aijbm.com 67 | Page [11]. Rahadi, R. A., Wiryono, S. K., Koesrindartoto, D. P., Syamwil, I. B. (2012). Relationship between Consumer Preferences and Value Propositions: A Study of Residential Product. AcE-Bs 2012 Bangkok Procedia - Social and Behavioral Sciences [12]. Ratnaningsih, I. Z., & Prasetyo, A. R. (2017). Work-Life Balance pada Generasi Y. Dalam Asosiasi Psikologi Industri dan Organisasi, Prosiding Temu Ilmiah Nasional APIO 2017 (hal. 208-216). Jakarta: Himpunan Psikologi Indonesia. [13]. Sezin, Baysal, 2014, “Working with Generations X and Y In Generation Z Period: Management Of Different Generations In Business Life”, Mediterranean Journal of Social Sciences MCSER Publishing, Rome-Italy The Council of Economic Advisers. (2014). 15 Economic Facts about Millennials. Washington D.C: The Council of Economic Advisers. [14]. Sharam, A. 2012. ‘Smart Housing’, Presentation to the Housing Melbourne Symposium, 7th November, Office of the Victorian Government Architect, Swinburne University and the Princes Foundation, National Gallery of Victoria. http://www.ovga.vic.gov.au/images/Alves_Sharam_McShane_words.pdf. [15]. Stone, M. E.. What is housing affordability? The case for the residual income approach. Housing Policy debate, 2006. 17(1), Pp. 151–184. [16]. Tan, T.H., Affordable Housing for First-Time Homebuyers: Issues and Implications from the Malaysian Experience, in 1st International Conference on Innovation and Sustainability (ICOIS 2013)2013: Sunway Resort Hotel, Kuala Lumpur. [17]. Thalmann, Phillippe. 2003. “House Poor” or Simply “Poor”? Journal of Housing Economics 12(4):291–317. [18]. Tan, T.H. (2011), “Measuring the willingness to pay for houses in a sustainable neighborhood”, The International Journal of Environmental, Cultural, Economic and Social Sustainability, No. 7, pp. 1-12. [19]. Tan, T.H. (2012), “Meeting first-time buyers’ housing needs and preferences in greater Kuala Lumpur”, Cities, Vol. 29 No. 1, pp. 389-396. [20]. Wang, D. and Li, S.M. (2006), “Socio-economic differentials and stated housing preferences in Guangzhou, China”, Habitat International, Vol. 30 No. 2, pp. 305-326. [21]. Yang, Z., & Shen, Y.. The affordability of owner occupied housing in Beijing. Journal of Housing and the Built Environment, 2008. 23(4), Pp. 317-335. [22]. Yin, Robert K. 2013. Case study research: Design and methods. 5th Los Angeles: Sage.