Ahli bank weekly capital markets newsletter 9th 13th of august 2020
•
0 likes•99 views

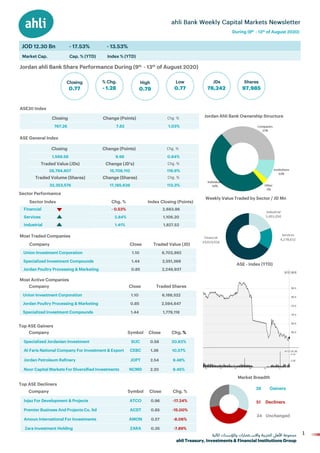
This document provides a summary of investment market performance and activity. It lists percentage changes for various stock market indexes globally. It also identifies the most actively traded companies by shares and value on different indexes. Finally, it notes the top gaining and declining companies by percentage change on each market index. The information conveys an overview of recent investment market movements and prominent trades.

Recommended
Recommended
More Related Content
What's hot
What's hot (20)
Similar to Ahli bank weekly capital markets newsletter 9th 13th of august 2020
Similar to Ahli bank weekly capital markets newsletter 9th 13th of august 2020 (13)
More from ahli bank
More from ahli bank (17)
Recently uploaded
Recently uploaded (20)
Ahli bank weekly capital markets newsletter 9th 13th of august 2020
- 1. 1 INVESTMENT استثمار Chg. % Chg. % Chg. % Chg. %
- 3. 3 INVESTMENT استثمار Dow Jones 1.81 % S&P 500 0.96 % Nasdaq 0.22 % FTSE 100 0.96 % EGX30 1.17 % Dubai 2.27 % Nikkei 225 3.89 % USA UK Egypt Japan UAE KSA Tadawul 2.72 % Most Active (shares) Most Active (value) Index Company Sector Shares Company Sector Value CCY Dow Jones Apple Inc Technology 50 Million 1 Apple Inc Technology 22.8 Billion USD S&P 500 General Electric Industrials 69 Million Amazon Technology 14.8 Billion USD Nasdaq ADV Micro Devices Technology 55 Million Tesla Technology 27.6 Billion USD FTSE 100 Lloyds Group Financials 677 Million Astrazeneca Health Care 509 Million GBP Nikkei 225 Mizuho Financials Financials 571 Million SoftBank Group Financials 637.5 Billion JPY Tadawul Dar Al Arkan Real Estate 257 Million Dar Al Arkan Real Estate 1.9 Billion SAR Dubai Union Properties Real Estate 422 Million Emirates NBD Financials 215 Million AED EGX30 Orascom Holdings Financials 384 Million Commercial Bank Financials 433 Million EGP Top Gainers Top Decliners Index Company Sector Ch. % Company Sector Ch. % Dow Jones Dow Inc Materials 5.25% 1 Cisco Technology -10.39% S&P 500 Ryl Crbn GRP Cyclicals 16.12% Duke Energy Energies -5.15% Nasdaq Tesla Technology 13.63% Jumia TechNLG Technology -30.06% FTSE 100 EVRAZ Materials 11.50% Avast Technology -3.37% Nikkei 225 NSK Cyclicals 16.55% Taiyo Yuden Industrials -8.48% Tadawul Saudi Paper Materials 20.70% Cement South Industrials -7.58% Dubai Aramex Cyclicals 10.95% Arabtec Real Estate -11.47% EGX30 Egyptian IR Materials 10.62% Juhayna Food Materials -8.24%