1. IS6030: Data Management-Individual Project
Topic: Drug related deaths in the state of Conncecticut
A. Data Description:
Thisdatasethas the listingof eachaccidental deathassociatedwithdrugoverdosein Connecticutfrom
2012 to June 2016. Inthisdatasetcolumnsfrom‘Heroin’to‘AnyOpioid’have valuesYor Null.That
meansitstateswhetherthe particulardrugwas the cause of deathor not.The deathcan be causedby
one or more drugs. Data was derivedfromaninvestigationbythe Office of the Chief Medical Examiner
whichincludesthe toxicityreport,deathcertificate,aswell asa scene investigation. Igotthisdata from
catlog.data.govwebsite andfollowingisthe linkforthe same:
https://catalog.data.gov/dataset/accidental-drug-related-deaths-january-2012-sept-2015
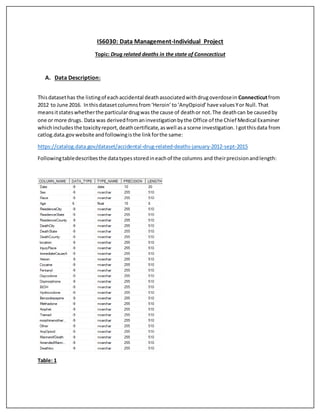
Followingtabledescribesthe datatypesstoredineachof the columns and theirprecisionandlength:
Table: 1
2. Afterimportingthe datasetinSQLserver,Imade sure that all data typesare appropriate anddata is
importedcorrectly.(Code forthe same isincludedincode file).Inthe nextstepIdidsome basicchecks
on importantcolumnslike findingoutdistinct values,numberof null recordsandmaximum, minimum
and average valuesforthe numerical variablesetc.:
Sex:
Race:
Death cause:
Death locations:
Thisdata can be normalizedusing‘Case Number’asthe primarykey(Thiscolumnwasremovedfrom
datasetas it wasnot necessaryforanalysis).Andthe othercolumnslike age,race,‘ImmeddiatecauseA’
etc.can be put intodifferenttable withforeignkeyinthe maintable.
B. Data Issues:
There were manydata issuesthatneededtobe resolvedbeforestartingthe analysisonthe data:
1. Null Values:There were some null valuesinsome columnsof the dataset.Asthe numberwas
not verylarge (max:7) these recordswere removedfromthe dataset. Thiswasdone inexcel.
2. Date Format: While importingdatasetinTableu,Ifoundthatdate format is not consistent.(Idid
not face thisissue inwhile importingdatainSQL).To solve thisIcreatedtwomore columnsfor
yearand month.(Before doingthissome yearvaluesweremissingfromthe visualizationdue to
improperformat)
3. Data structure: With the currentdata structure it wasnot possible togetrequiredvisualizations
inTableu.Data was restructuredinexcel togetthe same.
4. Inconsistencyin time frame: Inorder to compare the data across the years,average death
count permonthwas usedas foryear 2016, data of onlysix monthsisavailable.
Most of these operationsweredone inusingExcel.Alsofunctionslike‘SUMIFS’,‘CONCAT’,
‘RIGHT’, ‘MID’,‘YEAR()’,‘MONTH()’etc.were used.
3. C. Data Analysis in SQL:
Total Numberof rows:
Total numberof columns:
Numberof deathsbyyear: (countfor2016 will be lessasit has onlysix monthsdata):
Numberof deathsbySex:
Numberof deathsbyage bracket:
Max, minand average valuesforage:
4. Numberof deathsbyRace:
D. Primary Data Analysis using Tableau :
Average deathcountpermonthis increasingwithalmostconstantrate overpast5 years:
Fig. 1
5. From Figures2,3 and 4, we can see thatthoughthe numberof average deathspermonthis maximum
for White people,areaswith maximumnumberof deaths (countof all deathsfrom2012-2016) are
mainly concentratednearthe locationswherepopulationof Black,HispanicandLatinopeople isdense:
Fig. 2
Fig. 3
6. Fig. 4
For all the races exceptBlackHeroinwasthe leading cause of death,butincase of blacks Cocaine was
the leadingcause:
Fig. 5
7. Numberof average deathspermonth ismaximumforage group of 40-49 and inall age group20-60 is
the primary victim:
Fig. 6
Heroinisthe main cause of deathsfollowedby cocaine:
Fig. 7
8. Comparedtoall otherdrugsFentanyl hasthe highestincrease inthe deathsoverthe years.Aswe can
see fromthe figure below,deathcount because of all otherdrugsincreasessteadily,butthere isajump
inthe numberof deathsbecause of Fentanyl (speciallyin2016):
Fig. 8
From the following plot, we canclearlysee thatareaswithmaximumnumberof deathsare
concentratedexactlynearthe locationswherepercapitaincome isquite low:
Fig. 9
9. Followingisthe graphof Age vstotal numberof deathsfromyear2012-2016. From the thisgraph we
can see that there isa strong positive correlationbetweenage andnumberof deathsinthe lower
spectrumof age and a strongnegative correlationinhigherspectrumof age.
Fig. 10
E. Correlation and Regression Analysis using R-studio:
Let’scheck the correlationandrunthe regressionanalysisonthe same:
R-studiowasusedtorun the statistical analysisonthe data.
a. CorrelationAnalysis:
1. Followingisthe correlationbetweenage (lowerage group15-25) and the average numberof
deathsperyear (i.e.Total numberof deaths/4.5,astotal numberof yearsis 4.5):
0.9812866
2. Followingisthe correlationbetweenage (Middle age group26-44) and the average numberof
deathsperyear:
0.1022106
3. Followingisthe correlationbetweenage (higherage group45-80) and the average numberof
deathsperyear:
-0.955015
10. b. RegressionAnalysis:
As we can see fromabove valuesthere ishighcorrelationin lowerandhigherrange of agesand
the average numberof deathsperyear. Now we will runthe regressionanalysis (UsingR-studio)
on these age groups:
1. Regressionanalysison Lower Age group (15-25):
Followingisthe plotof the lowerage groupvsaverage numberof deathsperyear:
Fig. 11
Let’srun the regressionmodel onthe data:
11. From the above outputwe can see that ‘P’valuesforbothage and interceptare lessthan0.05. This
meansthat ‘Beta’coefficientforage issignificantlydifferentfrom 0 andage issignificantfactorinthe
regressionmodel. Asthisissimple linearregressionmodel we getthe same Pvaluesfort-testandF-
test.
Alsothe valuesforR-square andadjustedR-square are quite highi.e.0.9629 and 0.9583 respectively.
So, the final model thatwe generate fromabove analysis:
Average number of deathsper year=1.7576*(Age) - 28.1160
Let ustake a lookat the plotof residualsvsfittedvalues:
s
Fig. 12
As we can see fromthe above plotthere isno specificpatterninthe residuals,theyare randomly
scattered. Thismeansthatwe have capturedmost of the signal fromthe data indeterministicpartof
our model andremainingisjustarandom noise.
12. Now,let’scheck the normalityof the residuals usingthe q-qplot.Thisisourassumptionandwe needto
validate that:
Fig. 13
We can clearlysee thatabove q-qplotisprettymuch a straightline passingthrough0 whichvalidates
our assumptionof normalityof errors withmean0 (asline ispassingthrough0).
13. 2. Regressionanalysison Higher Age group (45-80):
Followingisthe plotof the higherage groupvsaverage numberof deathsperyear:
Fig. 14
Now,let’srunthe regressionmodel onthe data:
14. From the above outputwe can see that ‘P’valuesforbothage and interceptare lessthan0.05 for
higherage groupas well.Thismeansthat‘Beta’coefficientforage issignificantlydifferentfrom0and
age issignificantfactorinthe regressionmodel. As thisissimple linearregressionmodelwe getthe
same P valuesfort-testandF-test.
Alsothe valuesforR-square andadjustedR-square are quite highi.e.0.9121 and 0.9089 respectively.
So,the final model thatwe generate fromabove analysis:
Average number of deathsper year=(-0.91072)*(Age) +65.06579
Let ustake a lookat the plotof residualsvsfittedvalues:
Fig. 15
As we can see fromthe above plot there isa straightline of residualsinthe lowerregionof fittedvalues,
but onoverall level itlooksquite scattered. Thismeansthatwe have capturedmostof the signal from
the data (specificallyinhigherfittedvalue spectrum) indeterministicpartof our model andremainingis
justa randomnoise.
15. Now,let’scheckthe normalityof the residuals usingthe q-qplot.Thisisourassumptionandwe needto
validate that:
Fig. 16
We can see fromabove plotthat apart fromthe curvature at the (-1) quantile,ourplotismostlya
straightline.
16. F. Key Findings and Insights:
1. The areas withmaximumnumberof deathsare concentratedexactlynearthe locationswhere
percapita income isquite low
2. The areas withmaximumnumberof deathsare mainlyconcentratednearthe locationswhere
populationof Black,HispanicandLatinopeople is dense thoughtthe numberof deathsbydrug
are maximumforwhite people
3. For all the races exceptBlack, Heroinwasthe leadingcause of death,butincase of blacksit was
Cocaine
4. ThoughHeroinisthe maincause,Fentanyl hasthe highest rate of increase inthe deaths count
overthe years.
5. Numberof average deathspermonthismaximumforage group of 40-49
6. We couldsee the peaksinthe deathcount aroundage 30 andage 50 and there isa dipin the
deathcount aroundage 40.
G. Suggestions:
1. As we clearly see thatage group 20-60, whichisthe backbone generationof anynation, isthe
primaryvictimof the drugs and thatis mainlydue tolow income whichinturnI thinkisdue to
lack of education(whichcanprovide themwithdecentjobs).Thisisthe bigconcern as number
isincreasingeveryyearandgovernmentneedstoaddressthisissue andplantoprovide basic
educationtothese people whichcanmake thememployable.
2. As Fentanyl hasthe highestgrowthinthe drugcount,it isnot enoughtocurb the supplyof just
heroinorcocaine
H. Challenges:
1. Many data issuesneededtobe resolvedwhile plottingdatainTableau.Learnedvarious
functionsinexcel toovercome them.
2. As there were toomanyvariablesinthe data,itwas difficulttocarryout the structured
exploratorydataanalysistogainmeaningfulinsights.Example,variableslike age,race,typesof
drugsetc. formnumerousnumberof combinationsonwhichthe trendof deathcountcouldbe
analyzed.