1. United Nations Statistical Commission ESA/STAT/AC.193/1
United Nations Statistics Division
Instituto Nacional de Estadística y Geografía de México November 2009
Meeting of the Friends of the Chair of the United Nations
Statistical Commission on Statistical Indicators on
Violence against Women
9 - 11 December 2009
Aguascalientes, Mexico
Methodological Overview of Surveys on Violence against Women 1
By United Nations Statistics Division 2
1
Issued without formal editing.
2
This paper is edited and finalized by Srdjan Mrkić of the United Nations Statistics Division based on the research and
first draft by Ms. Bosiljka Djikanović acting as a consultant to the United Nations Statistics Division.
2. 2. Indicators on Violence against Women
21. These indicators have been presented in Tables 1 to 6, and their description is elaborated in
paragraphs below.
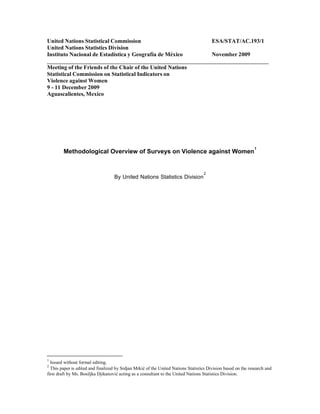
2.1 Total and age-specific rate of
women subjected to physical violence Figure 1. Availability of statistics on physical
in the last 12 months by severity of violence against women in the last 12 months by
indicator components
violence, relationship to the 100
perpetrator(s) and frequency 80
22. Availability of this indicator in nationally
representative surveys is presented in 60
Percent
Table 1 and Figure 1, as well as its
disaggregation by severity, relationship to 40
the perpetrator(s), and frequency.
20
Total rate 0
Total rate Age-specific Total rate by Total rate by Total rate by
23. Total rate of women subjected to physical
violence in last 12 months was available
in ten surveys (17%). In one national
survey, that figure encompassed total
violence, not just physical, and therefore,
it could be an overestimate,
which has to be taken into account when rate severity relationship frequency
comparing indicators themselves.
Age-specific rate
24. Further disaggregation for age groups was available for just three surveys, but in 10-year age
groups. In one of them, age specific rate was not calculated for the total number of interviewed
women in each age group; instead, it presents a simple breakdown of the total rate, by age groups.
Presenting data in such a way limits comparisons with standard age-specific rates, coming from
other surveys.
25. However, standard age-specific rate was available in another fifteen surveys as well, although total
rate was not presented. These rates were coming from WHO-VAW Multi-country surveys.
Severity
26. Disaggregation by severity of physical violence suffered by women in the past 12 months was
available in less than half of the considered surveys (27 or 44%). Categories “moderate” and
“severe” were provided in 24 surveys, while acquired injuries, as an indicator of severity of violence,
were presented in four surveys.
Relationship to the perpetrator
27. Relationship to the perpetrator, distinguished for at least an intimate partner, was available in almost
two thirds of the surveys (38 or 63%). Out of these 38, 30 mentioned just an intimate partner as a
perpetrator, while the rest (eight) of the surveys considered other categories of perpetrators. If not
indicated differently, total rate by the relationship to the intimate partner as a perpetrator is
presented as a proportion of ever-partnered or ever-married women who experienced intimate
partner violence during the last twelve months.
2
3. Frequency
28. The information on frequency of women subjected to physical violence in the last 12 months was
available in just two surveys (3%), but disaggregated by either severity or age group, and therefore,
their values have not been presented in Table 1.
2.2 Total and age-specific rate of women subjected to physical violence during lifetime by severity
of violence, relationship to the perpetrator(s) and frequency
29. Availability of this indicator in nationally Figure 2. Availability of statistics on physical
representative surveys is presented in violence against women during lifetime by indicator
Table 2, as well as its disaggregation by components
severity, relationship to the perpetrator(s), 100
and frequency. 80
Total rate 60
Percent
30. Total rate of women subjected to physical 40
violence during lifetime was retrieved
from 30 surveys (50%). There is possible 20
overestimation of the total rate which
comes from the one national survey, 0
since it presents both physical and sexual
Total rate Age-specific Total rate by Total rate by Total rate by
rate severity relationship frequency
violence. The total rate from another
survey is also of the vague quality, since women were asked for experience with violence in their
families, but not directly whether it happened to them.
Age-specific rate
31. Disaggregation of rates for age groups was available in 17 surveys (29%), although in seven of
them, the total rate was not available; these were coming from WHO-VAW Multi-country surveys.
Severity
32. Disaggregation by severity of lifetime physical violence against women was available in two thirds of
the considered surveys – in 39 surveys (66%). Both categories “moderate” and “severe” were
considered in 28 surveys, while acquired injuries, as the single indicator of severity of violence, were
presented in 5 surveys.
Relationship to the perpetrator
33. Statistics on relationship to the perpetrator(s), for at least one and the most common category -
current or former intimate partner - was available in a significant majority the surveys, i.e. 49
surveys (83%). In general, total rate of women subjected to physical violence by the intimate partner
as a perpetrator is presented as a proportion of ever-partnered or ever-married women who
experienced physical intimate partner violence during their lifetime. In two surveys, this rate is a
proportion of women who experienced physical violence starting from age 15; in one survey, it is a
proportion of women who experienced moderate (and severe) abuse, while in another one, the rate
referred to the last five years, not the lifetime.
3
4. 34. Six surveys recognized and separately measured intimate partner violence perpetuated by current
partner and former partner. Further disaggregation by perpetrators other than intimate partner was
available in fifteen surveys.
Frequency
35. Frequency of different acts of physical violence against women was available in just six surveys
(10%). In two of them, data are disaggregated by either severity of violent acts, or age group, and,
therefore, their values have not been presented in Table 2. In three surveys, data on frequency are
available, but just among women who experienced violence by perpetrators other than intimate
partners. In one survey, frequency statistics are available, although the question itself is unclear and
imprecise; the indicator is noted in Table 2, under an assumption that women are the victims of the
violent acts happening in their families. It could be implied that generating statistics on frequency in
this manner refers primarily (or exclusively) to intimate partner violence, although that is not
completely clear.
36. This practically means that none of the surveys provided reliable data of frequency of physical
violence against women during their lifetime, no matter of perpetrator. All six generated values have
their own limitations and they are not mutually comparable.
2.3 Total and age-specific rate of women subjected to sexual violence in the last 12 months by
relationship to the perpetrator(s) and frequency
37. Availability of this indicator from Figure 3. Availability of statistics on sexual violence
nationally representative surveys is against women in the last 12 months by indicator
presented in Table 3, as well as its components
disaggregation by relationship to the 100
perpetrator(s) and frequency. 80
Total rate 60
Percent
38. Total rate was retrieved from just eight 40
surveys (13%). For one of them, it is
not clear whether available rate presents 20
sexual violence by all perpetrators, or
just by an intimate partner. 0
Total rate Age-specific rate Total rate by Total rate by
relationship frequency
Age-specific rate
39. Disaggregation by age groups was available in one third of the surveys – in 20 surveys (34%). Five
years age groups, as proposed by the friends of the Chair, were available in 15 surveys, while at
the other five, a combination of 5-year and 10-year intervals was presented.
Relationship to the perpetrator
40. Information on the relationship to the perpetrator was generated in 38 surveys (64%), for at least
whether the violence was perpetrated by the intimate partner. For the other, non-partner
perpetrators, out of these 38 surveys, data were available in just four of them. One survey made
distinction between current and former intimate partners as perpetrators of violence.
4
5. Frequency
41. Frequency of this act was available in just one survey, and it refers to a spouse (intimate partner) as
a perpetrator.
42. This practically means that frequency is largely missing for this indicator as well.
2.4 Total and age-specific rate of women subjected to sexual violence during lifetime by
relationship to the perpetrator(s) and frequency
43. Availability of this indicator in nationally
representative surveys is presented in Figure 4. Availability of statistics on sexual violence
Table 4, as well as its disaggregation by against women during lifetime by indicator
relationship to the perpetrator(s) and components
frequency. 100
80
Total rate
60
44. This indicator was retrieved from 20% of
Percent
the surveys (12 out of 59 surveys). 40
Age-specific rate 20
45. Age-specific rate was available for 18 0
Total rate Age-specific rate Total rate by Total rate by
surveys (29%). Five years age groups, relationship frequency
as proposed by the friends of the Chair,
were available in 16 surveys. In four surveys (four), statistics by 5-year age groups were available
only for violence perpetrated by the intimate partner.
Relationship to the perpetrator
46. Information on the relationship to the perpetrator was available for 42 surveys (71%), where at least
an intimate partner was distinguished as a perpetrator. A few surveys distinguished violence
perpetuated by current and former partners. In 28 surveys information on the relationship to the
perpetrator, in addition to an intimate partner, includes data for other categories of perpetrators of
sexual violence as well.
Frequency
47. Frequency of this act was available in just 4 surveys (6%). In three of them, frequency is broken
down in just two groups (1-2 times, and three and more times), exclusively for non-intimate partner
violence. Hence, this indicator is also largely missing.
2.5 Total and age-specific rate of women subjected to sexual or physical violence by current or
former intimate partner in the last 12 months by frequency
48. Availability of this indicator in nationally representative surveys is presented in Table 5, as well as its
disaggregation by age and frequency.
5
6. Total rate
49. In the process of developing this methodological overview it became apparent that the last two set
of indicators – intimate partner violence –
pose methodological challenges. The first
one, also recognized in the report of the Figure 5. Availability of statistics on sexual or
physical by current or former intimate partner in the
Friends of the Chair, is that these two last 12 months and during lifetime by indicator
indicators overlap with the first four, components
since they are a subset of the former. 100
This may confuse the developers of 80
statistical instruments for measuring
violence against women. 60
Percent
40
50. In addition, the way these two indicators
are defined - as either physical OR 20
sexual violence, performed by an 0
intimate partner – would imply that one Total rate Age- Total rate Total rate Age- Total rate
form of violence excludes the other. For specific
rate
by
frequency
specific
rate
by
frequency
example, analysts and compilers of
results might be unsure whether to add all the occurrences of both physical and sexual violence
suffered by a woman or to focus on the one with most incidences. Physical violence by intimate
partner is much more frequent than sexual violence; therefore applying the definition as it stands
might underestimate occurrences of sexual violence. Sexual violence in many cases appears along
with physical violence, i.e. overlap with it.
51. Consequently, this indicator and the accompanying rate can be defined as physical AND/OR sexual
violence, among ever-partnered women. Some national surveys considered this comprehensive
indicator, which is the case when WHO-VAW method was applied. When indicator concerns just
physical violence, it was indicated in footnotes to Table 5.
52. Total rate of women subjected to intimate partner violence in the last 12 months was available from
62 surveys (63%). Four of them considered just physical violence, and therefore, such a figure could
be underestimated because data for sexual violence are missing.
Age-specific rate
53. Further disaggregation by age groups of women suffering violence was available for less than half of
surveys – 29 surveys (49%). Five years age groups, as proposed by the Friends of the Chair, were
available in 23 surveys, while for the rest of them, different combinations of age intervals were
presented.
Frequency
54. Frequency of this act was available in thirteen surveys, or 22%.
2.6 Total and age-specific rate of women subjected to sexual or physical violence by current or
former intimate partner during lifetime by frequency
55. Availability of this indicator in nationally representative surveys is presented in Table 6, as well as its
disaggregation by age and frequency.
6
7. Total rate
56. This indicator was retrieved from more than three quarters of the surveys – 46 surveys (78%, Table
6). As mentioned above, indicator proposed in this way might be missing certain number of women
who experienced both sexual and physical intimate partner violence during their lifetime, and
therefore, in certain cases (indicated in the footnotes) this indicator is underestimated.
Age-specific rate
57. Further disaggregation for age groups was available for more than half of the surveys – 31 surveys
(53%). Five years age groups, as proposed by the friends of the Chair, were available in 26
surveys, while for the rest of the surveys (five), different combinations of age groups were
presented.
Frequency
58. Frequency of this act was available in just three surveys (5%).
Concluding remarks
59. Statistics for only one indicator – women experiencing physical violence during lifetime by
relationship to the perpetrator - were generated by over 80% of the total number of surveys
subjected to this analysis. And even for that indicator the list of relationship in most cases included
current or former intimate partner, not the fully developed list of different relationships. Data for all
the other indicators were generated by a fewer number of surveys. It is especially telling to note the
very low number of surveys that were generating information on frequency of violence against
women for all forms violence.
60. The relationship to the perpetrator of violence against women was one of the major focuses of all
the surveys. It is necessary to note that the classification of perpetrators in most cases stopped at
the intimate partner (current or former) and in cases where it was extended, it differed significantly
from one survey to the other.
61. The relative lack of the availability of the total rate of women subjected to physical violence in the last
12 months and during lifetime (17% and 50%, respectively) and sexual violence in the last 12 months
and during lifetime (14% and 20%, respectively) points to the need to further investigate the type of
methodological obstacles that prevented such computations. Similarly, the availability of statistics on
age-specific rates for both physical and sexual violence was available in about one-third of the
surveys and this also calls for additional technical analysis on the computation of rates.
62. It appears that the last two indicators of the interim set – physical or sexual violence by current of
former immediate partner in the last 12 months and during lifetime – need to be revisited. The first
conclusion is that they should be reformulated in the line of including the and/or qualifier, replacing
just the or.
63. More substantially, these two indicators differ from the first four only by the fact that both physical
and sexual violence are added together and that the denominator for the rates refers to ever-
partnered women only – not to the total number of women in 5-year age groups. The fact that they
are essentially redundant with the first four appears to generate confusion in applying the interim set
of indicators. This overview found that even for the first four indicators the denominator is more
7
8. often than not the total number of ever-partnered women when age-specific rates of women
subjected to violence are calculated.
64. Furthermore, given the ongoing discussion that the definition of the intimate partner should not be
limited only to a partner in sexual intercourse, but could also be extended to a non-sexual
relationship – boyfriend, for example – raises the questions how significant is the difference between
the number of ever-partnered women and the total number of women in each age group. It can be
expected that the differences might be somewhat significant in very early ages under consideration
– 15 and 16; the broader definition of intimate partner would certainly decrease these differences to
the minimum in older ages – implying that almost all women over 18 were in some kind of
relationship that falls within the category of intimate.
65. The variability of the capacities of surveys for measuring violence against women included in this
overview to generate indicators as defined in the report of the Friends of the Chair points to the
need to move beyond indicators and to define and develop a set of classifications of violence,
severity of violence, definition and classification of relationship to the perpetrator, and frequency; the
need to develop international guidelines that will provide a sound and comprehensive
methodological package for instituting violence against women statistical surveys in national
statistical systems; and the need to follow-up these activities with training and capacity-building.
8
9. ANNEX A. List of the countries and sources
Country Source
ALBANIA Reproductive Health Survey
ARMENIA WRC 2007 Domestic Violence and Abuse of Women in Armenia, May 2007
AZERBAIJAN Demographic and Health Survey 2006, module on domestic violence
AUSTRALIA (1) Personal safety 2005. Australian Bureau of Statistics.
International Violence Against Women Survey (IVAWS) - Australian
AUSTRALIA (2) component, 2003
WHO Multi-country Study on Women's Health and Domestic Violence against
Women. Initial results in prevalence, health outcomes and women's responses.
BANGLADESH –
Garcia-Moreno C, Jansen HAFM, Ellsberg M, Heise L, Watts C. World Health
city and province Organization, 2005
Instituto Nacional De Estadistica, Encuesta Nacional de Demografia y Salud,
BOLIVIA 2003
WHO Multi-country Study on Women's Health and Domestic Violence against
Women. Initial results in prevalence, health outcomes and women's responses.
BRAZIL –
Garcia-Moreno C, Jansen HAFM, Ellsberg M, Heise L, Watts C. World Health
city and province Organization, 2005
CAMBODIA (1) Violence against women. A baseline survey. Cambodia Final Report, 2005
Kishor, Sunita and Kiersten Johnson. Profiling Domestic Violence – A Multi-
CAMBODIA (2) Country Study. Calverton, Maryland: ORC Macro, 2004
CANADA (1) Measuring Violence Against Women: Statistical Trends, 2006
General Social Survey on Victimization - Violence Against Women module,
CANADA (2) 2004
Kishor, Sunita and Kiersten Johnson. Profiling Domestic Violence – A Multi-
COLOMBIA Country Study. Calverton, Maryland: ORC Macro, 2004
Men's violence against women. Extent, characteristics ad the measures against
violence - 2007. English Summary. Minister for Gender Equality National
DENMARK Institute of Public Health, Denmark, National Health Survey, 2000
Kishor, Sunita and Kiersten Johnson. Profiling Domestic Violence – A Multi-
DOMINICAN REPUBLIC Country Study. Calverton, Maryland: ORC Macro, 2004
9
11. Violence and abuses against women inside and outside family, ISTAT, 2006,
also
Measuring violence: indicators from the Italian violence against women surveys.
Submittet by ISTAT, Ms Maria Giuseppina Muratore. Expert Group Meeting on
ITALY indicators to measure violence against women, Geneva, 8-10 October 2007
WHO Multi-country Study on Women's Health and Domestic Violence against
Women. Initial results in prevalence, health outcomes and women's responses.
Garcia-Moreno C, Jansen HAFM, Ellsberg M, Heise L, Watts C. World Health
JAPAN - city Organization, 2005
Kiribati family health and support study:
KIRIBATI a study on violence against women and children, 2008
Violence against women in Koreaand its indicators. Invited paper, prepared by
Whasoon Byun, Korean Women’s Development Institute. Expert Group Meeting
KOREA on indicators to measure violence against women, Geneva, 8-10 October 2007
CAHRV project: Comparative reanalysis of prevalence of violence against
women and health impact data in Europe – obstacles and possible solutions,
December 2006. (the report was prepared within the Co-ordination Action on
Human Rights Violations (CAHRV) and funded through the European
LITHVANIA Commission, 6th Framework Programme, Project No. 506348.
The Maldives Study on Women's Health and Life Experiences. Initial results on
prevalence, health outcomes and women's responses to violence. Author: Emma
MALDIVES Fulu
ENDIREH-2006’S achievements and limitations in determining indicators for
measuring violence against women in Mexico. Invited paper. Submitted by
Mexico, prepared by Eva Gisela Ramirez. Expert Group Meeting on indicators to
MEXICO measure violence against women, Geneva, 8-10 October 2007
MOLDOVA Demographic health survey (DHS), 2005
WHO Multi-country Study on Women's Health and Domestic Violence against
Women. Initial results in prevalence, health outcomes and women's responses.
Garcia-Moreno C, Jansen HAFM, Ellsberg M, Heise L, Watts C. World Health
NAMIBIA - city Organization, 2005
Kishor, Sunita and Kiersten Johnson. Profiling Domestic Violence – A Multi-
NIKARAGUA Country Study. Calverton, Maryland: ORC Macro, 2004
Thomas Haaland, Sten-Erik Clausen and Berit Schei
Couple Violence - different perspectives. Results from the first national survey
NORWAY in Norway. NIBR Report: 2005:3
PARAGUAY Encuesta nacional de demografía y salud sexual y reproductiva endssr 2004
11
12. Kishor, Sunita and Kiersten Johnson. 2004. Profiling Domestic Violence – A
Multi-Country Study.
PERU Calverton, Maryland: ORC Macro.
WHO Multi-country Study on Women's Health and Domestic Violence against
Women. Initial results in prevalence, health outcomes and women's responses.
PERU –
Garcia-Moreno C, Jansen HAFM, Ellsberg M, Heise L, Watts C. World Health
city and province Organization, 2005
Beata Gruszczyńska, Przemoc wobec kobiet w Polsce. Aspekty
prawnokryminologiczne, Oficyna Wolters Kluwer, Warszawa 2007.
POLAND Survey on Violence Against Women in Poland. Key Findings.
VIOLENłA DOMESTICĂ ÎN ROMÂNIA. Ancheta Sociologica La Nivel
ROMANIA National, Martie – Aprilie 2008
RUSSIA Violence in family. Moscow, June - Decembre 2006
WHO Multi-country Study on Women's Health and Domestic Violence against
Women. Initial results in prevalence, health outcomes and women's responses.
Garcia-Moreno C, Jansen HAFM, Ellsberg M, Heise L, Watts C. World Health
SAMOA Organization, 2005
WHO Multi-country Study on Women's Health and Domestic Violence against
Women. Initial results in prevalence, health outcomes and women's responses.
Garcia-Moreno C, Jansen HAFM, Ellsberg M, Heise L, Watts C. World Health
SERBIA - city Organization, 2005
Representative Research on Prevalence and experience of Women with Violence
SLOVAKIA against Women [VAW] in Slovakia. Bratislava, May 2008
Solomon Islands Family Health and Safety Study: A study on violence against
women and children. Report prepared by the Secretariat of the Pacific
SOLOMON ISLANDS Community for Ministry of Women, Youth & Children’s Affairs, 2009
Macro-survey regarding violence against women
http://www.migualdad.es/violencia-mujer/estadistica.html this link is broken,
SPAIN data are not the part of the report
SWITZERLAND Delivery of the report pending
CAHRV project: Comparative reanalysis of prevalence of violence against
women and health impact data in Europe – obstacles and possible solutions,
December 2006 (the report was prepared within the Co-ordination Action on
Human Rights Violations (CAHRV) and funded through the European
SWEDEN (1) Commission, 6th Framework Programme, Project No. 506348)
12
13. SWEDEN (2) Partner violence against women and men. A summary of report 2009:12.
WHO Multi-country Study on Women's Health and Domestic Violence against
Women. Initial results in prevalence, health outcomes and women's responses.
THAILAND –
Garcia-Moreno C, Jansen HAFM, Ellsberg M, Heise L, Watts C. World Health
city and province Organization, 2005
WHO Multi-country Study on Women's Health and Domestic Violence against
UNITED REPUBLIC OF
Women. Initial results in prevalence, health outcomes and women's responses.
TANZANIA –
Garcia-Moreno C, Jansen HAFM, Ellsberg M, Heise L, Watts C. World Health
city and province Organization, 2005
National Research on Domestic Violence Against Women in Turkey. Ankara,
TURKEY January 2009
Homicides, Firearm Offences and Intimate Violence 2006/07, 3rd edition
(Supplementary Volume 2 to Crime in England and Wales 2006/07) David
Povey (Ed.), Kathryn Coleman, Peter Kaiza, Jacqueline Hoare and Krista
UNITED KINDGDOM Jansson
National Crime Victimization Survey (NCVS). U.S. Department of Justice.
UNITED STATES OF Office of Justice Programs. Bureau of Justice Statistics. Intimate partner violence
AMERICA in the U.S., 2005
Kishor, Sunita and Kiersten Johnson. Profiling Domestic Violence – A Multi-
ZAMBIA Country Study. Calverton, Maryland: ORC Macro, 2004
13
14. ANNEX B. Availability of indicators proposed by Friends of Chair (1-6)
1. Total and age-specific rate of women subjected to physical violence in the last 12 months by severity
of violence, relationship to the perpetrator(s) and frequency
Availability / total number %
of surveys
1.1 Total rate 10/59 17
1.1.1. Age-specific rate 18/59 30
1.2. Total rate by severity 27/59 44
1.3. Total rate by relationship to perpetrator 38/59 63
1.4. Total rate by frequency 2/59 3
2. Total and age-specific rate of women subjected to physical violence during lifetime by severity of
violence, relationship to the perpetrator(s) and frequency
Availability / total number %
of surveys
2.1 Total rate 30/59 50
2.1.1. Age-specific rate 17/59 29
2.2. Total rate by severity 39/59 66
2.3. Total rate by relationship to perpetrator 49/59 83
2.4. Total rate by frequency 6/59 10
3. Total and age-specific rate of women subjected to sexual violence in the last 12 months by relationship
to the perpetrator(s) and frequency
Availability / total number %
of surveys
3.1 Total rate 8/59 14
3.1.1. Age-specific rate 20/59 34
3.2. Total rate by relationship to perpetrator 38/59 64
3.3. Total rate by frequency 1/59 2
4. Total and age-specific rate of women subjected to sexual violence during lifetime by relationship to the
perpetrator(s) and frequency
Availability / total number %
of surveys
4.1 Total rate 12/59 20
4.1.1. Age-specific rate 18/59 30
4.2. Total rate by relationship to perpetrator 42/59 71
4.3. Total rate by frequency 4/59 7
5. Total and age-specific rate of women subjected to sexual or physical violence by current or former
intimate partner in the last 12 months by frequency
Availability / total number %
of surveys
5.1 Total rate 38/59 63
5.1.1. Age-specific rate 29/59 49
5.2. Total rate by frequency 13/59 22
14
15. 6. Total and age-specific rate of women subjected to sexual or physical violence by current or former
intimate partner during lifetime by frequency
Availability / total number %
of surveys
6.1 Total rate 46/59 78
6.1.1. Age-specific rate 31/59 52
6.2. Total rate by frequency 3/59 5
15
16. TABLES
Table 1. Total and age-specific rate of women subjected to physical violence in the last 12 months by severity of violence, relationship to the perpetrator(s) and frequency
Dominican R.
Cambodia (1)
Cambodia (2)
Australia (1)
Australia (2)
Bangladesh
Bangladesh
Ethiopia pr.
El Salvador
Canada (1)
Canada (2)
Azerbaijan
Japan city
Brazil city
Colombia
#
Germany
Denmark
Armenia
Ecuador
Albania
Finland
Kiribati
Ireland
Bolivia
France
Egypt
India
Haiti
Italy
city
pr.
14
1.1 Total rate 4.5 8.0 4.7 8.0 3.7 11.6 2.7
15 16 17
1.1.1 Age-specific rate
15-19 36.4 19.3 19.0 13,0 20.7 0.0
20-24 26.3 23.7 18.9 12.3 32.9 7.0 1.7
25-29 25.9 18.5 8.7 7.4 34.7 5.0
30-34 27.5 15.5 17.9 9.2 34.5 4.0 2.7
35-39 9.0 12.9 5.6 4.5 27.8 5.5
40-44 20.8 6.9 9.3 2.7 22.5 2.5 2.4
45-49 2.4 9.2 8.1 3.4 14.7 1.3
50-54 15.3 1.3
55-59 10.1 1.1
60-64 0.7 1.1
65-69 0.3
70-74
1.2 Total rate by severity
acquired injuries
18 19
(consequences) 39.7 4.0 14.0
moderate (by type) 8.7 6.5 5.0 14.0 39.7 1.8 17.8 7.4 11.7 2.4
severe (by type) 17.3 9.3 3.3 3.4 10.4 5.0 6.1 21.6 3.2 1.4 0.7
1.3 Total rate by
relationship to the
20
perpetrator(s) yes
intimate partner (current or
former) 30.5 3.0 19.0 15.8 8.3 15.4 2.0 2.5 11.0 12.5 7.0 29.0 10.0 6.3 21.0 10.3 1.7 3.1
other than intimate partner: 4.0 1.3 1.1
family member 36.8 0.2
friends, neighbours 36.8 0.2
work or school 20.5 0.1
professional caregivers or
helpers 20.5
casual acquaintances 20.5 0.3
unknown person (stranger) 21.9 2.0 0.4
g 21
1.4 Total rate by frequency yes yes
once
few (2-10)
many (>10)
#
Confidentiality of study is compromised since 16% of the interviews were conducted in a presence of someone else than woman
14
not just physical, but total violence last 12 months is given here, and therefore, perhaps overestimated figure
15
age-intervals are following: 18-24, 25-34, 35-44, 45-54, and >55, sum up 100%
16
age-intervals are given as following: 16-20, 21-30, 31-40, 41-50, and 51-60
17
age-intervals are given as following: 16-24, 25-34, 35-44, 45-54, 55-64, and 65-69
18
injuries ended in emergency room
19
severity of intimate partner violence, rate is given among ever-partnered women
20
available, but just segregated by severity (moderate/severe), and therefore, is not presented here
21
available, but just segregated by age-groups
17. Table 1. Total and age-specific rate of women subjected to physical violence in the last 12 months by severity of violence, relationship to the perpetrator(s) and frequency (cont’d)
Tanzania city
Thailand city
Namibia city
Tanzania pr.
Solomon Is.
Thailand pr.
Sweden (1)
Sweden (2)
Serbia city
Nicaragua
Paraguay
Lithuania
Romania
Maldives
Peru city
Moldova
Slovakia
Peru pr.
Norway
Zambia
Mexico
Poland
Samoa
Russia
Turkey
Korea
Peru
USA
UK
1.1 Total rate 16.7 4.4 4.7
1.1.1 Age-specific rate
15-19 20.0 33.9 30.9 28.0 14.3 16.1 25.5 25.9 32.1
20-24 22.5 25.7 32.7 27.6 6.1 21.9 22.5 12.4 22.6
25-29 11.4 20.9 26.5 22.5 2.3 19.0 20.9 10.8 11.3
30-34 14.7 17.5 23.7 16.8 3.2 13.9 19.2 7.7 14.9
35-39 16.5 8.0 25.8 16.4 2.6 10.2 14.1 5.6 14.8
40-44 13.0 18.8 19.1 7.8 1.4 6.9 7.6 7.7 6.5
45-49 16.3 4.2 15.6 13.3 2.2 2.7 12.7 1.5 11.8
50-54
55-59
60-64
65-69
70-74
1.2 Total rate by severity
acquired injuries
(consequences) 38.5
22
moderate (by type) 5.3 11.8 7.4 3.8 5.6 1.6 6.4 8.0 2.8 5.1 1.9 2.8
23
severe (by type) 10.6 4.0 9.6 21.0 12.3 1.6 8.3 10.7 5.1 8.3 1.8 0.7
1.3 Total rate by relationship
24
to the perpetrator(s)
intimate partner (current or
former) 5.7 15.9 13.2 6,6 16.9 24.8 17.9 3.2 14.8 18.7 7.9 13.4 10.0 3.4 4.2 26.5
other than intimate partner: 2.9
family member 2.4 1.9 1.7
friends, neighbours 7.0
work or school 1.6
professional caregivers or
helpers
casual acquaintances
unknown person (stranger) 6.5
1.4 Total rate by frequency
once
few (2-10)
many (>10)
22
simple assault
23
aggravated assault
24
average annual rate per 1,000 persons (female) age 12 or older, by perpetrator
21
18. Table 2. Total and age-specific rate of women subjected to physical violence during lifetime by severity of violence, relationship to the perpetrator(s) and frequency
Dominican R.
Cambodia (1)
Cambodia (2)
Australia (1)
Australia (2)
Bangladesh
Bangladesh
Ethiopia pr.
El Salvador
Canada (1)
Canada (2)
Azerbaijan
Japan city
Brazil city
Colombia
#
Germany
Brazil pr.
Denmark
Armenia
Ecuador
Albania
Finland
Kiribati
Bolivia
France
Ireland
Egypt
India
Haiti
Italy
city
pr.
21.0
25
2.1 Total rate 8.2 13.3 48.0 23.4 41.0 23.9 35.0 43.5 37.0 35.2 18.8
26 27
2.1.1 Age-specific rate
15-19 8.6 44.9 25.7 24.1 27.0 22.8 3.6
20-24 10.8 40.0 34.0 21.5 36.0 42.0 19.0 10.4
25-29 14.9 47.0 48.6 28.3 30.5 49.5 12.2
30-34 39.6 45.6 26.8 31.5 56.9 23.9 13.8
35-39 15.1 34.3 44.8 28.6 40.7 50.0 16.5
40-44 32.3 39.3 24.3 37.7 49.7 21.4 11.8
45-49 15.4 25.6 43.1 36.0 29.6 44.1 11.9
50-54 19.1
55-59
60-64 14.0
65-69 9.6
28 29 30 f
2.2 Total rate by severity
acquired injuries 41.4 38.0 54.1 50.0 19.0 37.0 79.1 60.7 18.9 8.0 52.0
moderate 27.0 21.0 22.3 37.3 11.7 13.7 15.9 51.0 39.7 17.8 13.3 16.6 9.2 14.4
29.7
31
severe 12.0 18.7 19.4 14.9 15.5 20.0 3.9 49.0 10.4 6.1 35.4 4.2 1.4 3.8 45.6
2.3 Total rate by relationship to
the perpetrator(s)
83.9 50.7
intimate partner (current or former) 32 33
31.0 39.7 41.7 52.3 27.2 33.8 22.5 16.4 7,0 34 44.1 22.3 34.4 24.0 48.7 31.0 22.8 28.8 18.9 12.0 12.9 60.0
i i
Intimate partner – current 50.2 6.9 17.0
i i
Intimate partner - former 18.5 44.1 44.7
other than intimate partner: 27.0 17.4 10.7 20.9 13.0 4.9 12.0 0.5 9.8 4.7 11.0
family member 84.2 71.3 75.5 75.0 72.5 0.3 1.7 68.8
h i
family member male 2.5 32.6 19.1
i
family member female 38.4 26.3
86.0
father/stepfather 10.6i 35
29.4
i
mother/stepmother 23.8
i
sister/brother 9.2 0.5
h i
daughter/son 1.1 0.1
friends, neighbours 0.3 0.1 1.6
i
work or school 0.3 0.0 0.2 0.8 9.8
professional caregivers or helpers 0.0
casual acquaintances 17.9 29.9 20.0 8.3 16.1 0.1 2.6 26.6
h
boyfriend 4.4
i
unknown person (stranger) 14.9 13.0 0.4 0.0 8.6 6.3 0.1 2.0 0.2 3.6 18.8 13.4
h i 36
mother in law 19 1.6 1.0
h i
father in law 7.0 0.0
11.5
others 0.5 i 37
1.1 7.9 7.8 14.6 14.1 0.3 0.0
yes yes
38 39 40
2.4 Total rate by frequency
25
Sample includes only ever-married women
26
age intervals are in a five-year groups, except 30-39 and 40-49 age groups
27
age-intervals are given as following: 16-24, 25-34, 35-44, 45-54, 55-64, and 65-69 (Italy)
28
indicators of different types of each violent acts are available, but they are not presented as moderate or severe, and therefore, not typed into the matrix.
29
severity of violent acts among all women who experienced violence, summed up 100%
30
injuries in the most severe violent situation, the question were “Did your partner’s violence caused injuries to you?”
31
severity of violence is assessed by perpetrators (their perceptions), but also by acts of violence and by perpetrators, whereas total rate is not given
32
among women who experienced moderate physical abuse (rate is also available among women who experienced severe physical abuse)
33
among women who experienced physical violence as of age of 15
34
rate is given for the last five years, not a lifetime
35
Both mother and father (parents)
36
Both mother and father in law (parents in law)
37
category ”others” comprise the following: acquaintance or neighbour, counsellor or psychologist or psychiatrist, ex-boyfriend or girlfriend, doctor, teacher, minister or priest or clergy, prison officer and other known person.
22
19. once
few (2-10) 54.6
many (>10) 43.8
#
Confidentiality of study is compromised since 16% of the interviews were conducted in a presence of someone else than woman
38
frequency is available but just when segregated by each violent act in the group of moderate/severe abuse
39
frequency (sometimes/often) is available but just when segregated by age-groups
40
among all women experienced non-IPV
23