More Related Content
Similar to Credible fear statistics family facilities.
Similar to Credible fear statistics family facilities. (8)
More from Bryan Johnson (20)
Credible fear statistics family facilities.
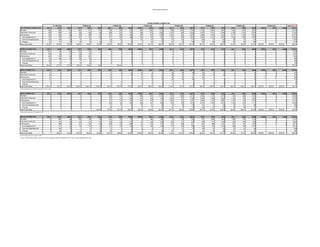
- 1. USCIS Asylum Division
July-March
All 4 Facilities Credible Fear JULY AUG SEPT OCT NOV DEC JAN FEB MAR APRIL MAY JUNE JULY AUG SEPT OCT NOV DEC JAN FEB MAR APRIL MAY JUNE TOTAL
Receipts 558 538 213 380 313 170 572 246 503 381 1,206 1,373 396 1,693 2,783 3,126 2,881 4,594 1,430 1,616 2,907 0 0 0 27,879
Interviews Conducted 528 566 187 335 382 162 562 257 472 358 612 1,082 1,310 940 2,818 3,542 2,531 4,384 2,129 1,535 2,633 0 0 0 27,325
All Decisions 454 595 198 353 398 151 577 258 460 359 610 1,065 1,332 931 2,827 3,509 2,434 4,323 2,117 1,528 2,594 0 0 0 27,073
Fear Established (Y) 197 378 151 312 318 102 471 240 426 332 533 947 1,144 839 2,433 3,093 2,197 3,803 1,938 1,385 2,259 0 0 0 23,498
Fear Not Established (N) 233 166 24 12 25 27 34 10 17 20 53 42 91 60 211 229 78 194 80 54 175 0 0 0 1,835
Closings 24 51 23 29 55 22 72 8 17 7 24 76 97 32 183 187 159 326 99 89 160 0 0 0 1,740
Fear Found Rate 43.4% 63.5% 76.3% 88.4% 79.9% 67.5% 81.6% 93.0% 92.6% 92.5% 87.4% 88.9% 85.9% 90.1% 86.1% 88.1% 90.3% 88.0% 91.5% 90.6% 87.1% #DIV/0! #DIV/0! #DIV/0! 86.8%
Artesia Credible Fear JULY AUG SEPT OCT NOV DEC JAN FEB MAR APRIL MAY JUNE JULY AUG SEPT OCT NOV DEC JAN FEB MAR APRIL MAY JUNE TOTAL
Receipts 541 49 140 219 145 0 0 0 0 0 0 0 0 0 0 0 0 0 0 0 0 0 0 0 1,094
Interviews Conducted 508 80 118 189 197 2 0 0 0 0 0 0 0 0 0 0 0 0 0 0 0 0 0 0 1,094
All Decisions 433 133 130 195 201 2 0 2 0 0 0 0 0 0 0 0 0 0 0 0 0 0 0 0 1,096
Fear Established (Y) 176 106 103 169 142 0 0 2 0 0 0 0 0 0 0 0 0 0 0 0 0 0 0 0 698
Fear Not Established (N) 233 17 12 11 25 0 0 0 0 0 0 0 0 0 0 0 0 0 0 0 0 0 0 0 298
Closings 24 10 15 15 34 2 0 0 0 0 0 0 0 0 0 0 0 0 0 0 0 0 0 0 100
Fear Found Rate 40.6% 79.7% 79.2% 86.7% 70.6% 0.0% 100.0% 63.7%
Berks Credible Fear JULY AUG SEPT OCT NOV DEC JAN FEB MAR APRIL MAY JUNE JULY AUG SEPT OCT NOV DEC JAN FEB MAR APRIL MAY JUNE TOTAL
Receipts 17 6 4 6 6 8 11 9 13 16 9 11 49 26 95 96 18 11 7 6 12 436
Interviews Conducted 20 5 6 6 2 9 14 7 14 13 10 14 39 32 61 122 28 20 11 4 12 449
All Decisions 21 6 6 7 2 9 14 7 4 13 10 14 39 34 60 82 8 7 7 4 12 0 0 0 366
Fear Established (Y) 21 1 4 7 2 9 12 7 3 11 8 14 28 26 56 73 8 2 7 4 12 315
Fear Not Established (N) 0 4 2 0 0 0 2 0 0 2 0 0 11 1 4 3 0 5 0 0 0 34
Closings 0 1 0 0 0 0 0 0 1 0 2 0 0 7 0 6 0 0 0 0 0 17
Fear Found Rate 100.0% 16.7% 66.7% 100.0% 100.0% 100.0% 85.7% 100.0% 75.0% 84.6% 80.0% 100.0% 71.8% 76.5% 93.3% 89.0% 100.0% 28.6% 100.0% 100.0% 100.0% #DIV/0! #DIV/0! #DIV/0! 86.1%
Dilley Credible Fear JULY AUG SEPT OCT NOV DEC JAN FEB MAR APRIL MAY JUNE JULY AUG SEPT OCT NOV DEC JAN FEB MAR APRIL MAY JUNE TOTAL
Receipts 0 0 0 0 2 8 320 118 275 360 811 1,116 274 1,089 2,101 2,153 1,774 3,179 573 826 1,579 16,558
Interviews Conducted 0 0 0 0 2 8 315 115 248 333 403 783 1,043 531 2,138 2,485 1,586 2,905 1,199 742 1,363 16,199
All Decisions 0 0 0 0 0 10 315 115 247 331 403 777 1,052 531 2,166 2,480 1,557 2,886 1,193 743 1,334 0 0 0 16,140
Fear Established (Y) 0 0 0 0 0 10 248 99 228 306 341 688 944 478 1,818 2,210 1,406 2,547 1,102 673 1,171 14,269
Fear Not Established (N) 0 0 0 0 0 0 21 10 15 18 51 39 76 38 176 121 41 121 53 32 86 898
Closings 0 0 0 0 0 0 46 6 4 7 11 50 32 15 172 149 110 218 38 38 77 973
Fear Found Rate 100.0% 78.7% 86.1% 92.3% 92.4% 84.6% 88.5% 89.7% 90.0% 83.9% 89.1% 90.3% 88.3% 92.4% 90.6% 87.8% #DIV/0! #DIV/0! #DIV/0! 88.4%
Karnes Credible Fear JULY AUG SEPT OCT NOV DEC JAN FEB MAR APRIL MAY JUNE JULY AUG SEPT OCT NOV DEC JAN FEB MAR APRIL MAY JUNE TOTAL
Receipts 0 483 69 155 160 154 241 119 215 5 386 246 73 578 587 877 1089 1404 850 784 1316 9,791
Interviews Conducted 0 481 63 140 181 143 233 135 210 12 199 285 228 377 619 935 917 1459 919 789 1258 9,583
All Decisions 0 456 62 151 195 130 248 134 209 15 197 274 241 366 601 947 869 1,430 917 781 1,248 0 0 0 9,471
Fear Established (Y) 0 271 44 136 174 83 211 132 195 15 184 245 172 335 559 810 783 1,254 829 708 1,076 8,216
Fear Not Established (N) 0 145 10 1 0 27 11 0 2 0 2 3 4 21 31 105 37 68 27 22 89 605
Closings 0 40 8 14 21 20 26 2 12 0 11 26 65 10 11 32 49 108 61 51 83 650
Fear Found Rate 59.4% 71.0% 90.1% 89.2% 63.8% 85.1% 98.5% 93.3% 100.0% 93.4% 89.4% 71.4% 91.5% 93.0% 85.5% 90.1% 87.7% 90.4% 90.7% 86.2% #DIV/0! #DIV/0! #DIV/0! 86.7%
Source: USCIS Asylum Division, Asylum Pre-Screening System (APSS), APCQRF2F and 3F, Apr. 4, 2016. Updated May 16, 2016.
Artesia and Berks cases received or decided since July 1, 2014
Dilley cases received since December 19, 2014
Karnes cases received since August 1, 2014
Family Facilities Credible Fear
FY 2014 Q4 FY2015 Q1 FY2015 Q2 FY2015 Q3 FY2015 Q4 FY2016 Q1 FY2016 Q2 FY2016 Q3
- 2. USCIS Asylum Division
July-March
All 4 Facilities Reasonable
Fear JULY AUG SEPT OCT NOV DEC JAN FEB MAR APRIL MAY JUNE JULY AUG SEPT OCT NOV DEC JAN FEB MAR APRIL MAY JUNE TOTAL
Referrals 17 22 5 6 10 1 17 11 13 15 24 57 49 58 120 91 83 102 54 34 71 0 0 0 860
Interviews conducted 11 40 7 4 9 5 13 15 14 13 13 53 61 50 121 93 74 111 59 35 62 0 0 0 863
All decisions 12 23 9 9 9 4 14 15 14 13 14 49 65 49 117 92 73 103 63 35 60 0 0 0 856
Fear established (Y) 6 22 7 5 8 4 12 13 9 11 11 32 40 38 81 68 55 71 53 26 39 0 0 0 614
Fear not established (N) 3 9 5 4 1 0 2 1 3 2 2 14 20 11 34 24 18 32 10 9 21 0 0 0 225
Closings 0 1 2 0 0 0 0 1 2 0 1 3 5 0 2 0 0 0 0 0 0 0 0 0 17
Fear found rate 50.0% 95.7% 77.8% 55.6% 88.9% 100.0% 85.7% 86.7% 64.3% 84.6% 78.6% 65.3% 61.5% 77.6% 69.2% 73.9% 75.3% 68.9% 84.1% 74.3% 65.0% #DIV/0! #DIV/0! #DIV/0! 71.7%
Artesia Reasonable Fear JULY AUG SEPT OCT NOV DEC JAN FEB MAR APRIL MAY JUNE JULY AUG SEPT OCT NOV DEC JAN FEB MAR APRIL MAY JUNE TOTAL
Receipts 10 2 0 0 0 0 0 0 0 0 0 0 0 0 0 0 0 0 0 0 0 0 0 0 12
Interviews Conducted 2 9 1 0 0 0 0 0 0 0 0 0 0 0 0 0 0 0 0 0 0 0 0 0 12
All Decisions 1 10 1 0 0 0 0 0 0 0 0 0 0 0 0 0 0 0 0 0 0 0 0 0 12
Fear Established (Y) 0 5 0 0 0 0 0 0 0 0 0 0 0 0 0 0 0 0 0 0 0 0 0 0 5
Fear Not Established (N) 1 4 1 0 0 0 0 0 0 0 0 0 0 0 0 0 0 0 0 0 0 0 0 0 6
Closings 0 1 0 0 0 0 0 0 0 0 0 0 0 0 0 0 0 0 0 0 0 0 0 0 1
Fear Found Rate 0.0% 50.0% 0.0% 41.7%
Berks Reasonable Fear JULY AUG SEPT OCT NOV DEC JAN FEB MAR APRIL MAY JUNE JULY AUG SEPT OCT NOV DEC JAN FEB MAR APRIL MAY JUNE TOTAL
Receipts 7 2 1 0 0 0 2 0 0 3 0 3 2 10 16 13 1 0 0 0 0 60
Interviews Conducted 9 16 1 0 0 0 0 2 0 1 2 3 2 10 13 12 4 1 0 0 0 76
All Decisions 11 17 3 2 0 0 0 2 0 0 3 3 2 10 10 15 4 0 0 0 0 0 0 0 82
Fear Established (Y) 9 16 2 1 0 0 0 2 0 0 2 2 2 8 8 14 4 0 0 0 0 70
Fear Not Established (N) 2 1 1 1 0 0 0 0 0 0 1 1 0 2 2 1 0 0 0 0 0 12
Closings 0 0 0 0 0 0 0 0 0 0 0 0 0 0 0 0 0 0 0 0 0 0
Fear Found Rate 81.82% 94.12% 66.67% 50.00% 100.00% #DIV/0! 66.7% 66.7% 100.0% 80.0% 80.0% 93.3% 100.0% #DIV/0! #DIV/0! #DIV/0! #DIV/0! #DIV/0! #DIV/0! #DIV/0! 85.4%
Artesia and Berks cases received or decided since July 1, 2014
Dilley Reasonable Fear JULY AUG SEPT OCT NOV DEC JAN FEB MAR APRIL MAY JUNE JULY AUG SEPT OCT NOV DEC JAN FEB MAR APRIL MAY JUNE TOTAL
Receipts 0 0 0 0 0 0 5 7 8 12 12 45 44 25 80 49 53 68 32 20 43 503
Interviews Conducted 0 0 0 0 0 0 5 7 8 10 8 38 51 26 78 54 42 71 38 21 35 492
All Decisions 0 0 0 0 0 0 4 8 8 10 8 38 51 26 78 49 41 70 39 21 35 0 0 0 486
Fear Established (Y) 0 0 0 0 0 0 4 7 4 9 6 24 29 19 49 35 32 48 32 16 20 334
Fear Not Established (N) 0 0 0 0 0 0 0 1 3 1 1 12 19 7 27 14 9 22 7 5 15 143
Closings 0 0 0 0 0 0 0 0 1 0 1 2 3 0 2 0 0 0 0 0 0 9
Fear Found Rate 100.0% 87.5% 50.0% 90.0% 75.0% 63.2% 56.9% 73.1% 62.8% 71.4% 78.0% 68.6% 82.1% 76.2% 57.1% #DIV/0! #DIV/0! #DIV/0! 68.7%
Dilley cases received since December 19, 2014
Karnes Reasonable Fear JULY AUG SEPT OCT NOV DEC JAN FEB MAR APRIL MAY JUNE JULY AUG SEPT OCT NOV DEC JAN FEB MAR APRIL MAY JUNE TOTAL
Receipts 0 18 4 6 10 1 10 4 5 0 12 9 3 23 24 29 29 34 22 14 28 285
Interviews Conducted 0 15 5 4 9 5 8 6 6 2 3 12 8 14 30 27 28 39 21 14 27 283
All Decisions 0 5 10 7 9 4 10 5 6 3 3 8 12 13 29 28 28 33 24 14 25 0 0 0 276
Fear Established (Y) 0 1 5 4 8 4 8 4 5 2 3 6 9 11 24 19 19 23 21 10 19 205
Fear Not Established (N) 0 4 3 3 1 0 2 0 0 1 0 1 1 2 5 9 9 10 3 4 6 64
Closings 0 0 2 0 0 0 0 1 1 0 0 1 2 0 0 0 0 0 0 0 0 7
Fear Found Rate 20.0% 50.0% 57.1% 88.9% 100.0% 80.0% 80.0% 83.3% 66.7% 100.0% 75.0% 75.0% 84.6% 82.8% 67.9% 67.9% 69.7% 87.5% 71.4% 76.0% #DIV/0! #DIV/0! #DIV/0! 74.3%
Karnes cases received since August 1, 2014
Source: USCIS Asylum Division, Asylum Pre-Screening System (APSS), APCQRF2F and 3F, Apr. 4, 2016. Updated May 16, 2016.
FY2016 Q2 FY2016 Q3
Family Facilities Reasonable Fear
FY 2014 Q4 FY2015 Q1 FY2015 Q2 FY2015 Q3 FY 2015 Q4 FY2016 Q1