1. Retail sector
Spanish Stock Exchange
Date: 30/12/2015
Ticker: ITX SM (Bloomberg)
Current price: EUR 33,54 (27.10.2015) Recommendation: BUY (32,82% upside)
Target price EUR 44,55
Tabel1: Market profile
Closing price /Last price
@oct-27
33.54
52- weeks price range 20.79 - 34.01
Average daily volumn
trade
8,009,503
Shares outstanding 3113.2
Market Cap 104548.1
Divident yield 1.54%
P/E 29.04
P/B 10.56
EV/EBITA 28.3
ROE 25%
Table 2: DCF Method
Taget Price € 44,55
Current Price @ 27-10-15 € 33,54
Upside gain 32,82%
Highlights: Defensive stock with aggressive growth
potential
We issue a buy recommendation on Inditex with a one year target price of EUR 44.55,
there is 32,82% upside gains. Inditex is one of the biggest, most liquid, and least leverage in
the apparel industry with a 2014 revenue value of 18.116,53 million EUR and forecast value
2019 26.117,90 million EUR It is a dividend paying firm, with 1.54%% dividend yield2015
. The
company’s international expansion contributes the annual growth in EPS.
Inditex has a refined and efficient business model to support its rapid growth. The
company’s refined and fast supply chain enables the company to operate more efficiently
by avoiding large inventory as are common in the retail sector. H&M average inventory days
112 while Inditex’s 82. Its design process provides the company flexibility to create products
matched the needs of the customers. The company’s multi-products strategy provides the
competitive advantage to reach all market segments, hence, has enabled the company to
expand rapidly in the last decade. Additionally, the company’s no branding strategy enables
the company minimize the company’s operating expenditure.
Sounded financial position: Stable profitability, low leverage, high liquidity and negative
cash conversion cycle. We expect Inditex will maintain its highly stable profitability,
regardless of its aggressive foreign expansion, especially, with the non-Zara brands. Due to
its efficient and unbeatable supply chain management, and efficient asset managements,
Inditex can growth without having liquidity risk for decades, and we expected it to remain
so.
Growth drivers: High revenue growth for the last decade is supported by international
expansions, especially in the emerging markets, where Inditex is ahead of its competitors,
H&M, to establish itself in these markets. Inditex has a wider and broader global foot print
than all the fast retail fashion companies.
64%7%
8%
9%
6%
2%
3%
1%
Figure 1: Revenue brands distribution
2014
Zara Pull and bear Massimo Dutti
Bershka Stradivarius Oysho
0
100
200
300
400
500
600
700
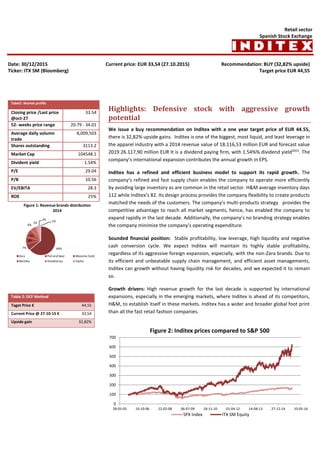
28-05-05 10-10-06 22-02-08 06-07-09 18-11-10 01-04-12 14-08-13 27-12-14 10-05-16
Figure 2: Inditex prices compared to S&P 500
SPX Index ITX SM Equity
2. Table 3: Breakdown of brand´s market deographic
Brands Demographic
Zara Women age 18 - 40, men, children,
sport wears
Pull & Bear Younger demographic
Massimo Dutti Working professional, men & women
Bershka Women, younger demographic
Stradivarius Women; younger demographic,
higher price
Oysho Women's under garments and lounge
wear
Zara Home Families
Uterque Professional women
Lefties Outlet store of Inditex that sells last-
season stock from Zara
Source:Company annual report 2014
Source: Company annual report 2014
Source: Company annual report 2014
Source: Passport 2015
Business Description
Inditex is a Spanish multinational company that was established in 1963 by Amanico
Ortega. Inditex opened its first store, Zara, in 1975 and started its foreign expansion in
1988. Within 30 years, the company has opened over 6600 bricks-mortar stores in 88
countries and online stores in 27 countries. 88% of the stores are corporate owned. In
2010, Inditex surpassed GAP inc. and became the #1 largest fashion retailers by sales. In
2014, it owns 1.2% of market shares in the apparel industry.
Multi portfolio. Inditex owns eight brands: Zara, Pull&Bear, Massimo Dutti, Bershka,
Stradivarius, Oysho, Zara Home, Uterqüe and Lefties. Zara is the company’s the biggest
subsidiary; constitutes 61% of company’s revenue in 2014. Its product lines include daily
wears, evening gowns, and formal and professional wears. Non-Zara brands offer products
ranging from as small as one’s under garments and as large as one’s king size bed. This
strategy enables Inditex to target various demographics.
Geographical Units. Inditex’s core historical market is Western Europe, Inditex’s
dependence on this market has reduced. The sales from Western Europe accounts for 52%
of its sales in 2014 which is reduced from 72% in 2008. Asia Pacific has increased its
importance over the last decade, but most of the sales are generated from Zara. Inditex’s
market shares in Inditex has been stagnated, with only 1% over the decade. The newest
continent Inditex has set foot in is Australasia in 2010, by 2014, it has 1% of its market
share.
Strategy. The company`s main strategy is to maintain quality in fashion, increase operating
performance and expand market shares efficiently. Inditex`s operations are designed to
generate growth and increase value through:
Network growth central to strategy. Besides adding new stores to its network, the
company also committed to refurnish, relocate and enlarge the strategically important
flagship stores.
Brand clarity. The multi-portfolio brand strategy allows Inditex to reach the target
audience in the most effective way. On the other hand it could lead to a
cannibalization at the same time. The company tries to reduce this effect and identify
brand potential to adjust its position in individual markets.
Boosting online sales. In spite of physical store development is central to Inditex`s
distribution and brand strategy, it started to put a bigger focus on online selling. One
of the main achievement is to open an official store on China`s Tmall. As a large
numbers of local consumers remain unable to access physical stores, the digital market
is getting more attractive for Inditex.
Coping with price pressure. As an international brand producer, Inditex has to cope
with two main problems that are connected to the aggressive price discounting in its
core Western European markets and rising operational costs. The company has
responded with the low-key development of its Lefties brand, and it tries to hold the
sales for core brands at the same time.
Competitive advantage.
Multi-brand strategy maximizes flexibility. The independently managed and controlled
brands and diverse product offerings allow Inditex to maximize its customer base and
enhance growth both domestically and internationally.
Superlative design, supply chain and speed lies at the heart of Inditex`s success story. The
company is well-known for producing ‘in-demand’ items at high speed and in small scale.
This enables the company to react fast to market changes, save on inventory costs and
encourage customers to visit stores more often. (Footnote: 30,000 products per season)
make the table of the lead time) The innovative business model focuses on the
comprehensive collection of store-based consumer data, control of the design and
manufacturing, which means it has the greatest level of sensitivity to changing consumer
demand with the help of direct feedback and speed reaction.
Aggressive expansion with no branding costs. Another eminent practice of Inditex is that
the company has an insignificant budget for advertisement. Its prime promotional tool is
having flagship and well-designed stores which are located in chic and trendy areas.
0
1000
2000
3000
4000
5000
6000
7000
no. stores Figure 3: no of stores by brands
Uterque Zara home Oysho
Stradivarius Bershka Massimo Dutti
Pull and bear Zara
0
2000
4000
6000
8000
10000
12000
14000
16000
18000
2008 2014
€ mn
Figure 4: sales breakdown in each region
Western Europe North America
Middle East and Africa Latin America
Eastern Europe Australasia
Asia Pacific
10%
4%
27%
40%
3% 16%
Figure 5: Category segments
Childrenswear
Apparel
Accessories
Menswear
Womenswear
Hosiery
Sportwear
3. 1 According to ‘Passport’ database
Source: passport database
Industry overview and competitive position
Apparel and footwear market is a multi-trillion Euro market with value of EUR 1,313,7
billion in 2014. In 2019, the industry is forecasted to have a value of EUR 1,748,5 billion, an
increase of 33% with a CAGR 14-19 of 5,88%. 1
The largest category segment is womenswear,
with EUR 497,7 billion, all segments have approximately the same CAGR 09-14, 4%-5%.
Industry by geography segments
Asia Pacific, Western Europe and North Americas account for 79% of the global industry. In
2014, the highest consumption of apparel was in the Asia Pacific, which accounts for 34%
of the global apparel industry value, 55% of that is accounted by China. In the past five
years, China’s consumption on apparel and footwear has grown tremendously. It has
surpassed USA and has become the number one market; with retail value of EUR 243,7
billion, however, the growth in sales in China has slowed down with a CAGR 14-19 of 7,8%. The
next Asian’s raising tiger is India, with a CAGR 14-19 of 13%.
Western Europe is the second biggest market, it accounts for 24% of the global apparel,
however, the industry grow has been stagnated in this market, with the lowest CAGR14-19 ,
1,7%, due to a decreasing in population. The North American market exhibits a higher
growth than Europe, with CAGR 14-19, 3, 09%, remained the third largest in the World.
Middle East & Africa and Latin American forecasted to have the largest growth in the
world, with CAGR14-19 of 11% and 13.35 % respectively. The reason is the increasing in GDP
in these countries, especially, the emerging countries: Brazil, Kenya and South Africa.
Porters five forces model was used to analyse the apparel and footwear industry deeper.
Figure 8 shows results of that analysis and in Appendix C describes the results in more
detail.
Competitive Positioning
Fast market penetration increases future potential grow. Inditex has a stronger position
than H&M, it’s biggest competitor, in all the regions with the exception of Western Europe.
(see figure 11) Inditex’s multi-products strategy provides the company opportunities to
expand aggressively in both mature and new markets. Inditex’s CAGR14-19 growth in Asia is
22,56% and in Western Europe is 2,2%, which is greater than the world’s growth rate. In
the past five years, Inditex has tripled its stores, mostly Zara, in the Asia and Middle east
and Africa regions, with CAGR 08-13 of 26%. Inditex is also expanding in the Americas and
Europe, but with a lesser extent, with 10% and 6% respectively. Inditex uses its
international recognized brand, Zara, to build foundation for the other to penetrate,
therefore, we expect Inditex’s growth will continue in the upcoming years. (See chart
breakdown no. store)
Large & Unsaturated markets. China, UK and USA are one of the biggest markets in the
Apparel industry. Inditex has about 1% market shares in these countries, there are
potential for Inditex to increase market shares in these region, with its increasing growth of
its online stores, Inditex can reach to more potential customer than its rival H&M.
(footnote: Inditex online stores are currently in 27 markets, while, H&M is in 21 markets.)
34%
24%
21%
9%
5%
6% 1%
Figure 6 Global retail industry geography
segment 2014 Asia Pacific
Western
Europe
North
America
Latin America
Middle East
and Africa
Eastern
Europe
Australasia
7.39%
1.70%
3.09%
13.35%
10.98%
5.13%
2.90%
0.00%
2.00%
4.00%
6.00%
8.00%
10.00%
12.00%
14.00%
16.00%
0
100000
200000
300000
400000
500000
600000
700000
Asia Pacific Western
Europe
North
America
Latin America Middle East
and Africa
Eastern
Europe
Australasia
EUR Mn
Figure 7: World: sales in each region
2014 diff (14-19E) CAGR
55%
9%2%
14%
1%
2%
1% 5%
2% 1% 1%
7%
Figure 8: Sales value in Asia 2014
China
India
Indonesia
Japan
Malaysia
Philippines
Singapore
South Korea
Taiwan
Thailand
Vietnam
Others
0.00%
5.00%
10.00%
15.00%
20.00%
25.00%
0.00%
0.50%
1.00%
1.50%
2.00%
2.50%
3.00%
3.50%
4.00%
LineBar Figure 10: Markets share & CAGR
Inditex market share
H&M market share
World CAGR (2014-2019)
Inditex CAGR (2014-2019)
1
2
3
4
5
Bargaining of the
Customers
Bargaining of the
Suppliers
Threat of New
Entrants
Competitive rivalry
within Industry
Threat of
Substitutes
Figure 9: Five Forces
Model
4. Financial Analysis
Table 4: Financial ratios of Inditex from 2013 -2019E
Success is shown in increasing company’s earnings. In the past years, the EPS has been
increasing steadily, with historical CAGR06-14 11% and forecasted CAGR15-19 6,55%. The
increasing in earning is contributed by successful expansions in new markets by physical
and online stores. The profitability has been stable in the last decade which is exhibited by
gross margin, net profit margin and ROIC. We expect these margins to remain stable for
the upcoming years, as can be seen in figure 12
Stable ROIC: intensive investment is offset by increasing revenue. (Figure 13) Compared
to most competitors, Inditex’s ROIC is low, however it is more stable. Low ROIC is due to
higher ratio of capitalized leases, which capitalized leases are 81% of its invested capital.
The higher capitalize leases are can be explained by two main factors: Inditex has twice as
many stores as H&M and the other factor is that Inditex’s stores are located in high scale
area with high rental expenses, which are used as a promotional tool. The invested capital
in the past few years exhibits an increasing trend, this is due to the international expansion
through opening new stores and increasing the store spaces in the existed stores. Even
though the company is invest aggressively, the ROIC remains stable, this lead us to believe
the rate of return is as large as the rate of capital expenditure as we have forecasted.
Adept at generate cash, long trend of negative cash conversion cycle. Inditex’s highly
efficient supply chain management or strategy, high product turnover rates, and minimal
inventory storage and the cash or cash equivalent payment practice enable the company
to negative working capital turnover and negative cash conversion cycle. In the future,
with its RIFC program (explain in appendix), we expect even greater improvement in its
efficieny.
Secure investment with high liquidity and low leverage. Even though Inditex has
expanded its operation in the last decade, the debt/equity has a decreasing trend;
hence, the expansion is mainly financed by company’s internal generated funds. The
financial statements shows Inditex has low leverage, which supported by debt/equity
(0,04% ) and interest coverage ratio (378x ). This leads to very low market risk in interest
rates. Inditex’s high liquity and low leverage makes them highly unlikely to have financial
distress in the coming years. Low leverage ratio which decreases drastically historically, but
stable in estimated forecast.
Optimistic outlook for Inditex in revenue growth. The current aggressive expansion
especially in the emerging markets with Zara will contribute a signification return to
Inditex, and broaden the opportunity for the non-Zara brands to enter. We forecasted
Inditex’s annual revenue growth rate is CAGR 5,85% which is higher than the industry’s
growth rate for 2014.
-0.05
0
0.05
0.1
0.15
0.2
0
0.2
0.4
0.6
0.8
1
1.2
1.4
2011 2012 2013 2014 2015 2016 2017 2018 2019
%Euro Figure 11: EPS and y-o-y growth
EPS y-o-y growth
0.00%
20.00%
40.00%
60.00%
80.00%
2006 2011 2016
Figure 12: Profitability margins
EBITA margin NOPLAT margin
ROIC without GW and AI ROIC with GW and AI
Gross Profit Margin
0%
20%
40%
60%
80%
100%
2006 2007 2008 2009 2010 2011 2012 2013 2014
Figure 13: Historic ROIC of Inditex and
peers
ANF Bjorn Borg
GAP H&M
KappAhl Inditex
-
1,000.00
2,000.00
3,000.00
4,000.00
-
10,000.00
20,000.00
30,000.00
40,000.00
50,000.00
2011 2012 2013 2014 2015 2016 2017 2018 2019 2020
EUR (noplat)EUR
Figure 14: RO & IC
Noplat Invested Capital
0.00%
5.00%
10.00%
15.00%
20.00%
2007 2012 2017 2022 2027 2032
Figure 15: Inditex´s Revenue and Market
growth
Inditex's Revenue growth Market growth
Profitability 2013 2014 2015E 2016E 2017E 2018E 2019E
EBITA margin 21,28% 20,67% 20,10% 20,64% 20,53% 20,55% 20,56%
NOPLAT margin 15,28% 14,92% 13,95% 14,33% 14,25% 14,26% 14,27%
ROIC without GW and AI 10,18% 9,72% 9,09% 9,34% 9,29% 9,30% 9,30%
ROIC with GW and AI 9,85% 9,42% 8,83% 9,09% 9,06% 9,08% 9,10%
Gross Profit Margin 59,33% 58,34% 58,34% 58,34% 58,34% 58,34% 58,34%
ROA 48,88% 48,26% 49,18% 48,94% 48,68% 48,46% 48,21%
ROE 180,25% 173,06% 170,71% 167,91% 164,90% 162,49% 159,77%
Growth rates 2013 2014 2015 2016 2017 2018 2019
Revenue growth rate 4,88% 8,32% 8,48% 7,47% 7,11% 7,57% 7,32%
Sale squaremeters 7,85% 3,32% 7,15% 5,53% 4,82% 5,28% 4,71%
Efficiency 2013 2014 2015 2016 2017 2018 2019
Receivables outstanding 6,61 6,72 6,96 6,99 7,00 6,98 6,99
Inventory days outstanding 87,42 85,51 86,41 86,80 86,94 86,76 86,86
Accounts Payabledays outstanding 123,73 117,38 115,40 115,92 116,11 115,87 116,00
Cash Conversio Cyrcle ( 29,70) ( 25,15) ( 22,04) ( 22,14) ( 22,17) ( 22,13) ( 22,15)
Liquitity 2013 2014 2015 2016 2017 2018 2019
Working Capital ( 481,10) ( 388,98) ( 433,11) ( 470,49) ( 502,83) ( 541,17) ( 580,85)
The quick Ratio 1,47 1,40 1,20 1,22 1,23 1,23 1,23
Cash ratio 1,11 1,01 0,81 0,84 0,85 0,86 0,86
Leverage 2013 2014 2015 2016 2017 2018 2019
Total debt over EBITA 0,19% 0,12% 0,12% 0,11% 0,10% 0,09% 0,09%
Leverage ratio: D/(D+E) 0,07% 0,04% 0,04% 0,04% 0,03% 0,03% 0,03%
Coverage 2013 2014 2015 2016 2017 2018 2019
Times interest earned 320,62 378,24 13 767,45 15 194,51 16 185,40 17 432,65 18 713,67
Operating cash flow/total debt 219,14 375,53 420,12 505,63 567,50 578,20 638,85
Shareholders ratios 2013 2014 2015 2016 2017 2018 2019
Dividend payout ratio 57,97% 60,39% 60,39% 60,39% 60,39% 60,39% 60,39%
EPS 0,87 0,94 0,96 1,07 1,13 1,23 1,32
Historic Forecasted
5. 2 Asian Pacific, Australasia, Easter Europe, Latin America, Middle East and Africa, North America and Western Europe
3 Which was found in ´Passport’ database
Table 6: Target Price by DCF
Intrinsic Value (Eur Mn) 138.679,2844
Outstanding shares (Mn) 3.114.402
Price per share € 44,54
Current Price @ 27-10-15 € 33,54
Upside gain 32,82%
.
Valuation
DCF Model
When using the DCF model, we discounted the company’s future cashflow to estimate the
intrinsic value. The future cashflow, which was driven mostly by the expected growth in
revenue, was analyzed using two tiers: first, we made an explicit forecast which composes
of 5 year detailed forecast followed by 15 years explicit forecast to 2034 and second, we
estimate the company’s continue value.
Revenue growth forecast
The 5-year detailed revenue growth was derived from the trends of Inditex’s revenue
growth over the last few years in each region2
which is mostly due to the company’s
expansions in those regions, especially in new markets penetrations. Although Inditex has
already expanded far, we still see potential for more expansion, because some of its brands
have not entered in these markets. We use expected growth in sale per squaremeter as a
proxy for expansion. In addition, but to a lesser extend, we assume that Inditex’s revenue
will follow the market growth of the industry in each region.3
The 15-year explicit revenue
growth was estimated by assuming Inditex will reduce its expansion and growth rate will
decrease until 2034, when it converges to the market growth rate, 4,71%. From that year
onward, the continuing value is assumed to have a constant growth rate.
WACC
Since Inditex’s capital structure is mainly equtiy, cost of capital weighs approximately 98%
of the WACC. Cost of capital is estimated with the CAPM model, where the input factors
are listed in table 5. Cost of debt is estimated from Inditex credit rating, which is between
AAA and AA.
Sensitivity
Figure 15 shows how sensitive is the intrinsic value to the changes in various input factors.
The model shows that the intrinsic value is most sensitive to a decrease in the WACC, 1%
decrease in WACC results in a 8% increase in value. The second most sensitive factor is
COGS, 1% increase decreases value by 4,25%. However, a decrease in COGS has greater
and positive impact on the value, with 4,57% . The third factor is company’s expansion
rate, 1% more expansion would lead to 1,4% higher value.
Target Price
Estimating Inditex value through the DCF approach and thereby taking into consideration
their intrinsic value the fair price for Inditex is Eur 33.54, the current price is Eur 44,54, with
a potential absolute upside gain of 32,82%% by 2016.
High market perception on Inditex: EV/EBITA & P/E
Beside having a solid financials, the market sentiment on Inditex is greatest than the peers
in the industry. As shown in figure 16, Inditex’s EV/EVIDA and P/E is greater than its main
rival H&M. As supported by the target price, with upside gain of 32,82%, we strongly
believe that the stock price is not overvalued.
12,360.70
126,318.59
0
20000
40000
60000
80000
100000
120000
140000
160000
Company total value
Eur Mn Figure 16: Distribution of present value
Continue Value € mn Explicit value € mn
Risk free rate 2,50%
Beta 0,7302
Market risk premium 5,02%
Cost of equity 6,17%
Cost of debt 3,49%
Marginal tax rate 25%
Cost of debt, post tax 2,61%
Weight of equity 99,98%
Weight of debt 0,02%
WACC 6,16%
WACC Computation
-5.00% 0.00% 5.00% 10.00%
WACC
Depreciation
Tax rate
Capitalized lease
World growth rate
Market share growth
COGS
Operating expenses
Figure 17: Tornado analysis
1% increase 1% decrease
0
5
10
15
20
25
30
35
Inditex H&M GAP KappAhl ANF
Figure 18: Peers Multiples 2015
P/E
EV/EVITA
6. .Table 7: Mitigation facotrs
Risks Mitigation Factors
Market Risk
Fluctuation of
exchange rates
Group management arranges
derivatives, mainly forward contracts, to
hedge cash flow fluctuations related
with exchange rates.
Increase of low
price brands
Applying multi-portfolio brand strategy,
maintining speed reaction, managing
selling Lefties
Economic Risk
Saturated
European
market with an
increasing
competition
Increasing power on other markets, put
more focus on the customers, increasing
online sales.
Slowdown of
growth in the
Asian market
Worldwide operation and increase in
stores, focus on all continents.
Operational Risk
Organic cotton
price
assumptions
Financial hedging and use pricing power.
Maintaining the
well-organised
supply chain
Central and smaller distributional
centres, take care of customers, build in
reactions and opinions.
Regulatory Risk
Different laws
and regulations
Legal, Tax, Industrial Property and
Human Resources department and The
Internal Audit deparment, provision
Other Risk
Managerial
changes and
reputation
Manage the operation of Social Audit
Program and Division of Communication
and Institutional Relations.
Investment risk
Market Risk 1 (MR1): Fluctuation of exchange rates
Due to Inditex’s worldwide operation, a big proportion of the income and costs are related
to foreign currency transactions, particularly, the US dollar, Mexican peso, Russian ruble,
Chinese renminbi and Japanese yen. The risk of exchange rates fluctuation is not
significant in the past decade since Inditex hedges against these risks with derivatives. This
risk might increase due to an increase of international operation in its portfolio.
Market Risk 2 (MR2): Increase of low price brands
The rise in cheaper brands, such as Primark, increases Inditex’s competition; hence,
reducing Inditex’s revenue and market shares. (Such as in UK, Netherlands)
Economic Risk 1 (ER1): Saturated European market with an increasing competition
In the past decades increasing competition has led to saturated European market for
Inditex (See Graphs in Industry Overview part). The increasing competition could lead to
decrease in the product prices, with accompanying decrease in revenue.
Economic Risk 2 (ER2): Slowdown of growth in the Asian market
The predicted revenue growth in Asian markets is still positive, because customers are
open for new products and brands. On the other hand, the growth in these markets might
not be as lucrative as predicted, due to an increase in competitions. (footnote: H&M is
tapping in the Asian market.)
Operational Risk 1 (OR1): Organic cotton price assumptions - fluctuation of COGS
Cost of merchandise weighs approximately 42-44% of Inditex’s revenue each year. As seen
in sensitivity analysis, Inditex’s value is quite sensitive to changes in cost of goods sold. The
largest part of cost of goods sold is raw material, mainly organic cotton. COGS is therefore
heavily depended on cotton prices.
Operational Risk 2 (OR2): Maintaining the well-organised supply chain
Inditex’s success is connected to the high speed operation, short delivery time and high
quality products. With it’s aggressive international expansion and its centrally located
logistic centers, there is a risk that this competitive advantage cannot be maintained.
Regulatory Risk 1 (RR1): Increase in minimum wage
The main suppliers are located in Spain, Portugal, Turkey, Bangladesh, India and China.
Increase in minimum wage in these regions could increase operating expense of Inditex,
which, as mentioned before, is one of the most sensitive factors that affects Inditex’s value.
Regulatory Risk 2 (RR2): Different laws and regulations
Through worldwide operation Inditex copes with regulatory risks through different laws
and regulations, such as tax, trade, consumption, industrial and intellectual property. The
most sensitive risk factor is connected to taxes.
Other Risks (OTR): Managerial changes and reputation
Inditex’s founder and chariman, Amancio Ortega, has good reputation as one of the world's
most successful and respected fashion retail moguls. Moreover the company has a good
image and strong brand, so it has to take care of its reputation more rigorous. Ortega’s
resignment or other type of bad new or scandal that hurt the brand image might decrease
stock prices and value of Inditex.
Figure 19: Risk Matrix
PROBABILITY
LOWMEDIUMHIGH
ER2 MR1
RR1 RR2 ER2 OR1
OR2 MR2 OTR
LOW MEDIUM HIGH
IMPACT
7. Analyst Team
This report is the final assignment in the course Corporate Valuation, at the School of Business, Economics and Law in Gothenburg,
Sweden. The final report summaries work that was done in four parts, constructed in the period 1.09.2015- 1.11.2015.
Analyst Team:
Berglind Halldórsdóttir
Weili Zhang
Zsáfia Molnár
Mentor:
Einar Bakke
8. Appendix A: Regional Analysis
55%
9%
2%
14%
1%
2%
1%
5%
2%
1%
1%
7%
Sales value in Asia 2014
China
India
Indonesia
Japan
Malaysia
Philippines
Singapore
0
0.02
0.04
0.06
0.08
0.1
0.12
0.14
0.16
%
Asia CAGR
CAGR
9. Appendix B : Regional analysis Inditex
0
0.5
1
1.5
2
2.5
3
3.5
4
Asia Pacific Western Europe North America Latin America Middle East and
Africa
Eastern Europe Australasia
%
Market shares in regions
Inditex H&M
-0.2
0
0.2
0.4
0.6
0.8
1
1.2
2006 2007 2008 2009 2010 2011 2012
Number of stores in Asia
Zara
Pull and bear
Massimo Dutti
Bershka
Stradivarius
Oysho
Zara home
Uterque
0
0.5
1
1.5
2
2.5
3
3.5
4
2006 2007 2008 2009 2010 2011 2012 2013
Sales per store in each region
Asia and rest of the world
Europé
Americas
In million EUR
10. 0
1
2
3
4
5
2006 2007 2008 2009 2010 2011 2012 2013
Market Share in these three regions
Asia and rest of the world
Europé
Americas
0
0.05
0.1
0.15
0.2
0.25
0.3
0.35
Growth in sales
Asia and rest of the world
Europé
Americas
In million EUR
11. 1
2
3
4
5
Bargaining of the
Customers
Bargaining of the
Suppliers
Threat of New
Entrants
Competitive rivalry
within Industry
Threat of Substitutes
Five Forces
Model
Appendix C : Porter`s Five Forces Analysis
Threat of New Entrants – HIGH: In apparel industry, the economies of scale are high, by buying the raw material in large bulk, and
producing the items in bulk reduces the average costs per product. The capital requirement is high, one needs to purchase
machineries, to purchase raw materials, create and produce a collection of products might take months; hence, startup losses could
be substantial. Product differentiation is an essence to establish the brand’s identity, and differentiate the products from other large
corporation such as H&M and Zara, the time and capital are needed to build awareness of the brand, and gain customer loyalty might
takes year, hence, it is costly. Therefore, if a firm has the financial capital available, to enter in this industry is not too difficult; in
conclusion, the threat of new entrance is high.
The threat of Substitutes – LOW: Although, technically there is no substitute for clothing, there are other alternatives to retail
clothing. The first is to purchase clothing directly from manufacturers through online sales. Nowadays, many prominent retailers have
their own online stores to accompany their conventional brick-mortar stores. Another option is buy tailor-made cloths or home-made
clothes, or buy counterfeit products. Purchase second-hand clothing from charity foundation or from internet is another option is also
harming also retailers’ sales. Overall, it can be concluded that the threat of substitution is low in this industry.
Power of Buyers – MODERATE: The buyers in the apparel are mostly individual consumers who purchase a particular wear that fits
their style or status, hence, weakened the buyer power. The retailers of apparels differentiate themselves greatly through the type of
clothes and price ranges they offer, which further weakened the buyer’s power. Even though brand consciousness in this industry is
vital, the brand loyalty of the customer does not dominating their decision making when conducting a purchase. There are other
cheaper counterfeit products or tailor-made clothing that can satisfied the customers which increases the customers’ bargaining
power by a little. Generally, the bargaining power of customers is assessed as low to moderate.
Power of Suppliers – LOW: The main suppliers in this industry are clothing manufacturers and wholesalers. This is a labour intensive
industry; the suppliers are aiming at developing economies. The liberalization of international trades enable retailers to manufacture
goods in low-wage regions, and since the switching costs between suppliers are not significant and the lack of diversity amongst the
suppliers, the retailers can select the ones that provide the most efficient with the least costs, this weakens the suppliers’ power. The
conclusion is the power of suppliers is also low.
Competitive Rivalry within Industry – MODERATE: The apparel and footwear industry is fragmented; it has room for a large number
of small and similar retailers. However, it is costly for these small retailers to open extra outlet. The retailers can also diversify their
collections, by selling other fashionable products such as jewels and other accessories. In the past few years, the growth in this
industry has been relatively slow, hence, not improving the rivalry. In sum, the rivalry of this industry is relatively moderate.
Future Outlook as a Whole - In order to remain a competitor in the retail industry long-term, a firm must use strategic positioning
and capitalize on competitive advantages. The use of well-developed supply chain system and multi-portfolio brand strategy will be
crucial to the short and long term performance of a company.
0 No threat to Inditex
1 Insignificant threat to Inditex
2 Low threat to Inditex
3 Moderate threat to Inditex
4 Significant threat to Inditex
5 High threat to Inditex
12. Appendix D: Capitalized leases
Flagships Rental /sq ft
London (Oxford Street
West) $1,550
Hong Kong (Causeway bay) $2,735
Madrid ( Golden Mile) $2,840
New York ( time square) $2,300
Paris (Champs-Elysees ) $1,556
Source: Fortune
16. Appendix H: Revenue forecast
5 year detailed forecast
Inditex has been expanding widely and heavily in the past decade, especially its main star brand, Zara. This expansion has
predominantly been in the emerging markets such as Mexico, China, and most recently, India. Inditex has also been
taking advantage of the increasing use of e-commerce worldwide. Inditex, in the last few, has opened 27 online
stores in its established markets. Even though Inditex has expanded far, there is room for more expansion since some of
Inditex’s smaller brands have not entered some of these market yet. Our forecast will therefore assume the company will
continue to expand organically; thus, market share in each market will increase, which consequently, contributes to
increase in revenue growth for the next 5 years. The expansion can be seen in increase in sale per square meters, which
will be used as a driver in our market share growth forecast. Note that in more mature markets as Western Europe and
North America, Inditex’s market share in this market is increasing at a decreasing rate. The forecasted expansion in
square meters is estimated by the last three years average growth rate. The reason, last three- year was chosen for the
estimation, is that a longer period gives more extreme results due to extreme cases, for example, when new brand,
Utique, which was launched in 2007, Inditex has opened 51 stores in that year.
A side from revenue growth due to an increase in market share, we assume that Inditex grows (decays) as the forecasted
growth in the apparel and footwear market grows (decays). For the first 5 years, we will estimate revenue growth in each
region to obtain more accurate estimations. Inditex’s aggregate revenue growth forecast was estimated using the
weighted average of the estimated growth in each region. The weights are estimated from each region’s 2014’s revenue.
To estimate the first 5 years revenue forecast for each region we increase/decrease former years forecast by the two
growth factors described above.
15 years forecast
The next 15 years will decay until it reaches the same estimated growth of the aggregated market. The market growth is
estimated as the average growth from 2006-2019E. The yearly estimated decay factor for Inditex’s revenue was found
with the help of “Solver”.
0.00%
0.50%
1.00%
1.50%
2.00%
2.50%
3.00%
2014 2015 2016 2017 2018 2019
Forecasted revenue growth per region
Asia Pacific - € mn Australasia - € mn
Eastern Europe - € mn Latin America - € mn
Middle East and Africa - € mn North America - € mn
Western Europe - € mn
17. Revenue forecast
2013 2014 2015 2016 2017 2018 2019
Sale in each region
Asia Pacific - € mn 2268.90 2515.70 2928.24 3311.20 3711.46 4181.00 4663.20
Growth 22.90% 10.88% 16.40% 13.08% 12.09% 12.65% 11.53%
Australasia - € mn 96.20 124.10 161.24 199.15 243.79 299.82 362.48
Growth 24.95% 22.48% 31.52% 41.70% 54.62% 72.00% 93.12%
Eastern Europe - €
mn
1522.10 1651.80 1808.77 1948.34 2083.81 2253.50 2420.59
Growth 13.38% 8.52% 9.50% 7.72% 6.95% 8.14% 7.41%
Latin America - €
mn
1719.80 1905.00 2065.45 2224.19 2371.21 2537.45 2704.14
Growth 15.36% 10.77% 8.42% 7.69% 6.61% 7.01% 6.57%
Middle East and
Africa - € mn
1176.40 1289.70 1508.93 1715.62 1935.36 2195.69 2467.81
Growth 14.54% 9.63% 17.00% 13.70% 12.81% 13.45% 12.39%
North America - €
mn
303.70 324.30 268.22 219.00 179.21 150.23 126.39
Growth 2.39% 6.78% 2.80% 3.20% 3.30% 3.10% 3.00%
Western Europe -
€ mn
8143.80 8335.30 8465.17 8589.09 8710.73 8836.79 8960.99
Growth 1.64% 2.35% 1.56% 1.46% 1.42% 1.45% 1.41%
sum 15230.90 16145.90 17206.02 18206.60 19235.56 20454.48 21705.59
Growth in market
Asia Pacific 7.30% 7.30% 7.50% 7.40% 7.40% 7.30% 7.30%
Australasia 1.20% 1.80% 2.50% 2.80% 2.90% 3.00% 3.20%
Eastern Europe 7.80% 5.60% -0.20% 3.60% 7.00% 7.40% 8.10%
Latin America 13.10% 10.00% 13.50% 13.60% 13.70% 13.10% 12.90%
Middle East and
Africa
7.60% 10.00% 10.50% 10.50% 11.00% 11.30% 11.60%
North America 2.30% 1.90% 2.80% 3.20% 3.30% 3.10% 3.00%
Western Europe -0.70% 0.00% 1.10% 1.60% 1.80% 1.90% 2.10%
World Growth 4.50% 4.50% 5.10% 5.70% 6.10% 6.20% 6.30%
,000 m^2
Asia Pacific 481.40 533.60
Growth 18.60% 10.84% 18.62% 14.50% 13.26% 13.99% 12.59%
Australasia 12.00 15.00
Growth 33.33% 25.00% 36.79% 28.69% 27.29% 27.98% 25.32%
Eastern Europe 461.90 472.70
Growth 14.73% 2.34% 11.93% 8.75% 6.94% 8.33% 7.24%
Latin America 257.60 264.50
Growth 10.75% 2.68% 7.15% 6.21% 4.84% 5.49% 4.99%
Middle East and
Africa
481.40 533.60
Growth 18.60% 10.84% 18.62% 14.50% 13.26% 13.99% 12.59%
North America -
Growth -24.42% -31.97% -22.32% -23.74% -23.53% -20.99% -20.59%
Western Europe 1663.10 1684.30
1.79% 1.27% 1.67% 1.43% 1.32% 1.33% 1.23%
Total Growth 7.85% 3.32% 7.15% 5.53% 4.82% 5.28% 4.71%
2015 2016 2017 2018 2019
Sale in each region 2014 Weight
Asia Pacific - € mn 2515.70 15.58% 2.56% 2.04% 1.88% 1.97% 1.80%
Australasia - € mn 124.10 0.77% 0.24% 0.32% 0.42% 0.55% 0.72%
Eastern Europe - €
mn
1651.80 10.23% 0.97% 0.79% 0.71% 0.83% 0.76%
Latin America - €
mn
1905.00 11.80% 0.99% 0.91% 0.78% 0.83% 0.78%
Middle East and
Africa - € mn
1289.70 7.99% 1.36% 1.09% 1.02% 1.07% 0.99%
North America - €
mn
324.30 2.01% 0.06% 0.06% 0.07% 0.06% 0.06%
Western Europe -
€ mn
8335.30 0.80% 0.76% 0.73% 0.75% 0.73%
Sum 16145.9 8.482% 7.469% 7.115% 7.569% 7.322%
Forecasted growth per region and weights
Estimated
Estimated from Passport
Growth in Market share
Estimated
18. Appendix I: Income statemend forecast drivers
Items Forecast driver Reasons the forecast driver was chosen
Operating items
Cost of
Merchandise
As % of Revenue As the revenue is increasing, assuming the price of the products and raw
material are stable, the cost of merchandises increases as the revenue increases
as the increases in production sold.
Operating
expense
As % of Revenue The forecast driver for operating expenses which includes the selling and
general & administration (SG&A) less the operating leases expenses.
Lease
Depreciation
As % of prior year
Capitalized leases
Connected to the use of operating lease items.
Depreciation As % of prior year
net PP&E
Connected to the use of PPE.
Provision for tax It was calculated deducting non-operating cash taxes from the operating cash
taxes
Non-Operating items
Interest Expense WACC 10% Interest rate charged from short term and long term interest rate is calculated
interest expense charged for the year over the total debt the company owes in
the beginning of the year. The non-current liability item in the balance sheet
composes interest charges debts as well, according to their annual reports,
items such as financial leases, and credit facilities are sum into to the non-
current liability item line. In the non-operating, therefore we extracted these
items from non-current liability. Assuming we use WACC of 10%.
Other expense
and income net
Randomized The other expense and income net of the company is very changeable during
the previous years. We need more information about the other events, and it is
also hard to forecast these incomes and expenses. That is the reason why we
randomize these items, and after it copy and paste one option.
Amortization Constant Amortization connected to intangible assets, that we did not predict for the
future, because we are assuming that the company is not acquiring new
companies and other intangible assets.
After-Tax Lease
Interest
(1-Operating tax
rate)*Operating
lease*kd
The after-tax interest that connected to operating lease counted with the
operating tax rate and cost of debt multiplied by the yearly amount of operating
lease in the balance sheet.
Interest and
Invest. Income
Interest earning
investment
Interest income rate is calculated dividing the interest income by the average of
the beginning and ending total interest-yielding assets. The interest and
investment income is equal to the interest income rate* the interest yielding
assets.
Income/(Loss)
from Affiliates
Zero Income/(loss) from affiliates, most of the return in the past years were 0,
therefore, we will keep it as zero for our forecast.
Currency
Exchange Gains
(Loss)
Randomized Current Exchange gains(loss) items, to forecast this item, one needs to know the
exchange rate between the Euro and the currency of the countries, Inditex is
participating in, the how the exchange rate between these currencies, which is
very difficult to do. Therefore, we choose to use randomize this item, and then
copy and paste one option.
Other Non-
Operating Inc.
(Exp.)
Zero It were 0 in the last few years, therefore we will keep it as 0 for the forecast.
Minority Int. in
Earnings
As % of minority
interest
This item connected mostly to the minority interests.
Asset
Writedown
As % of prior net
PPE
This is connected to property, plant and equipment, and comes from a yearly
valuation of these items.
19. Appendix J: Balance sheet forecast drivers
Operating Forecast drivers Reasons the forecast driver was chosen
Current Operating Assets
Operating cash As % of Revenue Connected to main operations.
Accounts Receivable As % of Revenue Connected to main operations.
Other Receivables less
other current receivables
As % of Revenue Connected to main operations.
Inventories As % of COGS Connected to main operations.
Other current assets As % of Revenue Connected to main operations.
Non-current Operating Assets
Net PP&E As % of Revenue Connected to main operations.
Goodwill Zero Not modelling potential acquisitions explicitly.
Other Intangibles Zero Not modelling potential acquisitions explicitly.
Capitalized Operating
Leases
As % of Revenue Connected to main operations.
Liabilities
Accounts Payable less
payables do to accosiates
As % of COGS Connected to main operations.
Income tax payable As % of Cash Taxes Connected to main operations.
Accrued Expense As % of Revenue Connected to main operations.
Other Current Liabilities As % of Revenue Connected to main operations.
Financed capitalized
Operating Leases
As % of Revenue Connected to main operations.
Excess cash PLUG This item used as a plug in the forecast, if the liabilities
and equity (excluding newly issued debt) are more than
assets (excluding excess cash), it has a value.
Marketable securities As % of Revenue Marketable securities are forecasted using revenue as
the driver which is the same method used to forecast
the operating cash.
Short Term Investments Constant Assuming the short-term investment remains at the
same level as in 2014, not growing.
Long-term Investments Constant Assuming the long-term investment remains at the
same level as in 2014, not growing.
Loans Receivable Long-
Term
Zero It were 0 in the last few years, therefore we will keep it
as 0 for the forecast.
Deferred Tax Assets, LT The annual growing
rate
We used the growth rate between 2013 and 2014 which
was 21,51%
Other Long-Term Assets The annual growing
rate
In the last three years, the annual growth rate in this
long-term non-operating asset is growing at a rate
20,97%, which we use the forecast the remaining year
using rate in 2014.
Other Current Receivables The annual growing
rate
Other current receivable item is quite volatile according
to the historical data; we decide to use the average
growth in this item in the past 8 years, since in 2014, the
growth from 2013-2014 was 59%, which greater than
any historical year, therefore it is not reasonable to use
2014 as our predictor for the later years. The average is
10% annual growth in this item.
Short-term Borrowings Zero Short-term borrowing: remained 0 in the past few years,
therefore, we keep it 0 for the future forecast.
Curr. Port. of LT Debt Constant We assume there is not growth in future debts. The
increase of new debt will the same amount as paid back
of the debts.
Curr. Port. of Cap. Leases Constant We assume there is not grow in this item.
Long-Term Debt Constant We assume there is not grow in this item.
Capital Leases Constant We assume there is not grow in this item.
Def. Tax Liability, Non-Curr. The annual growing
rate
Using the same method like deferred tax assets.
Pension & Other Post-
Retire. Benefits
Constant We assume there is not grow in this item.
Other Non-Current The annual growing There will be an annual growth in this item.
20. Liabilities rate
Trade Payables due to
associates
Zero There was no significant value in this item.
Newly issued debt PLUG This item used as a plug in the forecast, if the liabilities
and equity (excluding newly issued debt) are less than
assets (excluding excess cash), it has a value.
Common Stock Constant We assume that this line will not change.
Additional Paid In Capital Constant We assume that this line will not change.
Retained Earnings RE t-1 + NI t – Div t Automatically calculated line by using the basic
accounting principle.
Treasury Stock Zero We assume that it will be zero.
Comprehensive Inc. and
Other
Constant We assume that this item will not change.
Minority Interest Constant We use 2014’s Minority interest.
21. Appendix K: Monte Carlo Simulation
To be able to decide which actions to recommend we made a Monte Carlo simulation, using mean and standard deviations from daily
prices since 1.1 2014 to 27.10.2015. We used 100.000 simulations and 95% confidence level. The mean is 25,1837 and standard
deviation 4,0168. The confidence interval is [17.3284, 31.8085] The Since our target price is 44,55 it is placed in the buy column.