1. Core-Shell Nanoparticle Synthesis
115014001650190021502400
%Transmittance
cm-1
1 PVP eqv.
½ PVP eqv.
115014001650190021502400
%Transmittance
cm-1
½ PVP eqv.
1 PVP eqv.
Reducing Carbon Monoxide Emissions: A Core-Shell Bimetallic
Nanoparticle Approach
Z. Decker *, J. Oliveto§, T.M. Selby ¥, R.K. Abhinavam Kailasanathan§, K. Pisane ‡, M. Seehra ‡, F. Goulay§
*Department of Chemistry New College of Florida, Sarasota, Fl, 34243
§C. Eugene Bennett Department of Chemistry West Virginia University, Morgantown, WV, 26506
¥Department of Chemistry, University of Wisconsin-Washington County , West Bend, WI 53095
‡Department of Physics and Astronomy, West Virginia University, Morgantown, WV, 26506
Introduction
Catalytic Converters
Engines undergo incomplete
combustion producing harmful
carbon monoxide (CO) and
nitrogen compounds (NOx).
Three-way catalytic
converters (TWC) currently
use expensive precious metal
nanoparticles such as Pt, Rh,
and Pd to reduce CO
emissions. However, federal
agencies have identified Pt to
be of high supply risk and
high economic importance1.
In addition, these
nanoparticles are only
effective above 150°C. It
takes ~15 s. to warm a cold
TWC for conversion to occur.1
During these ~15s hazardous
CO is released into the
atmosphere.
Our goal is to develop
nanoparticles which exhibit
lower conversion temperatures
while also using less expensive
and more abundant transition
metals. This may be
accomplished using bimetallic
core-shell nanoparticles
combining a precious metal
shell such as Pt with a less
expensive transition metal core
such as Fe.
Fe
Pt
Results
Anneal Under Air
GC analysis displays
decreasing Fe@Pt %CO
conversion temperatures over
time. It is hypothesized that
the stabilizer, PVP, is
obstructing the surface of the
nanoparticles, and is burned
over time. Pd/Pt and Pt are
shown as reference
Future Work
References
Contact
Conclusions
• XRD and ATR-FTIR spectra suggest Fe@Pt
Nanoparticles are initially contaminated by PVP
• ATR-FTIR and XRD spectra suggest annealing the
nanoparticles under air (600 °C) removes any PVP
• GC analysis continues to show an increasing catalytic
efficiency over time suggesting an unknown factor is
affecting catalytic efficiency
• Preliminary Al@Pt & Sn@Pt XRD spectra show no
PVP contamination, but their core-shell character
are under further review
• Further investigate Fe@Pt catalytic efficiency
• Fully characterize Sn@Pt & Al@Pt nanoparticles
• Test Sn@Pt & Al@Pt for catalytic efficiency
• Begin testing nanoparticles with NOx gasses
1. U.S. Department of Energy, Critical materials
strategy, 2011
2. Vayenas, C. G.; C., P.; S., B. and D., T. in Catalysis and
electrocatalysis at nanoparticle surfaces;
Wieckowski, A., Savinova, E. R., Vayenas, C.G., Eds.;
CRC Press 2003:2003
3. Alayoglu, S.; Nilekar, A.; Mavrikakis, M.; Eichhorn, B.
Nature 2008, 7, 333-338
Email: Zachary.Decker12@ncf.edu
Mail: 5800 Bayshore Rd. Sarasota FL 34243 Box# 181
Phone: (850) 529-8945
Home Institution: New College of Florida
𝝓 ↑
𝝓 ↓
Core-shell nanoparticles exhibit
increased catalytic efficiency
due to the metal-metal
interactions. A difference in
Work Function (𝜙) between
each metal correlates to its
efficiency. Two interacting
metals align their Fermi levels
and transfer 𝑒−
inducing an
electric potential. The electric
potential weakens the bond of
electropositive absorbates (CO2)
and strengthens the bond of
electronegative absorbates such
as oxygen, which is needed to
oxidize CO to CO2.
Core-Shell nanoparticle
synthesis occurs by a
sequential reduction process3.
Ethylene glycol is both a
solvent and reducing agent.
Polyvinyl pyrrolidone (PVP) is
used as a stabilizer to form
iron cores. Platinum Chloride
coats the iron cores to form
core-shell nanoparticles. The
nanoparticles are finally
annealed at 600 °C under N2.
Oven
Injector
Switch
FlowControl
Intensity
Retention Time
CO
O2
Catalytic efficiency is measured using an in-lab
built flow tube. CO, He, and O2 gasses are injected
through quartz tubing inside an oven which holds a
nanoparticle sample and a reference
(carbon black). The CO exhaust is analyzed by a Gas
Chromatographer, and the %CO difference
(conversion) between sample and reference is
recorded as a function of temperature.
XRD spectra (left) shows Pt and PVP present. Iron
core is shielded by the platinum surface and thus
does not show in the XRD spectra. TEM shows
primarily spherical particles with a diameter <10nm.
Magnetic measurements (right) show a hysteresis
loop characteristic of ferromagnetic samples.
While XRD shows no iron on the surface, magnetic
studies suggest a magnetic metal is present.
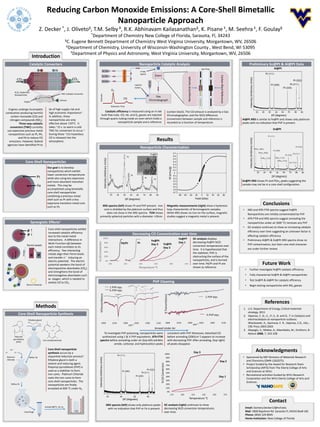
To investigate PVP poisoning, nanoparticles were
synthesized using 1 & ½ PVP equivalents. ATR-FTIR
spectra before annealing under air (top left) exhibits
amide, carbonyl, and hydrocarbon peaks
consistent with PVP. Moreover, Adsorbed CO
before annealing (2065cm-1) appears to increase
with decreasing PVP. After annealing, (top right)
all peaks disappear.
Acknowledgments
• Sponsored by NSF Divisions of Materials Research
and Chemistry (DMR-1262075).
• Project funded by the Award for Research Team
Scholarship (ARTS) from The Eberly College of Arts
and Sciences at WVU.
• Recreational activities funded by WVU Research
Corporation and the WVU Eberly College of Arts and
Sciences.
Core-Shell Nanoparticles
Synergistic Effects2
Methods
Nanoparticle Catalytic Analysis
CarbonBlackReference
NanoparticleSample
Gas Flow
He Gas
O2 Gas
CO Gas
Nanoparticle Characterization
M(emu/g)
Field (kOe)
0.7
0.6
0.5
0.4
0.3
0.2
0.1
0
-0.1
-0.2
-0.3
-0.4
-0.5
-0.6
-0.7
-80 -60 -40 -20 0 20 40 60 80
Decreasing CO Concentration over time
PVP Cleaning
Intensity(ArbitraryUnits)
2𝜃 (degrees)
20 40 60 80
0%
10%
20%
30%
40%
50%
60%
70%
80%
90%
100%
175 195 215 235 255 275
%COConversion
Temperature °C
Day 1
Day 2
Preliminary Sn@Pt & Al@Pt Data
Al@Pt XRD is similar to Fe@Pt and shows only platinum
peaks with no indication that PVP is present.
Iron acetylacetonate
Ethylene glycol
Polyvinyl
pyrrolidone
(PVP)
Reflux 3h
Reflux 2h
Centrifuge
Anneal 600°C, 2h, N2
Platinum
Chloride
2𝜃 (degrees)
Intensity(ArbitraryUnits)
20 30 70605040 80 90
Pt
Pt
Pt
Pt
XRD spectra (left) shows only platinum peaks
with no indication that PVP or Fe is present.
GC analysis (right) continues to show
decreasing %CO conversion temperatures
over time.
Electric Potential
𝒆−
𝒆−
𝒆−
Energy
Fermi Levels
𝝓 𝝓
Exhaust
CO CO2
Engine
Al2O3 Supported
Nanoparticles TWC Catalytic Converter
Day 3
Intensity(ArbitraryUnits)
20 30 40 50 60 70 80 90
2𝜃 (degrees)
Al@Pt
Intensity(ArbitraryUnits)
20 30 40 50 60 70 80 90
2𝜃 (degrees)
Sn@Pt
Sn@Pt XRD shows Pt and PtSn4 peaks suggesting the
sample may not be in a core-shell configuration.
0%
20%
40%
60%
80%
100%
100 150 200 250 300 350
%COConversion
Temperature °C
Fe@PT
Day 1
Fe@Pt
Day 2
Fe@Pt
Day 3Pd/Pt Pt
HeGas
Gas
Chromatograph
2-way
Switch