More Related Content
Similar to Commercial Real Estate Market Overview August 2015_tcm78-50654
Similar to Commercial Real Estate Market Overview August 2015_tcm78-50654 (20)
Commercial Real Estate Market Overview August 2015_tcm78-50654
- 1. 1
0
50
100
150
200
250
300
Suburban Office
CBD Office
USA Realty Advisors, LLC Applied Research
Commercial Real Estate Market Overview
August 21, 2015
Copyright © 2015 AEGON USA Realty Advisors, LLC
www.aegonrealty.com
Post-WW2 Office Demand
In the forty year period from 1950’s-1990’s a variety of factors
caused an increase in demand for suburban office space.
“By 1996, on average, less than 16% of jobs in a metropolitan
area were located within three miles of the traditional city center,
down from 63% as recently as 1960.”1
The suburban trend started, in part, due to the low birth rate dur-
ing the Great Depression and World War II. From 1950 through
1972, the percentage of the population aged 18-34, who histori-
cally prefers downtown to suburban areas, declined from 25%
to 17%. As the office-using work force aged during this period,
suburban office demand increased2
.
Although the sharpest increase in suburban demand occurred
in the 1960’s and 70’s, the trend continued into the 1980’s and
90’s,“when suburban vacancy was below CBD vacancy because
employers were fleeing high crime rates and poor schools.”3
1
Glaeser, E., Kahn, M (2001, February).“Decentralized Employment and the Transformation of the American City”.
<http://www.nber.org/papers/w8117.pdf.>
2
Core Values, Why American Companies are Moving Downtown. By Smart Growth America in partnership with Cushman & Wakefield, Center for RE and Urban
Analysis.“In the late 1960s and‘70s, companies across the country began leaving downtown cores for suburban office campuses.”
3
Doremus, B. (2015, August).“Where is the Demand for Office?”
< http://nreionline.com/commentary/where-demand-office>
4
Both violent and property crime declined significantly between 1990 and 2008 in the 100 largest metro areas, with the largest decreases occurring in cities
(CBDs). The suburban crime rate dropped 7% as the crime rate in the cities dropped 37%. From Metropolitan Policy Program at Brookings.
5
Millennials, aged 18-34, are both the largest living generation (24% of population) and employed generation (34% of workforce).
6
Since 2007, Denver suburban office vacancy has fallen 2.6%, compared to a 1% decline in the CBD. Over this same period, Houston suburban office vacancy is
unchanged while the CBD has seen a 2% increase.
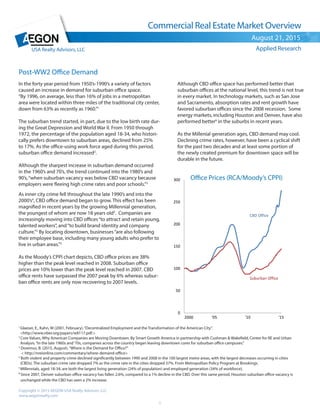
Office Prices (RCA/Moody’s CPPI)
Although CBD office space has performed better than
suburban offices at the national level, this trend is not true
in every market. In technology markets, such as San Jose
and Sacramento, absorption rates and rent growth have
favored suburban offices since the 2008 recession. Some
energy markets, including Houston and Denver, have also
performed better6
in the suburbs in recent years.
As the Millenial generation ages, CBD demand may cool.
Declining crime rates, however, have been a cyclical shift
for the past two decades and at least some portion of
the newly created premium for downtown space will be
durable in the future.
As inner city crime fell throughout the late 1990’s and into the
2000’s4
, CBD office demand began to grow. This effect has been
magnified in recent years by the growing Millennial generation,
the youngest of whom are now 18 years old5
. Companies are
increasingly moving into CBD offices“to attract and retain young,
talented workers”, and“to build brand identity and company
culture.”2
By locating downtown, businesses“are also following
their employee base, including many young adults who prefer to
live in urban areas.”3
As the Moody’s CPPI chart depicts, CBD office prices are 38%
higher than the peak level reached in 2008. Suburban office
prices are 10% lower than the peak level reached in 2007. CBD
office rents have surpassed the 2007 peak by 6% whereas subur-
ban office rents are only now recovering to 2007 levels.
- 2. 2
Copyright © 2015 AEGON USA Realty Advisors, LLC
www.aegonrealty.com
Top And Bottom Trending Markets (Year Over Year)
Vacancy Rent ($/Unit)
Leaders* 14Q2 15Q2 CHANGE 14Q2 15Q2 CHANGE
Richmond 9.0% 7.0% -2.0% $19.15 $19.74 3.1%
Palm Beach County 15.3% 13.6% -1.7% $24.73 $25.49 3.1%
Dallas 15.7% 14.1% -1.6% $20.95 $21.91 4.6%
Washington DC 12.9% 11.3% -1.6% $18.17 $18.77 3.3%
Seattle 10.4% 9.0% -1.4% $33.12 $36.58 10.4%
Laggards**
Tampa 14.4% 15.3% 0.9% $31.79 $31.75 -0.1%
CoStar Portfolio Strategy, 2015 Q2
*Leaders have a favorable vacancy trend and rent growth of 3% or higher.
**Laggards have an unfavorable vacancy trend and rent growth of 0% or lower.
MSA Count Based on Vacancy MSA Count Based on Rent
Favorable Vacancy Trend: 50 Rent Growth Above 0%: 51
Unfavorable Vacancy Trend: 4 Rent Growth Below 0%: 2
Neutral Vacancy Trend: 0 Neutral Rent: 1
Total MSAs: 54 Total MSAs: 54
USA Realty Advisors, LLC
August 21, 2015
Applied Research
Commercial Real Estate Market Overview
Annual Data, CoStar Portfolio Strategy, 2015 Q2
Office
The office vacancy rate dropped to 11.0% in 2015
Q2 from 11.4% a year ago.
Transaction volume was $35.0 billion in 2015 Q2, up
24% from a year ago.
Cap rates fell in both CBD and Suburban locales in
Q2. In the suburbs, the decline was 46 bps from a
year earlier with a 6.8% national average (RCA).
Office prices are 12% above the 2007 peak. CBD of-
fice prices are up 36% from a year ago (Moody’s CPPI
Report, July 2015).
“The national office sector is expected to continue to
improve in 2015... Even though new supply is enter-
ing the sector, the market is projected to continue to
experiencedecliningvacancyratesduetothelength
of the office development cycle” (PwC Real Estate
Investor Survey, Second Quarter 2015).
0%
4%
8%
12%
16%
-75
0
75
150
225
1988 1992 1996 2000 2004 2008 2012
VacancyRate
MillionSquareFeet
Office Market
Completion Net Absorption Vacancy Rate
- 3. 3
USA Realty Advisors, LLC
August 21, 2015
Applied Research
Commercial Real Estate Market Overview
Annual Data, CoStar Portfolio Strategy, 2015 Q2
CoStar Portfolio Strategy, 2015 Q2
*Leaders have a favorable vacancy trend and rent growth of 3% or higher.
**Laggards have an unfavorable vacancy trend and rent growth of 0% or lower.
Copyright © 2015 AEGON USA Realty Advisors, LLC
www.aegonrealty.com
Top And Bottom Trending Markets (Year Over Year)
Vacancy Rent ($/Unit)
Leaders* 14Q2 15Q2 CHANGE 14Q2 15Q2 CHANGE
Las Vegas 6.1% 4.2% -1.9% $775 $812 4.8%
Phoenix 5.8% 4.3% -1.5% $795 $831 4.5%
Jacksonville 6.2% 4.9% -1.3% $843 $874 3.7%
Inland Empire 3.7% 2.5% -1.2% $1,125 $1,178 4.7%
Orlando 4.6% 3.6% -1.0% $982 $1,025 4.4%
Laggards**
All national markets experienced positive rent growth
MSA Count Based on Vacancy MSA Count Based on Rent
Favorable Vacancy Trend: 35 Rent Growth Above 0%: 54
Unfavorable Vacancy Trend: 17 Rent Growth Below 0%: 0
Neutral Vacancy Trend: 2 Neutral Rent: 0
Total MSAs: 54 Total MSAs: 54
0%
4%
8%
12%
16%
-100
0
100
200
300
1994 1997 2000 2003 2006 2009 2012 2015
VacancyRate
ThousandUnits
Apartment Market
Completion Net Absorption Vacancy Rate
APARTMENT
Apartment vacancy was 4.1% in 2015 Q2, up from 4.0%
a year ago (CoStar). Apartment cap rates decreased to
5.9% from 6.1% a year ago (RCA).
Sales volume for apartment properties in the second
quarter totaled $29.7 billion, up 13% from a year ago
(RCA).
Apartment prices increased 15% from a year ago, and
were 29% above the 2007 peak (Moody’s CPPI Report,
May 2015).
“As a result of rising levels of new supply, the U.S.
multifamily sector is projected to continue its transi-
tion from the expansion phase of the real estate cycle
to the contraction phase during 2015. By the end of
this year, 29 metros are expected to be in the contrac-
tion phase, growing to 48 metros by the end of 2017.
At the same time, the number of multifamily metros
in the expansion phase of the cycle drops from 40 to
15” (PwC Real Estate Investor Survey, Second Quarter
2015).
- 4. 4
USA Realty Advisors, LLC
August 21, 2015
Copyright © 2015 AEGON USA Realty Advisors, LLC
www.aegonrealty.com
Applied Research
Commercial Real Estate Market Overview
INDUSTRIAL
The industrial vacancy rate dropped to 6.3% in
2015 Q2 from 6.6% a year ago.
Transaction volume was $16.7 billion in 2015 Q2,
up 40% from a year ago.
Industrial property prices are up 14% from a year
ago, and are 1% above the 2007 peak (Moody’s
CPPI Report, July 2015).
“By the end of 2015, our analysis places the en-
tire U.S. industrial sector in either the recovery or
expansion phase of the cycle with the exception
of one metro. As a result, many metros should en-
joy declining vacancy rates and rising rental rate
growth over the near term. As additional supply
creeps into several metros, certain cities like Aus-
tin and Miami should start to move into the reces-
sion phase of the cycle”(PwC Real Estate Investor
Survey, Second Quarter 2015).
Annual Data, CoStar Portfolio Strategy, 2015 Q2
CoStar Portfolio Strategy, 2015 Q2
*Leaders have a favorable vacancy trend and rent growth of 3% or higher.
**Laggards have an unfavorable vacancy trend and rent growth of 0% or lower.
MSA Count Based on Vacancy MSA Count Based on Rent
Favorable Vacancy Trend: 44 Rent Growth Above 0%: 53
Unfavorable Vacancy Trend: 3 Rent Growth Below 0%: 1
Neutral Vacancy Trend 7 Neutral Rent: 0
Total MSAs: 54 Total MSAs: 54
Top And Bottom Trending Markets (Year Over Year)
Vacancy Rent ($/SF)
Leaders* 14Q2 15Q2 CHANGE 14Q2 15Q2 CHANGE
Las Vegas 10.4% 7.2% -3.2% $5.70 $6.03 5.8%
Nashville 8.9% 6.5% -2.4% $4.46 $4.76 6.7%
Richmond 8.3% 6.0% -2.3% $4.85 $5.04 3.9%
San Francisco 6.7% 4.8% -1.9% $9.52 $9.99 4.9%
Atlanta 10.1% 8.3% -1.8% $4.16 $4.41 6.0%
Laggards**
Indianapolis 6.4% 7.8% 1.4% $4.75 $4.70 -1.1%
0%
4%
8%
12%
16%
-100
0
100
200
300
1982 1987 1992 1997 2002 2007 2012
VacancyRate
MillionSquareFeet
Industrial Market
Completion Net Absorption Vacancy Rate
- 5. 5
USA Realty Advisors, LLC
August 21, 2015
Copyright © 2015 AEGON USA Realty Advisors, LLC
www.aegonrealty.com
Applied Research
Commercial Real Estate Market Overview
Annual Data, CoStar Portfolio Strategy, 2015 Q2
CoStar Portfolio Strategy, 2015 Q2
*Leaders have a favorable vacancy trend and rent growth of 3% or higher.
**Laggards have an unfavorable vacancy trend and rent growth of 0% or lower.
Top And Bottom Trending Markets (Year Over Year)
Vacancy Rent ($/SF)
Leaders* 14Q2 15Q2 CHANGE 14Q2 15Q2 CHANGE
Charlotte 6.7% 5.7% -1.0% $14.14 $15.05 6.4%
Seattle 5.7% 4.7% -1.0% $28.11 $30.24 7.6%
Jacksonville 7.9% 6.9% -1.0% $12.56 $12.96 3.2%
Austin 5.1% 4.3% -0.8% $17.66 $18.42 4.3%
Nashville 7.2% 6.4% -0.8% $13.95 $14.40 3.2%
Laggards**
Minneapolis 5.1% 5.3% 0.2% $13.70 $13.35 -2.6%
MSA Count Based on Vacancy MSA Count Based on Rent
Favorable Vacancy Trend: 51 Rent Growth Above 0%: 38
Unfavorable Vacancy Trend: 3 Rent Growth Below 0%: 16
Neutral Vacancy Trend 0 Neutral Rent: 0
Total MSAs: 54 Total MSAs: 54
Retail
Retail Vacancy decreased to 5.8% in 2015 Q2, down
from 6.2% a year ago (Costar). Cap rates for the retail
sector fell 33 bps from a year earlier to hit 6.55%
in Q2. According to Real Capital Analytics, the previ-
ous low-water mark for the sector was 6.47% back in
2007 before the Global Financial Crisis.
Total sales volume for Q2 was $19 billion, up 22%
from a year earlier (RCA).
Retail Property prices increased 13% from a year
ago, but are 7% below the 2007 peak (Moody’s CPPI
Report, July 2015).0%
4%
8%
12%
16%
0
50
100
150
200
1990 1995 2000 2005 2010 2015
VacancyRate
MillionSquareFeet
Retail Market
Completion Net Absorption Vacancy Rate
- 6. 60-DAY DELINQUENCY RATES
July‘13 July‘14 July‘15
Office 8.9% 6.3% 5.4%
Industrial 11.1% 7.4% 5.7%
Retail 6.5% 5.3% 5.1%
Apartment 5.9% 4.1% 3.1%
Lodging 8.2% 4.8% 3.1%
Total 7.6% 5.5% 4.5%
HIGHEST AND LOWEST DELINQUENCY RATES by MSA
($ Balance in millions, includes Apartment, Retail, Industrial, and Office, top 50 MSAs, Trepp downloaded August 2015)
Highest Delinquent Balance 60+ Days Lowest Delinquent Balance 60+Days
Jacksonville, FL $311 11.2% San Jose, CA $0 0.0%
Atlanta, GA $1408 11.0% Salt Lake City, UT $6 0.3%
Buffalo, NY $118 10.0% New Orleans, LA $8 0.6%
Providence, MA $143 9.8% Austin, TX $37 0.7%
Cleveland, OH $244 8.8% Portland, WA $27 0.7%
Pittsburgh, PA $234 8.5% San Antonio, TX $41 1.0%
Detroit, MI $511 8.4% Houston, TX $187 1.2%
Milwaukee, WI $181 8.4% Louisville, KY $25 1.2%
Birmingham, AL $144 8.3% Raleigh, NC $44 1.5%
Las Vegas, NV $481 7.2% Seattle, WA $127 1.5%
6
CMBS DELINQUENCY
The percentage of loans seriously delinquent*
was
4.3% in July 20151
, down from 5.1% a year ago. The
percentage of loans seriously delinquent peaked at
9.2% in July 2012.
The lodging sector was the most improved sector in
April, declining 1.7% from a year ago.The other three
sectors also improved, with industrial declining 1.6%,
apartment declining 1.0% and retail declining 0.2%.
Copyright © 2015 AEGON USA Realty Advisors, LLC
www.aegonrealty.com
Trepp, August 11, 2015
* Loan 60+ days delinquent, in foreclosure, REO, or non-performing
1
Seriously delinquent percentage may not match Trepp’s monthly
report.
USA Realty Advisors, LLC
August 21, 2015
Applied Research
Commercial Real Estate Market Overview
0%
5%
10%
15%
20%
'00 '01 '02 '03 '04 '05 '06 '07 '08 '09 '10 '11 '12 '13 '14 '15
CMBS Delinquency Rates
60 Days Delinquent Including Non-Performing Balances
Apartment Industrial Office Retail Lodging
Recession
- 7. CAP RATES (RERC)
2012 Q2 2013
Q2
2014
Q2
2015 Q2
Office 6.2% 6.1% 5.7% 5.6%
Industrial 6.8% 6.6% 6.1% 5.8%
Apartment 5.7% 5.5% 5.1% 4.8%
Retail 7.1% 6.7% 6.4% 6.0%
7
TRANSACTION VOLUME
Sales of commercial real estate totaled $118 billion
in 2015 Q2, up 23% from a year ago. The indus-
trialsectorwasthemostimproved,recordinga40%
year-over-year increase in sales volume. The Apart-
ment (+13%), Office (+24%) and Retail (+22%) sec-
tors also recorded volume gains.
USA Realty Advisors, LLC
Copyright © 2015 AEGON USA Realty Advisors, LLC
www.aegonrealty.com
Applied Research
August 21, 2015
CAP RATES
Cap rates continued to fall in Q2 across all property
types from a year ago.The retail sector had the most
capratecompression,declining40basispointsfrom
a year ago.
Real Capital Analytics, 2015 Q2
RERC, 2015 Q2
Commercial Real Estate Market Overview
NUMBER OF PROPERTIES SOLD
2006 Q4 (Peak) 2009 Q1(Trough) 2015 Q2
Office 1,566 259 1,397
Industrial 1,397 274 1,560
Apartment 1,813 374 1,773
Retail 1,892 352 1,627$(40)
$(20)
$-
$20
$40
$60
$80
$100
$120
$140
$160
2001 2005 2010 2015
Billions Commercial Real Estate Transaction Volume
All Property Types - Quarterly
Average Transaction SizeMillions
$16 m
$22 m
$8.6 m
$20 bn
$158 bn $137 bn
$0
$16 m$20
$14 bn
4.5%
6.5%
8.5%
10.5%
1994 1996 1998 2000 2002 2004 2006 2008 2010 2012 2014
Apartment Industrial Office Retail
Commercial Real Estate Cap Rates
Quarterly
Recessions
- 8. 0.9
1.0
1.1
1.2
1.3
1.4
'00 '01 '02 '03 '04 '05 '06 '07 '08 '09 '10 '11 '12 '13 '14 '15
Effective Rent
Apartment Industrial Office Retail
Recessions
8
NCREIF
The trailing one-year return for the NCREIF prop-
erty index (NPI) increased to 13.0% in Q2 2015.
The NPI is a measure of unlevered private equity
returns as determined through application of an
appraisal-based exit price.
USA Realty Advisors, LLC
Copyright © 2015 AEGON USA Realty Advisors, LLC
www.aegonrealty.com
Applied Research
August 21, 2015
EFFECTIVE RENTS
Rent levels in the second quarter rose modestly
across all property types. The Industrial sector re-
ported the highest growth in 2015 Q2, with effec-
tive rents 5.5% higher than a year ago.
Annual rates (appreciation + income)
NCREIF, 2015 Q2
CoStar Portfolio Strategy, 2015 Q2
Industrial +5.5%
Office +4.0%
Apartment +4.0%
Retail +2.6%
Commercial Real Estate Market Overview
15
Effective Rent From a Year
-30%
-20%
-10%
0%
10%
20%
30%
1978 1983 1988 1993 1998 2003 2008 2013
NCREIF Property Index (NPI)
Apartment Industrial Office Retail
Recessions
- 9. 9
USA Realty Advisors, LLC
Copyright © 2015 AEGON USA Realty Advisors, LLC
www.aegonrealty.com
Applied Research
August 21, 2015
TROUBLED ASSETS
Troubled assets were $51 billion in 2015 Q2, down
68% from the peak in 2010 Q2, and down 19% from
a year ago.
Since 2007, $493 billion of commercial mortgages
have been troubled. As of 2015 Q2, 81% of those
mortgages have been worked out.
An asset is defined as“troubled”when there is a default, bankruptcy, or foreclosure pending,
or some kind of lender forbearance or other restructuring of a loan.
RCA reports an analysis of distressed loans by troubled status from their research into CRE
title records, CMBS, and the RCA proprietary commercial transaction data.
Real Capital Analytics, 2015 Q2
Commercial Real Estate Market Overview
RETAIL SALES
Nonstore retail (primarily internet sales) were $119
billion in the second quarter, up 4.9% from a year
ago.
Retail sales, excluding nonstore, were $1.2 trillion in
the first quarter, up 1.4% from a year ago.
Comparing retail sales categories, gasoline stations
declined the most from a year ago (-19%). Electron-
ics and appliance stores also declined (-1%). Food
services and drinking places (+10%) and Motor Ve-
hicle and Parts Dealers (+5%) increased from a year
ago.
U.S. Census Bureau, July 14, 2015
CoStar Portfolio Strategy, 2015 Q2
$0
$100
$200
$300
$400
$500
2007 '08 '09 '10 '11 '12 '13 '14 '15
Billions
Troubled Assets by Status
(All Property Types)
Troubled REO Restructured Resolved
$60
$70
$80
$90
1992 '94 '96 '98 2000 '02 '04 '06 '08 '10 '12 '14
Retail Sales
Quarterly, Inflation Adjusted
Sales/SF (ex nonstore sales)
Sales/SF (including nonstore sales)
Recession
NONSTORE SHARE OF RETAIL
Nonstore (Billions) % Of All Retail Sales
2000 Q2 $44 5.4%
2005 Q2 $63 6.2%
2010 Q2 $84 7.9%
2015 Q2 $119 9.0%
- 10. 10
USA Realty Advisors, LLC
Copyright © 2015 AEGON USA Realty Advisors, LLC
www.aegonrealty.com
Applied Research
August 21, 2015
U.S. Census Bureau, August 3, 2015
Commercial Real Estate Market Overview
CONSTRUCTION SPENDING
The annualized rate for residential construction
spending in June was $371.6 billion, down 13%
from a year ago and 45% lower than the 2006 peak.
Theannualizedratefornon-residentialconstruction
spending in June was $394.8 billion, up 15% from a
year ago but 5% lower than the 2008 peak.
“U.S. construction spending barely rose in June as
private outlays posted their biggest drop in a year,
but the underlying trend suggested the economy
remained on solid ground (Reuters, U.S. construc-
tion spending gain smallest in five months, August
3, 2015).
USDA, Ag Land Values and Cash Rents Annual Summary, August 2015
International Monetary Fund, Primary Commodity Price Index, August 2015
Commodity Prices
The IMF Commodity Index is 48% below the July
2008 peak. For 2015 Q2, Crude Oil (-42%) and En-
ergy (-18%) declined from a year ago (International
Monetary Fund, Monthly data, 2015).
“Commodity prices fell by 1.6% in June, the first de-
cline in three months, driven by price drops in metals
andenergy,duetomacroeconomicrisksinGreeceand
China.Agriculturalpricesregisteredaslightincrease,
mainly the result of weak supply. During the first six
months (Dec 14 – Jun 15), commodity prices fell by
5.% , with declines recorded in all main indices, led
by10%dropsinbothmetalsandfood”(International
MonetaryFund,CommodityMarketMonthly,July16,
2015).
0
1
2
3
4
5
'92 '94 '96 '98 '00 '02 '04 '06 '08 '10 '12 '14
US Farm Value and Commodity Prices
(Values Indexed, 1992=1)
Commodity Index (IMF)
Farm Value (Last Update August 2015)
$0
$200
$400
$600
$800
1996 '98 '00 '02 '04 '06 '08 '10 '12 14
Billions
Private Construction Spending
Residential Non-Residential
Recessions
- 11. ORIGINATIONS BY PROPERTY TYPE
2013 Q2 2014 Q2 2015 Q2
Office 9.3% 6.6% 7.9%
Industrial 3.3% 3.0% 3.8%
Apartment 25.3% 17.2% 26.5%
Retail 10.7% 7.3% 8.3%
Other* 51.4% 66.0% 53.5%
ORIGINATIONS BY INVESTOR CLASS
2013 2014 2015
Life Cos 23.0% 18.7% 16.4%
GSEs 16.0% 30.0% 37.7%
Comm Bank 32.6% 25.8% 25.7%
Conduits 28.4% 25.6% 20.2%
$0
$2
$4
$6
$8
$10
$12
$14
'03 '04 '05 '06 '07 '08 '09 '10 '11 '12 '13 '14 '15
Billions
Life Company Loan Originations
Actual
4Q Trailing
Recession
0
250
500
750
2004 '05 '06 '07 '08 '09 '10 '11 '12 '13 '14 '15
Commercial Loan Originations
Life Insurance GSE's (Fannie/Freddie)
Commercial Banks CMBS/Conduits
Recession
LIFE Cos ORIGINATIONS
(Billions)
2006 Q2 $7.6
2007 Q2 $6.5
2008 Q2 $4.7
2009 Q2 $2.2
2010 Q2 $5.4
2011 Q2 $10.1
2012 Q2 $11.2
2013 Q2 $12.9
2014 Q2
2015 Q2
$11.2
$12.8
11
ORIGINATIONS
USA Realty Advisors, LLC
Copyright © 2015 AEGON USA Realty Advisors, LLC
www.aegonrealty.com
Applied Research
August 21, 2015
Mortgage Bankers Association Quarterly Data Book, 2015 Q2
Mortgage Bankers Association Quarterly Data Book, 2015 Q2
“Second quarter 2015 commercial and multifamily
mortgage loan originations were 29% higher than
during the same period last year and 16% higher
than the first quarter of 2015. Driven by increasing
property values, improving property fundamentals
and still low interest rates, commercial and multifam-
ily lending and borrowing continued its strong pace
in the second quarter”(Quarterly Survey of Commer-
cial/Multifamily Mortgage Bankers Originations, Q2
2015)
*Other includes hotel and health care
Commercial Real Estate Market Overview
- 12. 12
USA Realty Advisors, LLC
Copyright © 2015 AEGON USA Realty Advisors, LLC
www.aegonrealty.com
Applied Research
August 21, 2015
EMPLOYMENT
The July unemployment rate was 5.3%, down from
6.2% a year ago.
Significant payroll increases from a year ago include
construction +3.8%, professional services +3.5%, and
leisure and hospitality +3.0%. Mining and Logging is
the only sector that decreased payroll (-7.1%).
All sectors experienced payroll increases since the
2010 trough. The job types with the highest increases
include mining and logging (+24%) and Leisure and
Hospitality (+17%). Total nonfarm employment in-
creased 7% since 2010.
Bureau of Labor Statistics, Employment Situation, August 7, 2015
Employment figures reflect private and government non-farm jobs
Commercial Real Estate Market Overview
REPEAT SALES INDICES
The Commercial Property Price Index reported by
RCA is up 16% in June from a year ago and up 12%
from the 2007 peak.
The U.S. investment Grade segment increased
11% over the past 12 months. The U.S. General
Commercial Index increased 14% in June from a
year ago.
“Despite strong construction levels, multifamily
properties remained much in favor with investors,
with pricing up 14.1% in the 12 months ending June
2015. The Office Index also gained momentum, in-
creasing by 11.9% during the same period. The
Retail and Industrial Composite Indices advanced
more slowly during the 12 months ending in June
2015, but moved to within 5% and 9% of their pre-
vious peaks, respectively, in the second quarter of
2015” (CoStar Commercial Repeat-Sale Indices, Au-
gust 2015). The Commercial Property Price Index
reported by RCA is up 13.5% in September from
a year ago and has finally matched the 2007 peak.
“Among key drivers of the price recovery were the
Real Capital Analytics/Moody’s Investor Service, July 2015
CoStar Commercial Repeat-Sale Indices, August 2015
The difference between the RCA Index and the CoStar Indices is primarily the methodology
weighting repeat sales, not the data sources.
Commercial Property Price Index (Moody’s/RCA) - Index is based on property sales over $2.5
million.
U.S. Investment Grade (CoStar) - This Index includes Class A and B offices with 35,000 SF or
more, industrial properties with 80,000 SF or more, flex properties with 55,000 SF or more, retail
properties with 25,000 SF or more, multifamily properties with 90,000 SF or more, and hotels
with 125,000 SF or more.
U.S. General Commercial (CoStar) - Only includes properties not meeting the Investment Grade
criteria.
0.5
0.6
0.7
0.8
0.9
1.0
1.1
1.2
2008 2009 2010 2011 2012 2013 2014 2015
Commercial Property Price Index (RCA) U.S. Investment Grade (CoStar)
U.S. General Commercial (CoStar)
2%
4%
6%
8%
10%
12%
-900
-600
-300
0
300
600
UnemploymentRate
PayrollEmploymentM/MChange
Employment Situation July 2015
Payroll Change: 215,000
Unemployment: 5.3%
Recessions
Thousands
- 13. 13
USA Realty Advisors, LLC
Copyright © 2015 AEGON USA Realty Advisors, LLC
www.aegonrealty.com
ADDITIONAL OBSERVATIONS
Commercial Mortgage Alert, June 19, 2015 -- Conduit issuers are increasingly being forced to fine-tune their collateral pools to avoid breach-
ing the standard 30% subordination level on super-senior bonds.While sliding credit quality is putting upward pressure on subordination levels,
issuers are reluctant to see the super-senior benchmark climb above 30%. The reason: They believe investors won’t pay up for the extra credit
enhancement, resulting in lower deal proceeds.
Commercial Mortgage Alert , June 26, 2015 -- Because of new capital-reserve requirements, many banks have drastically reduced the amount of
cashtheirtradingdeskshaveonhandtomaintaininventoriesofCMBSandotherfixed-incomeproducts.Thathasundermineddealers’traditional
role of providing liquidity for bonds they have brought to market, by committing to buy or sell them later at fair prices. It’s no secret that big banks
have scaled back those market-making activities since the crash. But CMBS traders and investors said the retreat has accelerated this year. And it
has become especially pronounced in recent weeks, because trading desks want to minimize their holdings — and the corresponding regulatory
capital charges — on June 30, when the books for the first-half close.
Commercial Mortgage Alert , July 10, 2015 -- Many small and mid-size conduit lenders are finding it harder to get their loans included in securi-
tizations in a timely fashion. For a variety of reasons, the shops are being forced to hold mortgages longer, increasing their warehousing risk and
hedging costs, and reducing how quickly they can recycle capital into new originations.
Real Estate Alert, July 15, 2015 --Merger activity among U.S. real estate companies is running at its fastest pace since the crash, and market pros
don’t see it slowing anytime soon.Twelve deals totaling $40.9 billion closed in the first half, already surpassing the $34.1 billion takeover tally for
all of last year. Another $13.4 billion of pending deals that are scheduled to close by yearend would bring 2015’s volume to $54 billion, the high-
est since the 2007 peak, according to Real Estate Alert’s annual review of the mergers and acquisitions market. And experts say to expect more.
Real Estate Alert, July 29, 2015 -- Sales of large office properties took another big leap in the first half of the year, putting the market on pace to
rival its hottest years, while Eastdil Secured continued its reign as top broker. Some $52.5 billion of office properties traded hands from January
to June, up a sizzling 46% from a year earlier, according to Real Estate Alert’s Deal Database, which tracks transactions of at least $25 million.
Sales are on track to easily surpass the $98.9 billion total in 2006 and to approach 2007’s all-time record of $138.1 billion.
Report prepared by: Don Guarino, Will Pattison, McKinley Kuhlmann, Yirong Song
For questions or comments, please contact Will Pattison at wpattison@aegonusa.com or 319-355-5432
Applied Research
August 21, 2015
Commercial Real Estate Market Overview
CONSUMER CONFIDENCE
The Consumer Confidence Index now stands at
90.9, the lowest level in 2015. The Consumer Sen-
timent Index was 92.9 in August, down from the
final July read of 93.1.
“Consumer confidence declined in July on con-
cerns global risks will dim prospects for the U.S.
economy” (Bloomberg, Consumer Sentiment in
U.S. Retreats Concerns About Economy, July 17,
2015).
Reuters/University of Michigan Consumer Sentiment Index, August 14, 2015
The conference Board Consumer Confidence Index, July 28, 2015
0
50
100
150
2000 '01 '02 '03 '04 '05 '06 '07 '08 '09 '10 '11 '12 '13 '14 '15
Consumer Confidence
Recessions
July 2015
Consumer Confidence: 90.9
Consumer Sentiment: 92.9