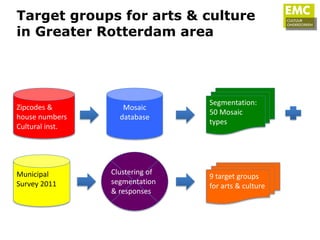
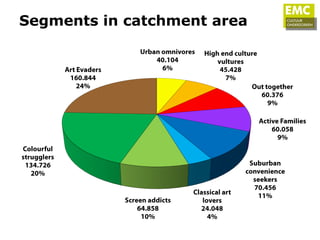
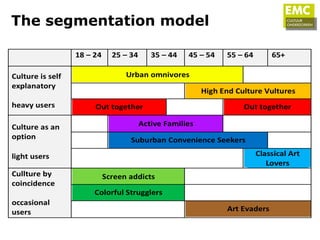
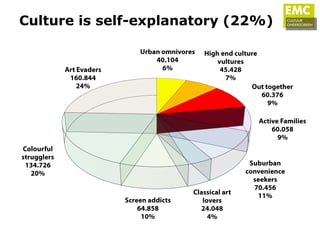
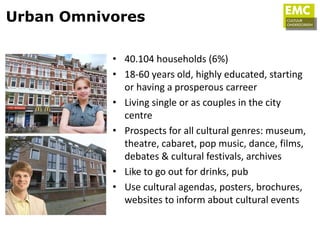
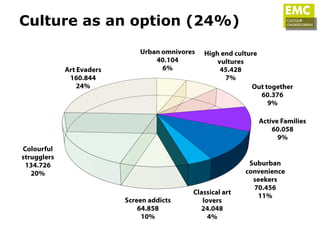
The Rotterdam Arts & Culture
    Segmentation Model
   An effective approach to cultural
marketing in the greater Rotterdam area
Subjects


• Who and what is EMC Cultuuronderzoeken?
• In search of an audience…..
• From data to insight
• From insight to action (your bit)
• Questions & comments
Willem Wijgers

• General director of EMC Cultuuronderzoeken
  before:
• Senior project manager Bureau Promotie Podiumkunsten
• Managing director Vereniging Nederlandse Muziek Ensembles
• Marketing & product manager Vanguard Classics/BMG Classics
EMC Cultuuronderzoeken
• Research & consultancy in the cultural sector
  – Segmentation
  – Customer data analysis
  – Qualitative and quantitative research

• Support for implementation and evaluation
  – Validation of customer databases
  – Creating customer segmentation models
  – Facilitating marketing communication
Most people:

•   Have everything they need
•   Have limited spare time
•   Have enough budget
•   Have 1001 ways to spend it
•   Are in search of meaningful experiences

    So:

      We have to offer them
      a relevant proposition
What has this got to do with you?


• The importance of relevance:
  – Competition on a generic level (time & money)
  – Competition in terms of attention (clutter)
• The quality of the proposition:
  – Claim time & money for a unique experience
  – Combine trust with adventure
• The technical support to deliver it:
  – Fix and connect your systems
  – Organize the disorganized
Is there one audience?


                 I’m afraid not…
What is segmentation?

• Philip Kotler:
  – ‘To divide the market in groups of customers with
    the same preferences in terms of satisfying their
    needs
• Segmentation can take place according to:
  – Demographics
  – Socio-economics
  – Life style
  – Buying behavior / use of (online) media
When to apply segmentation?

• Market and competition lead to it
• Fits in with marketing concept & policy
• Market segments are distinct
• Market segments can be reached
• Affordable to address each of them
Why apply segmentation?

• To make an efficient use of resources by:
  – Targeting campaigns to promising target groups
  – Looking for the appropriate sponsors/funders
  – Catering to needs of specific target groups

• To take accountability seriously
  – Choosing what not to do (Porter)

• To improve results
  – Creating more own income
How (not) to apply segmentation?

•   Involve everyone (even your boss)
•   Invest in generic & flexible ticketing software
•   Don’t throw away ‘old’ data
•   Collect and regularly validate your data
•   Use your own data to start with
•   Make it SMART and use a business case
What data tell about attendance

• Comparison of five seasons of data
What data tell about behaviour

• Cross-over behaviour during 1 theatre season
Possible segments

•   Heavy users: Culture is self explanatory
•   Light users: Cultural activities are an option
•   Occasional visitors: Culture by coincidence
•   Look-alikes & absentees: prospects & churn
•   Stakeholders & shareholders: community at large
Typical customer pyramid


Heavy users   Programming, marketing, attention
(50 %)                             15 %

Light users


                                                               marketing
                                   35 %
(35 %)
Occasional
visitors                           50 %

(15%)
              absentees, potential visitors and non-visitors
A segmentation method
• 12.000 characteristics
                                1   2   3
• Groups & types
• Based on clustering
   • demographic
   • socio-economic
   • life style
                                    A
   • urban / rural region
• Homogeneous within clusters
• Heterogeneous between clusters
Data sources Experian
uses for Mosaic
                               Geodan   Kadaster
                    Navteq                         Dataland

       Falkplan Andes                                   RDC

      Centraal
   Bureau voor de
                        GIS
                                                              Jonge Gezinnen
     Statistiek         data

      Trendbox
                              Registratie
                              Registration                         M&R
                 Onderzoeks- data
                              data                             Developments

                 enMarket
                    lifestyle                                 Kamer van
       Cherridata  research
                 data                                         Koophandel


            TNS Nipo                                    Postnl

                  GfK Panel                        KPN Telecom
                 Services (TOF) NOM     Experian
Mosaic household segmentation
10 groups, 44 types
Dutch society has changed
1.    More single households
2.    Traditional way of life disappears
3.    More cultural diversity
4.    The rich get richer, the poor stay poor
5.    Aging of society increases
6.    Baby-boomers become pensionados
7.    Digital and online are a must
8.    Countryside population decreases
9.    Lowest social layers disappear
10.   Double income has become a necessity
Mosaic Household 2012
Welstand


           Leeftijd
Mosaic Household
• Each of the 7,3 million Dutch households belongs to
  one of the 14 groups and 50 household types
Zipcodes and house numbers

                     • 12 provinces
                     • 400 municipalities
                     • 461.000 zip codes
                     • from 1000 AA to
                       9999 ZZ
                     • separate 6 p zip
                       code per street
                     • Together with
                       number unique
                     • 7.3 million
                       households
Process of segmentation


Zipcodes +       Mosaic database     Segmentation:50
house numbers                        Mosaic types
From database


 Dump from      minimum 1.000      over & under
 ticketing      records needed     representation in
 system                            catchment area
Who lives here?
Zip code 2661RA
Waghenaerdreef 42 - Bergschenhoek

                                                                       Households
                                    Age

                           <45              45+
  Property      Rent       (23x)            (4x)            Children      No children
  (26x)         (1x)                                        (15x)         (12x)

                                                                       Education


 (3x)   (24x)
                                                              Secondary         Higher
                                                              (24x)             (3x)


                  €200k-
                  €360k

                           Sales in last           At least 1 car      2x average (25x)
 Property value            10 years (10x)          (27x)               >2x average (2x)
Example of a Mosaic type
Target groups for arts & culture
in Greater Rotterdam area


                                 Segmentation:
Zipcodes &          Mosaic
                                 50 Mosaic
house numbers      database
                                 types
Cultural inst.


Municipal        Clustering of
                                 9 target groups
Survey 2011      segmentation
                                 for arts & culture
                 & responses
Some data on the segmentation

              • Catchment area: city of
                Rotterdam + 15 kilometres
              • 672.614 households in area
              • 50 venues supplied data
              • Data on 152.000 households
              • 12 genres were distinguished
              • Results municipal leisure
                survey 2011 added
              • 9 segments clustered +
                residual category (7 types)
Segments in catchment area
The segmentation model
Presence in catchment area - 1
Presence in catchment area - 2
Presence in catchment area - 3
Presence in catchment area - 4
Culture is self-explanatory (22%)
Urban Omnivores

           • 40.104 households (6%)
           • 18-60 years old, highly educated, starting
             or having a prosperous carreer
           • Living single or as couples in the city
             centre
           • Prospects for all cultural genres: museum,
             theatre, cabaret, pop music, dance, films,
             debates & cultural festivals, archives
           • Like to go out for drinks, pub
           • Use cultural agendas, posters, brochures,
             websites to inform about cultural events
High End Culture Vultures

             • 45.428 households (7%)
             • Age 45-65+, well to do families
             • Living in attractive suburbs, spending
               time & money on dining and holidays
             • Prospects for most cultural genres:
               museum, theatre, cabaret, classical
               music, dance, films & serious festivals
             • Use most of the media for cultural
               information but especially radio &
               WOM
             • Practice a lot of amateur art forms
Out Together

               • 60.376 households (9%)
               • Age 18-40 and 55-65+
               • (Started) working, living together with
                 no children (anymore). They like
                 daytrips and going out with other
                 people
               • Prospects for pop concerts, cabaret,
                 shows and musicals
               • Don’t have a very strong preference for
                 internet for cultural information
Culture as an option (24%)
Active families

              • 60.068 households (9%)
              • Age 25-55, families with children 0-12
                years old, living in new housing
                development areas and quieter suburbs
              • Prospects for any art form aiming at
                children, including children amateur
                events and performances
              • Also visit a lot of sports events and
                amusement parks
              • Use the Internet, especially at work (!)
              • Favour Rotterdam as a place to go for
                cultural outings
Suburban convenience seekers

           • 70.456 households (11%)
           • Age 25-65, families with older children,
             who need space and freedom
           • Living in the suburbs, working fulltime,
             enjoying to be outdoors & liking shopping
           • Like to visit musicals and cabaret but stay
             away from classical music and museums.
           • They go to amusement parks occasionally
           • Average use of online and offline media
           • They visit community centres for cultural
             events
Classical Art Lovers
             • 24.048 households (4%)
             • Age 50 and older, highly educated,
               living in comfortable houses or city-
               centre apartments
             • Still working but also enjoying more
               and more leisure time they spend on
               gardening, cycling and going out for a
               drink.
             • They go to classical concerts, opera and
               museums and don’t favour any other
               art form
             • They favour print media over all other
               media
Culture by coincidence (54%)
Screen Addicts
            • 64.858 households (10%)
            • Age 18-50, but mostly young (students)
              and people on their first jobs.
            • Spending a lot of time on internet for
              entertainment (gaming, downloading
              music) and on social networks
            • They only are interested in going to
              (arthouse) films and like to explore the
              Rotterdam night life
            • They use alternative websites and
              social media for information on cultural
              outings
Colorful Strugglers

             • 134.726 households (20%)
             • Age 18-50, often with a non-European
               background, living alone or as a family
               with young children, and poorly off,
               renting a modest apartment, with no
               money for luxury
             • They frequently go to the library or the
               cinema and use the Rotterdam pass a lot
             • For cultural information they watch TV
               or read free daily newspapers (Metro)
             • Would like to see more amusement
Art Evaders
              • 160.844 households (24%)
              • Age 50 and older, lower educated
                singles and couples living in simple
                houses, early retired with little money
                and (too) much leisure time
              • They potter, do their daily shopping,
                reading, watch TV, enjoy grandchildren
                and visit community centres but don’t
                go out a lot – no prospects for arts &
                culture
              • They don’t use internet a lot
Effect of using this model

• It shows you the results of your current policy
   – Artistic choices, marketing (incl. sponsoring & education),
     quality of the location
   – Relation with external funding conditions
• It helps you to start CRM/customer retention
• It offers insights in market potential
   – Market penetration & development
   – Product development or diversification
How to involve the Active Families

• Develop a campaign to increase their participation
   –   Form teams (multinational)
   –   Read the case description
   –   Draw a plan to meet the the needs of this segment
   –   Describe possible chances, challenges, limitations
   –   Prepare a short presentation
• Schedule
   –   Preparation            : 10 minutes
   –   Discussion             : 15 minutes
   –   Draw plan              : 10 minutes
   –   Short presentation     : 10 minutes
First and next steps

•   Create and validate database
•   Apply segmentation method
•   Create customer pyramid (RFM-analysis)
•   Connect segmentation/pyramid to database
•   Define customer lifetime value
•   Develop SMART actions and evaluate
•   Think in terms of investment not budget
•   Give it some time (years/seasons)
Questions & comments

• EMC Cultuuronderzoeken in cooperation with
  Rotterdam Festivals
• www.cultuuronderzoeken.nl (in Dutch)
• willem@cultuuronderzoeken.nl
• @willemwijgers

Presentation segmentation model rf en 30 05-2012

  • 1.
    The Rotterdam Arts& Culture Segmentation Model An effective approach to cultural marketing in the greater Rotterdam area
  • 2.
    Subjects • Who andwhat is EMC Cultuuronderzoeken? • In search of an audience….. • From data to insight • From insight to action (your bit) • Questions & comments
  • 3.
    Willem Wijgers • Generaldirector of EMC Cultuuronderzoeken before: • Senior project manager Bureau Promotie Podiumkunsten • Managing director Vereniging Nederlandse Muziek Ensembles • Marketing & product manager Vanguard Classics/BMG Classics
  • 4.
    EMC Cultuuronderzoeken • Research& consultancy in the cultural sector – Segmentation – Customer data analysis – Qualitative and quantitative research • Support for implementation and evaluation – Validation of customer databases – Creating customer segmentation models – Facilitating marketing communication
  • 5.
    Most people: • Have everything they need • Have limited spare time • Have enough budget • Have 1001 ways to spend it • Are in search of meaningful experiences So: We have to offer them a relevant proposition
  • 6.
    What has thisgot to do with you? • The importance of relevance: – Competition on a generic level (time & money) – Competition in terms of attention (clutter) • The quality of the proposition: – Claim time & money for a unique experience – Combine trust with adventure • The technical support to deliver it: – Fix and connect your systems – Organize the disorganized
  • 7.
    Is there oneaudience? I’m afraid not…
  • 8.
    What is segmentation? •Philip Kotler: – ‘To divide the market in groups of customers with the same preferences in terms of satisfying their needs • Segmentation can take place according to: – Demographics – Socio-economics – Life style – Buying behavior / use of (online) media
  • 9.
    When to applysegmentation? • Market and competition lead to it • Fits in with marketing concept & policy • Market segments are distinct • Market segments can be reached • Affordable to address each of them
  • 10.
    Why apply segmentation? •To make an efficient use of resources by: – Targeting campaigns to promising target groups – Looking for the appropriate sponsors/funders – Catering to needs of specific target groups • To take accountability seriously – Choosing what not to do (Porter) • To improve results – Creating more own income
  • 11.
    How (not) toapply segmentation? • Involve everyone (even your boss) • Invest in generic & flexible ticketing software • Don’t throw away ‘old’ data • Collect and regularly validate your data • Use your own data to start with • Make it SMART and use a business case
  • 12.
    What data tellabout attendance • Comparison of five seasons of data
  • 13.
    What data tellabout behaviour • Cross-over behaviour during 1 theatre season
  • 14.
    Possible segments • Heavy users: Culture is self explanatory • Light users: Cultural activities are an option • Occasional visitors: Culture by coincidence • Look-alikes & absentees: prospects & churn • Stakeholders & shareholders: community at large
  • 15.
    Typical customer pyramid Heavyusers Programming, marketing, attention (50 %) 15 % Light users marketing 35 % (35 %) Occasional visitors 50 % (15%) absentees, potential visitors and non-visitors
  • 16.
    A segmentation method •12.000 characteristics 1 2 3 • Groups & types • Based on clustering • demographic • socio-economic • life style A • urban / rural region • Homogeneous within clusters • Heterogeneous between clusters
  • 17.
    Data sources Experian usesfor Mosaic Geodan Kadaster Navteq Dataland Falkplan Andes RDC Centraal Bureau voor de GIS Jonge Gezinnen Statistiek data Trendbox Registratie Registration M&R Onderzoeks- data data Developments enMarket lifestyle Kamer van Cherridata research data Koophandel TNS Nipo Postnl GfK Panel KPN Telecom Services (TOF) NOM Experian
  • 18.
  • 19.
    Dutch society haschanged 1. More single households 2. Traditional way of life disappears 3. More cultural diversity 4. The rich get richer, the poor stay poor 5. Aging of society increases 6. Baby-boomers become pensionados 7. Digital and online are a must 8. Countryside population decreases 9. Lowest social layers disappear 10. Double income has become a necessity
  • 20.
  • 21.
    Mosaic Household • Eachof the 7,3 million Dutch households belongs to one of the 14 groups and 50 household types
  • 22.
    Zipcodes and housenumbers • 12 provinces • 400 municipalities • 461.000 zip codes • from 1000 AA to 9999 ZZ • separate 6 p zip code per street • Together with number unique • 7.3 million households
  • 23.
    Process of segmentation Zipcodes+ Mosaic database Segmentation:50 house numbers Mosaic types From database Dump from minimum 1.000 over & under ticketing records needed representation in system catchment area
  • 24.
  • 25.
    Zip code 2661RA Waghenaerdreef42 - Bergschenhoek Households Age <45 45+ Property Rent (23x) (4x) Children No children (26x) (1x) (15x) (12x) Education (3x) (24x) Secondary Higher (24x) (3x) €200k- €360k Sales in last At least 1 car 2x average (25x) Property value 10 years (10x) (27x) >2x average (2x)
  • 26.
    Example of aMosaic type
  • 27.
    Target groups forarts & culture in Greater Rotterdam area Segmentation: Zipcodes & Mosaic 50 Mosaic house numbers database types Cultural inst. Municipal Clustering of 9 target groups Survey 2011 segmentation for arts & culture & responses
  • 28.
    Some data onthe segmentation • Catchment area: city of Rotterdam + 15 kilometres • 672.614 households in area • 50 venues supplied data • Data on 152.000 households • 12 genres were distinguished • Results municipal leisure survey 2011 added • 9 segments clustered + residual category (7 types)
  • 29.
  • 30.
  • 31.
  • 32.
  • 33.
  • 34.
  • 35.
  • 36.
    Urban Omnivores • 40.104 households (6%) • 18-60 years old, highly educated, starting or having a prosperous carreer • Living single or as couples in the city centre • Prospects for all cultural genres: museum, theatre, cabaret, pop music, dance, films, debates & cultural festivals, archives • Like to go out for drinks, pub • Use cultural agendas, posters, brochures, websites to inform about cultural events
  • 37.
    High End CultureVultures • 45.428 households (7%) • Age 45-65+, well to do families • Living in attractive suburbs, spending time & money on dining and holidays • Prospects for most cultural genres: museum, theatre, cabaret, classical music, dance, films & serious festivals • Use most of the media for cultural information but especially radio & WOM • Practice a lot of amateur art forms
  • 38.
    Out Together • 60.376 households (9%) • Age 18-40 and 55-65+ • (Started) working, living together with no children (anymore). They like daytrips and going out with other people • Prospects for pop concerts, cabaret, shows and musicals • Don’t have a very strong preference for internet for cultural information
  • 39.
    Culture as anoption (24%)
  • 40.
    Active families • 60.068 households (9%) • Age 25-55, families with children 0-12 years old, living in new housing development areas and quieter suburbs • Prospects for any art form aiming at children, including children amateur events and performances • Also visit a lot of sports events and amusement parks • Use the Internet, especially at work (!) • Favour Rotterdam as a place to go for cultural outings
  • 41.
    Suburban convenience seekers • 70.456 households (11%) • Age 25-65, families with older children, who need space and freedom • Living in the suburbs, working fulltime, enjoying to be outdoors & liking shopping • Like to visit musicals and cabaret but stay away from classical music and museums. • They go to amusement parks occasionally • Average use of online and offline media • They visit community centres for cultural events
  • 42.
    Classical Art Lovers • 24.048 households (4%) • Age 50 and older, highly educated, living in comfortable houses or city- centre apartments • Still working but also enjoying more and more leisure time they spend on gardening, cycling and going out for a drink. • They go to classical concerts, opera and museums and don’t favour any other art form • They favour print media over all other media
  • 43.
  • 44.
    Screen Addicts • 64.858 households (10%) • Age 18-50, but mostly young (students) and people on their first jobs. • Spending a lot of time on internet for entertainment (gaming, downloading music) and on social networks • They only are interested in going to (arthouse) films and like to explore the Rotterdam night life • They use alternative websites and social media for information on cultural outings
  • 45.
    Colorful Strugglers • 134.726 households (20%) • Age 18-50, often with a non-European background, living alone or as a family with young children, and poorly off, renting a modest apartment, with no money for luxury • They frequently go to the library or the cinema and use the Rotterdam pass a lot • For cultural information they watch TV or read free daily newspapers (Metro) • Would like to see more amusement
  • 46.
    Art Evaders • 160.844 households (24%) • Age 50 and older, lower educated singles and couples living in simple houses, early retired with little money and (too) much leisure time • They potter, do their daily shopping, reading, watch TV, enjoy grandchildren and visit community centres but don’t go out a lot – no prospects for arts & culture • They don’t use internet a lot
  • 47.
    Effect of usingthis model • It shows you the results of your current policy – Artistic choices, marketing (incl. sponsoring & education), quality of the location – Relation with external funding conditions • It helps you to start CRM/customer retention • It offers insights in market potential – Market penetration & development – Product development or diversification
  • 48.
    How to involvethe Active Families • Develop a campaign to increase their participation – Form teams (multinational) – Read the case description – Draw a plan to meet the the needs of this segment – Describe possible chances, challenges, limitations – Prepare a short presentation • Schedule – Preparation : 10 minutes – Discussion : 15 minutes – Draw plan : 10 minutes – Short presentation : 10 minutes
  • 49.
    First and nextsteps • Create and validate database • Apply segmentation method • Create customer pyramid (RFM-analysis) • Connect segmentation/pyramid to database • Define customer lifetime value • Develop SMART actions and evaluate • Think in terms of investment not budget • Give it some time (years/seasons)
  • 50.
    Questions & comments •EMC Cultuuronderzoeken in cooperation with Rotterdam Festivals • www.cultuuronderzoeken.nl (in Dutch) • willem@cultuuronderzoeken.nl • @willemwijgers