1. DEMOGRAPHICS AND GROWTH
Park City, UT | 2014
Walter Brock | Raymond Dawson | Will Greer | Joseph Powell | Kate Shooltz | Whitney Ward
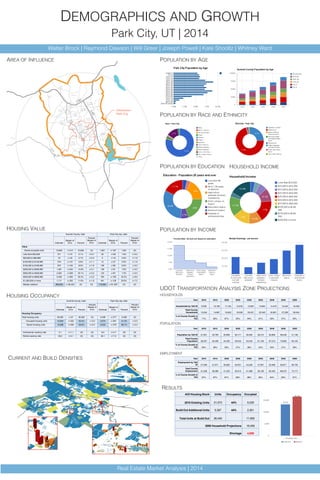
AREA OF INFLUENCE POPULATION BY AGE
POPULATION BY RACE AND ETHNICITY
POPULATION BY EDUCATION
POPULATION BY INCOME
CURRENT AND BUILD DENSITIES
RESULTS
Year 2010 2015 2020 2025 2030 2035 2040 2045 2050
Households by TAZ ID 9,239 10,199 11,125 12,076 12,997 13,824 14,572 15,540 16,459
Total County
Households 13,044 14,867 16,642 18,556 20,421 22,540 24,601 27,339 30,044
% of County Growth in
TAZ 71% 69% 67% 65% 64% 61% 59% 57% 55%
Year 2010 2015 2020 2025 2030 2035 2040 2045 2050
Population by TAZ ID 21,931 23,793 25,699 28,171 30,563 33,212 35,606 38,448 41,136
Total County
Population 36,357 40,439 44,420 49,545 54,542 61,109 67,513 75,850 84,104
% of County Growth in
TAZ 60% 59% 58% 57% 56% 54% 53% 51% 49%
Year 2010 2015 2020 2025 2030 2035 2040 2045 2050
Employment by TAZ
ID 27,509 31,671 35,829 40,031 44,229 47,637 52,598 56,671 60,730
Total County
Employment 31,538 36,386 41,232 46,313 51,398 56,136 62,423 68,570 74,717
% of County Growth in
TAZ 87% 87% 87% 86% 86% 85% 84% 83% 81%
HOUSEHOLDS
UDOT TRANSPORTATION ANALYSIS ZONE PROJECTIONS
POPULATION
EMPLOYMENT
HOUSEHOLD INCOME
Summit County, Utah Park City city, Utah
Estimate
Margin of
Error Percent
Percent
Margin of
Error Estimate
Margin of
Error Percent
Percent
Margin of
Error
Value
Owner-occupied units 10,065 +/-312 10,065 (X) 1,691 +/-187 1,691 (X)
Less than $50,000 211 +/-72 2.1% +/-0.7 32 +/-38 1.9% +/-2.2
$50,000 to $99,999 70 +/-43 0.7% +/-0.4 0 +/-16 0.0% +/-1.8
$100,000 to $149,999 379 +/-107 3.8% +/-1.1 15 +/-27 0.9% +/-1.6
$150,000 to $199,999 870 +/-164 8.6% +/-1.6 136 +/-85 8.0% +/-5.2
$200,000 to $299,999 1,491 +/-224 14.8% +/-2.1 129 +/-91 7.6% +/-5.2
$300,000 to $499,999 2,325 +/-326 23.1% +/-3.2 123 +/-87 7.3% +/-5.0
$500,000 to $999,999 3,548 +/-330 35.3% +/-3.2 765 +/-185 45.2% +/-8.9
$1,000,000 or more 1,171 +/-202 11.6% +/-1.9 491 +/-129 29.0% +/-7.2
Median (dollars) 469,600 +/-28,233 (X) (X) 718,800 +/-61,087 (X) (X)
HOUSING VALUE
Summit County, Utah Park City city, Utah
Estimate
Margin of
Error Percent
Percent
Margin of
Error Estimate
Margin of
Error Percent
Percent
Margin of
Error
Housing Occupancy
Total housing units 26,392 +/-57 26,392 (X) 9,496 +/-277 9,496 (X)
Occupied housing units 13,304 +/-532 50.4% +/-2.0 2,974 +/-261 31.3% +/-2.5
Vacant housing units 13,088 +/-539 49.6% +/-2.0 6,522 +/-276 68.7% +/-2.5
Homeowner vacancy rate 2.1 +/-1.1 (X) (X) 8.5 +/-4.7 (X) (X)
Rental vacancy rate 25.0 +/-5.1 (X) (X) 30.1 +/-7.0 (X) (X)
HOUSING OCCUPANCY
Combined
Real Estate Market Analysis | 2014
AOI Housing Stock Units Occupancy Occupied
2010 Existing Units 21,073 44% 9,239
Build Out Additional Units 5,367 44% 2,361
Total Units at Build Out 26,440 11,600
2050 Household Projections 16,459
Shortage 4,859
13,219
16,459
0
5,000
10,000
15,000
Housing Units
Build Out Needed