Call Girls Yelahanka Bangalore 📲 9907093804 💞 Full Night Enjoy
Unit 36(E).pdf
1. T
o
p
i
c
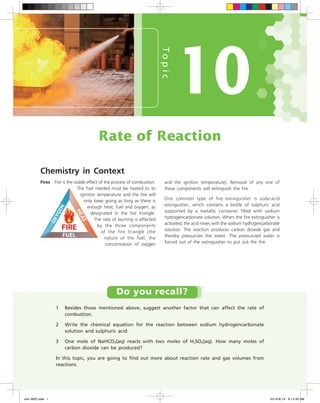
and the ignition temperature). Removal of any one of
these components will extinguish the fire.
One common type of fire extinguisher is soda-acid
extinguisher, which contains a bottle of sulphuric acid
supported by a metallic container filled with sodium
hydrogencarbonate solution. When the fire extinguisher is
activated, the acid mixes with the sodium hydrogencarbonate
solution. The reaction produces carbon dioxide gas and
thereby pressurizes the water. The pressurized water is
forced out of the extinguisher to put out the fire.
Rate of Reaction
10
1 Besides those mentioned above, suggest another factor that can affect the rate of
combustion.
2 Write the chemical equation for the reaction between sodium hydrogencarbonate
solution and sulphuric acid.
3 One mole of NaHCO3(aq) reacts with two moles of H2SO4(aq). How many moles of
carbon dioxide can be produced?
In this topic, you are going to find out more about reaction rate and gas volumes from
reactions.
Do you recall?
Chemistry in Context
Fires Fire is the visible effect of the process of combustion.
The fuel needed must be heated to its
ignition temperature and the fire will
only keep going as long as there is
enough heat, fuel and oxygen, as
designated in the fire triangle.
The rate of burning is affected
by the three components
of the fire triangle (the
nature of the fuel, the
concentration of oxygen
Unit 36(E).indd 1 2014/6/19 9:13:50 AM
2. 36
U n i t
An introduction to rate
of reaction
Unit Key Concepts
• The average rate,
instantaneous rate and
initial rate
• Methods for following
the progress of a
reaction
Fast and slow reactions
36.1
The rate of a chemical reaction describes how fast or slow a reaction
takes place. Explosion of fireworks (Fig. 36.1) and wood burning are
examples of fast reactions. Rusting of iron and weathering of limestone
(Fig. 36.2) are examples of slow reactions.
Fig. 36.1 Explosion of fireworks is a
very fast reaction
Fig. 36.2 Weathering of limestone is a
very slow reaction
There are many reasons why chemists study reaction rates. For
example, they may want to:
• improve the rate of production of a chemical;
• help understand the processes going on in our bodies or in the
environment so that they can control them;
• gain an insight into the mechanism of a reaction, i.e. the series
of steps involved in a reaction.
Unit 36(E).indd 2 2014/6/19 9:13:53 AM
3. Unit 36 An introduction to rate of reaction
The rate of a reaction
36.2
During a chemical reaction, reactants are being consumed while
products are being produced. To describe the rate of a reaction
quantitatively, we can measure how fast the concentration (or amount)
of a reactant or a product changes per unit time.
✓ Rate =
change in concentration (or amount) of a reactant or a product
time
The rate of a reaction is usually expressed in mol dm–3
s
–1
(i.e.
change in molar concentration per second). Other units such as
mol s–1
, cm
3
s
–1
and g s
–1
are also used.
Consider the thermal decomposition of gaseous dinitrogen
pentoxide, N2O5, to give the brown gas nitrogen dioxide and colourless
gas oxygen:
2N2O5(g) 4NO2(g) + O2(g)
colourless brown colourless
A sample of N2O5(g) is allowed to decompose at 55 °C. Fig. 36.3
shows how the concentrations of N2O5(g), NO2(g) and O2(g) vary with
time. Notice that the concentration of N2O5(g) decreases while those
of NO2(g) and O2(g) increase.
Fig. 36.3 Three curves showing how the concentrations of N2O5(g), NO2(g) and O2(g) vary with time
$PODFOUSBUJPO
NPMEN
m
5JNF T
å/0 H NPMEN
m
å/0 H
mNPMENm
åUT
åUT
/0 H
0 H
/0 H
Unit 36(E).indd 3 2014/6/19 9:13:54 AM
4. Topic 10 Rate of Reaction
We can define the rate of a reaction either as the increase in
the concentration of a product per unit time or the decrease in the
concentration of a reactant per unit time.
Let us first look at the formation of nitrogen dioxide. The rate
of formation of nitrogen dioxide is given by the expression:
Rate of formation of NO2(g)
=
concentration of NO2(g) at time t2 – concentration of NO2(g) at time t1
t2 – t1
=
∆[NO2(g)]
∆t
In the above expression,
• square brackets surrounding NO2(g) denote its concentration in
mol dm–3
, and ∆[NO2(g)] is the change in concentration of NO2(g)
during the interval from t1 to t2;
• ∆t is the change in time.
Refer to Fig. 36.3 again. Look at the triangle drawn on the
curve for nitrogen dioxide between the time period 300 s to 400 s.
∆[NO2(g)] represents the vertical side of the triangle while ∆t represents
the horizontal side. The slope of the hypotenuse of the triangle is
∆[NO2(g)]
∆t
, the average rate of formation of nitrogen dioxide during
that time period.
Average rate of formation of NO2(g)
=
∆[NO2(g)]
∆t
=
0.0200 mol dm
–3
– 0.0160 mol dm
–3
400 s – 300 s
= 4.00 x 10⁻⁵
mol dm
–3
s
–1
Now look at the triangle drawn on the curve for dinitrogen
pentoxide. It is defined by ∆[N2O5(g)] and ∆t. As the concentration
of dinitrogen pentoxide decreases with time,
∆[N2O5(g)]
∆t
is a negative
quantity.
As it is usual to work with positive reaction rates, we always
introduce a minus sign when calculating the rate of disappearance
of a reactant. We calculate the average rate of decomposition of
dinitrogen pentoxide during the 300 s to 400 s period as follows:
slope 斜率 average rate 平均速率
Unit 36(E).indd 4 2014/6/19 9:13:55 AM
5. Unit 36 An introduction to rate of reaction
Average rate of decomposition of N2O5(g)
= –
∆[N2O5(g)]
∆t
= –
0.0100 mol dm
–3
– 0.0120 mol dm
–3
400 s – 300 s
= 2.00 x 10
–5
mol dm
–3
s
–1
When quoting a reaction rate, it is important to specify the
reactant or product on which the rate is based because rates of
reactant disappearance and product formation may differ, as in this
example.
Instantaneous rate of reaction
36.3
Often, chemists want to know the rate of a reaction at a specific time
rather than the rate averaged over a time interval ∆t.
Refer to Fig. 36.4 that shows only the concentration of nitrogen
dioxide plotted against time when dinitrogen pentoxide decomposes
at 55 °C. If we make our measurements at shorter and shorter time
intervals, the triangle defined by ∆[NO2(g)] and ∆t will shrink to a
point, and the slope of the hypotenuse of the triangle will approach
the slope of the tangent to the curve at t = 350 s.
Fig. 36.4 The concentration of nitrogen dioxide plotted against time when dinitrogen pentoxide decomposes at 55 °C
5JNF T
/0 H
$PODFOUSBUJPO
NPMEN
m
UBOHFOUUPDVSWF
BUUT
tangent 切線
Unit 36(E).indd 5 2014/6/19 9:13:56 AM
6. Topic 10 Rate of Reaction
The slope of the tangent to a concentration-time curve at a time
t is called the instantaneous rate at that particular time.
Instantaneous rate of formation of NO2(g) at 350 s (Fig. 36.5)
= slope of tangent at 350 s
=
0.0238 mol dm
–3
– 0.0122 mol dm
–3
500 s – 200 s
= 3.87 x 10⁻⁵
mol dm
–3
s
–1
instantaneous rate 瞬間速率 initial rate 初速
Fig. 36.5 Determining the instantaneous rate of formation of nitrogen dioxide at t = 350 s
5JNF T
/0 H
$PODFOUSBUJPO
NPMEN
m
UBOHFOUUPDVSWFBUUT
m T
m NPMEN
m
Initial rate of reaction
The initial rate of reaction equals the instantaneous rate at time =
0.
Initial rate of formation of NO2(g) (Fig. 36.6)
= slope of tangent at 0 s
=
0.0180 mol dm
–3
250 s
= 7.20 x 10
–5
mol dm
–3
s
–1
Unit 36(E).indd 6 2014/6/19 9:13:57 AM
7. Unit 36 An introduction to rate of reaction
Practice 36.1
Fig. 36.6 Determining the initial rate of formation of nitrogen dioxide
5JNF T
/0 H
$PODFOUSBUJPO
NPMEN
m
T
NPMEN
m
UBOHFOUUPDVSWFBUUT
1 X(g) reacts with Y(g) to give Z(g) according to the following equation:
X(g) + 2Y(g) Z(g)
A mixture of X(g) and Y(g) was allowed to react in a closed container.
The graph below shows the changes in concentrations of X(g), Y(g) and Z(g).
5JNF
$PODFOUSBUJPO
Identify the substance that each line indicates.
Continued on next page
Unit 36(E).indd 7 2014/6/19 9:13:58 AM
8. Topic 10 Rate of Reaction
2 In an experiment, 50 cm
3
of 2.0 mol dm
–3
HCl(aq) were mixed
with 2.0 g of zinc powder. The curve in the graph shows the
volume, measured at room temperature and pressure, of the
hydrogen gas liberated in the first few minutes of the experiment.
The dotted line in the graph is the tangent to the curve at the
start of the reaction.
With reference to the graph, calculate
a) the average rate of the reaction in the first 2.0 minutes;
and
b) the initial rate of the reaction with respect to the volume
of hydrogen gas liberated.
titrimetric analysis 滴定分析
7PMVNFPG)
DN
5JNF NJO
UBOHFOU
36.4 Methods for following the
progress of a reaction
To determine the rate of a reaction, we need to follow the change
in concentration of a reactant or a product. There are two types of
methods we can use:
• methods based on a variety of physical properties of the reaction
mixture, such as measurements of the changes in
– the volume of a gaseous product;
– the mass of the reaction mixture;
– the pressure of the reaction mixture;
– the colour intensity of the reaction mixture;
– the turbidity of the reaction mixture.
• method based on titration (i.e. titrimetric analysis).
We will discuss each method in turn.
Unit 36(E).indd 8 2014/6/19 9:13:59 AM
9. Unit 36 An introduction to rate of reaction
36.5 Following the progress of a
reaction by measuring the
change in volume of a gaseous
product
When magnesium reacts with dilute hydrochloric acid, hydrogen gas
is evolved.
Mg(s) + 2HCl(aq) MgCl2(aq) + H2(g)
We can follow the progress of the reaction by measuring the
volume of hydrogen released at regular time intervals.
Fig. 36.7 shows the set-up of the experiment. Allow a piece of
magnesium ribbon to react with the dilute hydrochloric acid in the
conical flask. Record the volume of hydrogen released every 30 seconds
until the reaction stops.
36.1
Following the progress of
a reaction by measuring
the change in volume of a
gaseous product.
Fig. 36.7 Experimental set-up for collecting hydrogen gas released in the reaction between magnesium and dilute
hydrochloric acid (showing the changes in the first half minute only)
EJMVUFIZESPDIMPSJDBDJE
NBHOFTJVNSJCCPO
HBTTZSJOHF
TUPQXBUDI
NJO
HBTCVCCMFT
NJO
Fig. 36.8 shows the curve of volume of hydrogen released plotted
against time.
Fig. 36.8 Results of the reaction between magnesium and dilute hydrochloric acid
7PMVNFPGIZESPHFO
SFMFBTFE
DN
5JNF NJO
UBOHFOUUPDVSWFBUUNJOJTUIF
TUFFQFTU SBUFPGSFBDUJPOUIFIJHIFTU
UBOHFOUUPDVSWFBUUNJOJTMFTT
TUFFQ SBUFPGSFBDUJPOMFTTUIBOUIBU
BUUNJO
UBOHFOUUPDVSWFJT[FSP UIFDVSWF
HPFTGMBUBOEUIFSFBDUJPOIBTGJOJTIFE
Unit 36(E).indd 9 2014/6/19 9:14:00 AM
10. Topic 10 Rate of Reaction
10
Notice the following points from the experimental results:
• The rate of the reaction is the highest at the start of the reaction
and the slope of the tangent to the curve at t = 0 min is the
steepest.
• After 5 minutes, no more hydrogen is released. So, the volume
of hydrogen no longer changes. The reaction has stopped◀
.
• Altogether, 40 cm3
of hydrogen are released in the reaction.
Many other chemical reactions give gaseous products as well. For
example:
• the reaction between calcium carbonate and dilute hydrochloric
acid to give carbon dioxide gas;
CaCO3(s) + 2HCl(aq) CaCl2(aq) + H2O(l) + CO2(g)
• the decomposition of hydrogen peroxide solution to give oxygen
gas.
2H2O2(aq) 2H2O(l) + O2(g)
We can also follow the progress of such reactions by measuring
the change in volume of the gaseous product.
36.6 Following the progress of a
reaction by measuring the change
in mass of the reaction mixture
We can follow the progress of the reaction between calcium carbonate
and dilute hydrochloric acid by measuring the change in mass of
the reaction mixture as the gaseous product (carbon dioxide gas)
escapes.
CaCO3(s) + 2HCl(aq) CaCl2(aq) + H2O(l) + CO2(g)
Fig. 36.9 shows the set-up of the experiment. Add some calcium
carbonate to the dilute hydrochloric acid. Record the mass of the
flask plus its content at the same time and then every 30 seconds
until the reaction stops.
◀
The reaction stops when one of
the reactants has been used up.
Suppose no more magnesium is
left. Magnesium would be the
limiting reactant.
Unit 36(E).indd 10 2014/6/19 9:14:01 AM
11. Unit 36 An introduction to rate of reaction 11
Fig. 36.9 Experimental set-up for measuring the change in mass of the reaction mixture in the reaction between calcium
carbonate and dilute hydrochloric acid (showing the changes in the first half minute only)
TUPQXBUDI
NJO NJO
EJMVUFIZESPDIMPSJDBDJE
DPUUPOXPPM
NBSCMFDIJQT HBTCVCCMFT
H H
FMFDUSPOJDCBMBODF
◀
The cotton wool stops any acid
from splashing out.
Fig. 36.10 shows the curve of the mass of the flask plus the
reaction mixture plotted against time. The loss in mass of the reaction
mixture equals the mass of carbon dioxide released. We may also plot
the loss in mass of the reaction mixture against time (Fig. 36.11).
Fig. 36.10 A plot of mass of the flask plus the reaction
mixture against time
Fig. 36.11 A plot of loss in mass of the reaction mixture
against time
.BTTPGGMBTLQMVTSFBDUJPONJYUVSF
H
5JNF NJO
UBOHFOUUPDVSWFBUUNJOJTUIF
TUFFQFTU SBUFPGSFBDUJPOUIFIJHIFTU
UBOHFOUUPDVSWFBUUNJO
JTMFTTTUFFQ SBUFPGSFBDUJPO
MFTTUIBOUIBUBUUNJO
-PTTJONBTTPGUIFSFBDUJPO
NJYUVSF
H
5JNF NJO
Notice the following points concerning Fig. 36.10:
• The rate of the reaction is the highest at the start of the reaction
and the slope of the tangent to the curve at t = 0 min is the
steepest.
• After 3 minutes, no more carbon dioxide is released. So, the mass
of the flask plus the reaction mixture no longer changes. The
reaction has stopped.
• Altogether, 3.7 g (110.0 g – 106.3 g) of carbon dioxide are released
in the reaction.
Unit 36(E).indd 11 2014/6/19 9:14:02 AM
12. Topic 10 Rate of Reaction
12
36.7 Following the progress of a
reaction by measuring the
change in pressure of the
reaction mixture
When magnesium reacts with dilute hydrochloric acid, hydrogen gas
is formed. If the reaction vessel is a closed system, the pressure inside
the vessel will increase. We can follow the progress of the reaction by
measuring the change in pressure inside the vessel using a pressure
sensor connected to a data-logger interface and a computer.
Fig. 36.12 shows the set-up of the experiment. Tilt the bottle
containing the dilute hydrochloric acid to mix the acid with the
magnesium ribbon. Immediately start recording the pressure inside
the suction flask for about 5 minutes.
pressure sensor 壓強感應器 data-logger interface 數據收集儀界面
Fig. 36.12 Experimental set-up for measuring the change in pressure in the reaction between magnesium and dilute
hydrochloric acid
◀
EBUBMPHHFS
JOUFSGBDF
TVDUJPOGMBTL
NBHOFTJVN
SJCCPO
EJMVUF
IZESPDIMPSJDBDJE
QSFTTVSF
TFOTPS
DPNQVUFS
◀
Caution: Hydrogen gas
produced in the reaction will
cause the pressure inside the
flask to increase.
Practice 36.2
In an experiment, a data-logger with a pressure sensor
was used to study the rate of decomposition of sodium
hypochlorite solution (NaOCl(aq)). The relation between
the pressure and time measured is shown in the curve
below.
5JNF
1SFTTVSF
#
$
a) The decomposition of sodium hypochlorite solution
gives sodium chloride solution and oxygen.
i) Write a chemical equation for the decomposition
of sodium hypochlorite solution.
ii) Explain why a pressure sensor could be used in
this experiment.
b) Referring to the curve, which point (A, B or C)
represents the most rapid reaction? Explain your
choice.
c) How could you know that the decomposition had
finished?
d) Suggest another method for studying the rate of
decomposition of sodium hypochlorite solution.
Unit 36(E).indd 12 2014/6/19 9:14:04 AM
13. Unit 36 An introduction to rate of reaction 13
36.8 Following the progress of a
reaction by measuring the
change in colour intensity of
the reaction mixture
For a chemical reaction involving a coloured reactant or product, the
colour intensity of the reaction mixture would change during the
course of the reaction.
For example, bromine reacts with methanoic acid according to
the following equation:
Br2(aq) + HCOOH(aq) 2Br
–
(aq) + 2H
+
(aq) + CO2(g)
yellow-brown colourless
colourless
When the reaction proceeds, the yellow-brown colour of the
reaction mixture becomes less intense as the concentration of bromine
falls (Fig. 36.13).
Fig. 36.13 The fading colour of bromine as it reacts with methanoic acid
We can follow the progress of the reaction using a colorimeter.
It works on the principle that a coloured species absorb certain
wavelengths of light.
colorimeter 比色計
Unit 36(E).indd 13 2014/6/19 9:14:05 AM
14. Topic 10 Rate of Reaction
14
absorbance 吸光度
In practice, we shine the light upon the sample and record the
fraction of light absorbed. This fraction is called the absorbance. The
absorbance is directly proportional to the colour intensity of the sample
and the concentration of the coloured species in the sample.
Fig. 36.15 shows the curve of absorbance of the reaction mixture
of bromine and methanoic acid plotted against time. During the course
of the reaction, the reaction mixture gradually becomes lighter in
colour as bromine is consumed. Thus, the reaction mixture absorbs
less and less light and so the absorbance goes down.
Many other chemical reactions involve coloured reactants or
products as well. For example,
• in the reaction between iodine and propanone, the intensity of
the brown colour of iodine decreases as the reaction proceeds;
I2(aq) + CH3COCH3(aq) CH3COCH2I(aq) + H
+
(aq) + I
–
(aq)
brown colourless
colourless
• in the oxidation of ethanedioate ions (C2O4
2–
) by permanganate
ions (MnO4
–
), the intensity of the purple colour of permanganate
ions decreases as the reaction proceeds.
2MnO4
–
(aq) + 5C2O4
2–
(aq) + 16H
+
(aq) 2Mn
2+
(aq) + 10CO2(g) + 8H2O(l)
purple colourless colourless
colourless
We can also follow the progress of such reactions by measuring
the change in colour intensity of the reaction mixture.
Fig. 36.15 A plot of absorbance of
the reaction mixture of
bromine and methanoic
acid against time
5JNF
CTPSCBODF
Fig. 36.14 The basic components of a colorimeter
GJMUFS
MJHIU
TPVSDF TBNQMF
MJHIU
EFUFDUPS
PVUQVUUP
NFUFS
PS
DIBSUSFDPSEFS
PS
EBUBMPHHFS
◀
We will discuss how to select
a suitable filter in Topic 15
Analytical Chemistry.
Fig. 36.14 shows the basic components of a colorimeter. It consists
of a light source with filters◀
to select a suitable colour of light which
is absorbed most by the coloured species in the sample. The light
passes through the sample onto a detector whose output goes to a
meter or a recording device.
Unit 36(E).indd 14 2014/6/19 9:14:06 AM
15. Unit 36 An introduction to rate of reaction 15
36.9 Following the progress of a
reaction by measuring the
change in turbidity of the
reaction mixture
When sodium thiosulphate solution reacts with dilute sulphuric acid,
a yellow precipitate of sulphur forms. This changes the turbidity of
the reaction mixture.
Na2S2O3(aq) + H2SO4(aq) Na2SO4(aq) + SO2(g) + H2O(l) + S(s)
Following the progress of the reaction by
‘disappearing cross’ method
Fig. 36.16 shows the experimental set-up. Add dilute sulphuric acid
to the beaker containing some sodium thiosulphate solution and start
timing. Record the time when the reaction mixture becomes so turbid
that the cross can no longer be seen from above (Fig. 36.17).
TPEJVNUIJPTVMQIBUFTPMVUJPO
DSPTTNBSLFEPOQBQFSCFMPX
UIFCFBLFS
BEEEJMVUFTVMQIVSJDBDJE
BOETUBSUUJNJOH
MPPLBUUIFDSPTTUISPVHI
UIFSFBDUJPONJYUVSF
Fig. 36.16 Following the progress of the reaction between sodium thiosulphate
solution and dilute sulphuric acid by ‘disappearing cross’ method
Fig. 36.17 Following the progress of the reaction between sodium thiosulphate solution and dilute sulphuric acid
(a) When the reactants are being
mixed, the cross can be clearly
seen.
(b) The cross gets fainter as more
sulphur precipitate forms.
(c) The reaction mixture becomes so
turbid that the cross can no longer
be seen from above.
Unit 36(E).indd 15 2014/6/19 9:14:09 AM
16. Topic 10 Rate of Reaction
16
The cross can no longer be seen when enough sulphur forms. If
the reaction is fast, the time to reach such a stage will be short. If
the reaction is slow, the time will be long. The time interval taken
to reach such a stage is thus inversely proportional to the average
rate of reaction from the start to this turbid stage.
The average rate
of reaction from
€
∝
1
time to reach this turbid stage
the start to
this turbid stage
However, this method is unlikely to give accurate data as it can
be difficult to decide when the cross can no longer be seen.
Following the progress of the reaction by
using a light sensor
As the reaction between sodium thiosulphate solution and dilute
sulphuric acid proceeds, the turbidity of the reaction mixture increases.
The amount of light that can pass through the reaction mixture gets
less. Thus, we can follow the progress of the reaction by measuring the
change in the amount of light transmitted by the reaction mixture,
i.e. the light transmittance of the reaction mixture.
Fig. 36.18 shows the experimental set-up. The set-up consists of
a light source and a light sensor connected to a data-logger interface
and a computer. The reaction mixture is placed between the light
source and the light sensor.
light transmittance 透光率 light sensor 光感應器
Fig. 36.18 Following the progress of the reaction between sodium thiosulphate solution and dilute sulphuric acid by using a
light sensor
EBUBMPHHFS
JOUFSGBDF
DPNQVUFS
DPWFS
MJHIU
TFOTPS
GJMUFS
CVMC
SFBDUJPONJYUVSF
Unit 36(E).indd 16 2014/6/19 9:14:10 AM
17. Unit 36 An introduction to rate of reaction 17
Practice 36.3
For each of the following reactions, suggest with reason(s) one method that can be used to follow the progress
of the reaction.
a) Reaction between zinc and dilute sulphuric acid
Zn(s) + H2SO4(aq) ZnSO4(aq) + H2(g)
b) Displacement reaction between magnesium and copper(II) sulphate solution
Mg(s) + CuSO4(aq) MgSO4(aq) + Cu(s)
c) Addition of hydrogen to ethene
C2H4(g) + H2(g) C2H6(g)
d) The hydrolysis of urea to carbon dioxide and ammonia
CO(NH2)2(s) + H2O(l) 2NH3(aq) + CO2(g)
Fig. 36.19 shows how the light transmittance of the reaction
mixture varies with time. If the reaction is fast, the time for the light
transmittance of the reaction mixture to fall to a certain level will
be short. If the reaction is slow, the time will be long. This method
gives more accurate data.
Fig. 36.19 A plot of light transmittance of the reaction mixture against time
5JNF
-JHIUUSBOTNJUUBODF
PGUIFSFBDUJPONJYUVSF
Unit 36(E).indd 17 2014/6/19 9:14:11 AM
18. Topic 10 Rate of Reaction
18
◀
We have discussed titration
techniques in Topic 4 Acids and
Bases.
36.10 Following the progress of
a reaction using titrimetric
analysis
Consider the alkaline hydrolysis of an ester, such as ethyl
ethanoate:
CH3COOC2H5(l) + OH
–
(aq) CH3COO
–
(aq) + C2H5OH(aq)
We can follow the progress of the reaction by
• first withdrawing small samples of the reaction mixture at regular
time intervals;
• then determining the concentration of sodium hydroxide
remaining in each sample by titrating the sample against standard
hydrochloric acid◀
.
Fig. 36.20 shows the curve of concentration of hydroxide ions
in the reaction mixture plotted against time. As hydroxide ions are
consumed in the alkaline hydrolysis, the concentration of hydroxide
ions in the reaction mixture decreases with time.
Fig. 36.20 The curve of concentration of hydroxide ions in the reaction mixture
plotted against time
$PODFOUSBUJPOPGIZESPYJEFJPOT
5JNF
Quenching a reaction
As titrimetric analysis takes time, we must have some means to
stop any further reaction in samples once they are withdrawn from
the reaction mixture. The process of stopping a reaction is called
quenching. We can quench a reaction
• by cooling the sample in ice rapidly; or
• by diluting the sample with a large volume of ice-cold water to lower
both the temperature and concentrations of the reactants◀
.
quenching 猝滅
◀
We will discuss the effects of
change in temperature and
concentration on the rate of a
reaction in Unit 37.
Unit 36(E).indd 18 2014/6/19 9:14:12 AM
19. Unit 36 An introduction to rate of reaction 19
TPMVUJPOTPGFUIZMFUIBOPBUF
BOETPEJVNIZESPYJEF
JDFDPMEXBUFS
TNBMMTBNQMFXJUIESBXO
GSPNUIFSFBDUJPONJYUVSF
Fig. 36.21 Quenching the alkaline hydrolysis of ethyl ethanoate by running each
sample withdrawn into excess ice-cold water
For the alkaline hydrolysis of ethyl ethanoate, we can quench
the reaction by running each sample withdrawn into an excess of
ice-cold water (Fig. 36.21).
1 Compare titrimetric analysis with methods based
on changes in physical properties for following
the progress of a reaction. Identify the major
differences between them.
2 Why is it better to select a method that does
not involve sample withdrawal for following the
progress of a reaction?
Discussion
Advantages and disadvantages of using
titrimetric analysis to follow the progress
of a reaction
Advantages
• Titrimetric analysis can be applied to most reactions.
• Only simple laboratory apparatus are required.
Disadvantages
• Samples are withdrawn from the reaction mixture for analysis.
This process disturbs the reaction as the volume of the reaction
mixture has changed.
• Continuous measurement of concentration change is
impossible.
• Titrimetric analysis takes time and thus cannot be used for rapid
reactions.
Unit 36(E).indd 19 2014/6/19 9:14:13 AM
20. Topic 10 Rate of Reaction
20
Have
you
mastered?
Key terms
slope 斜率 4 average rate 平均速率 4 tangent 切線 5 instantaneous rate 瞬間速率 6
initial rate 初速 6 titrimetric analysis 滴定分析 8 pressure sensor 壓強感應器 12
data-logger interface 數據收集儀界面 12 colorimeter 比色計 13 absorbance 吸光度 14
light transmittance 透光率 16 light sensor 光感應器 16 quenching 猝滅 18
Checklist
After studying this unit, you should be able to
recognize that the initial rate equals the instantaneous rate at time = 0;
determine the average rate, instantaneous rate and initial rate of a reaction from a suitable graph;
select and justify the following techniques to follow the progress of a reaction:
• by measuring the change in volume of a gaseous product;
• by measuring the change in mass of a reaction mixture;
• by measuring the change in pressure of a reaction mixture;
• by measuring the change in colour intensity of a reaction mixture;
• by measuring the change in turbidity or light transmittance of a reaction mixture;
• by using titrimetric analysis;
interpret a graph showing the progress of a reaction.
(Put a ‘✔’ in the box if you have acquired the knowledge concerned.)
Have you mastered?
Unit 36(E).indd 20 2014/6/19 9:14:14 AM
21. Unit 36 An introduction to rate of reaction 21
Have
you
mastered?
Summary
1 Rate of a reaction =
change in concentration (or amount) of a reactant or a product
time
2 The instantaneous rate at time t is equal to the slope of the tangent to a concentration-time curve
at that particular time t. The steeper is the slope, the higher the rate is.
5JNF
$PODFOUSBUJPOPGQSPEVDU
JOTUBOUBOFPVTSBUFPGGPSNBUJPOPGQSPEVDU
BUUJNFUTMPQFPGUBOHFOUUPDVSWFBUUJNFU
U
3 The initial rate of reaction equals the instantanous rate at time t = 0.
5JNF
$PODFOUSBUJPOPGQSPEVDU
JOJUJBMSBUFPGGPSNBUJPOPGQSPEVDU
TMPQFPGUBOHFOUUPDVSWFBUUJNFU
Unit 36(E).indd 21 2014/6/19 9:14:15 AM
22. Topic 10 Rate of Reaction
22
Have
you
mastered?
4 The following table summarizes the methods used to follow the progress of different reactions.
Method Example(s)
Measuring the change
in volume of a gaseous
product
Mg(s) + 2HCl(aq) MgCl2(aq) + H2(g)
CaCO3(s) + 2HCl(aq) CaCl2(aq) + H2O(l) + CO2(g)
Measuring the change in
mass of a reaction mixture
CaCO3(s) + 2HCl(aq) CaCl2(aq) + H2O(l) + CO2(g)
Measuring the change
in pressure of a reaction
mixture
Mg(s) + 2HCl(aq) MgCl2(aq) + H2(g)
2H2O2(aq) 2H2O(l) + O2(g)
Measuring the change
in colour intensity of a
reaction mixture
Br2(aq) + HCOOH(aq) 2Br
–
(aq) + 2H
+
(aq) + CO2(g)
CH3COCH3(aq) + I2(aq) CH3COCH2I(aq) + H
+
(aq) + I
–
(aq)
2MnO4
–
(aq) + 5C2O4
2–
(aq) + 16H
+
(aq) 2Mn
2+
(aq) + 10CO2(g) + 8H2O(l)
Measuring the change
in turbidity or light
transmittance of a reaction
mixture
Na2S2O3(aq) + H2SO4(aq) Na2SO4(aq) + SO2(g) + H2O(l) + S(s)
Titrimetric analysis CH3COOC2H5(l) + OH
–
(aq) CH3COO
–
(aq) +C2H5OH(aq)
Unit 36(E).indd 22 2014/6/19 9:14:16 AM
23. Unit 36 An introduction to rate of reaction 23
Unit
Exercise
Unit Exercise
Part I Knowledge and understanding
1 Complete the following concept map.
methods for following
the progress of reaction
reaction between
magnesium and dilute
hydrochloric acid
measuring the
change in volume
of gas
reaction between marble
chips and dilute hydrochloric
acid
used to follow
the progress of
used to follow
the progress of
used to follow
the progress of
used to follow
the progress of
used to follow
the progress of
measuring the
change in
pressure
(a)
(b)
(c)
(d)
(e)
measuring the
change in colour
intensity of
reaction mixture
reaction between sodium
thiosulphate solution and
dilute sulphuric acid
used to follow
the progress of
titrimetric
analysis
Note: The symbol indicates the level of difficulty of a question.
Unit 36(E).indd 23 2014/6/19 9:14:17 AM
24. Topic 10 Rate of Reaction
24
Unit
Exercise
2 A flask containing excess 1 mol dm
–3
hydrochloric acid
was placed on an electronic balance. Some zinc powder
was added into the flask. The mass of the flask and
its contents was plotted against time as shown.
#
$
5JNF T
.BTTPGUIFGMBTLBOEJUTDPOUFOUT
H
a) Write a chemical equation for the reaction in the
flask.
b) Why did the mass of the flask and its contents
decrease?
c) Referring to the curve, which point (A, B or C)
represents the most rapid reaction? Explain your
answer.
Part II Multiple choice questions
Directions: Questions 3 and 4 refer to the following
experiment.
A student carried out four experiments, W, X, Y and Z.
In each experiment she added the same mass of calcium
carbonate to the same volume of hydrochloric acid. The
reaction produced a gas.
Every minute, for five minutes, she measured the volume
of gas that had been given off.
The conditions in all experiments were kept the same,
except that different sized pieces of calcium carbonate
were used.
The following is a table of the student’s results.
Experiment
Volume of gas produced (cm3
)
0
min
1
min
2
min
3
min
4
min
5
min
W 0 22 31 38 40 40
X 0 16 26 35 40 40
Y 0 8 15 25 32 40
Z 0 4 6 8 10 12
3 Which reaction has the highest rate in the first
minute?
A W
B X
C Y
D Z
4 Which reaction did NOT finish within five minutes?
A W
B X
C Y
D Z
(Edexcel GCSE (Foundation and Higher Tiers), Chemistry,
Unit C2, Mar. 2011, 20–21)
5 Which of the following reactions is the slowest?
A Decay of fruit
B Burning of firework
C Reaction between dilute hydrochloric acid and
copper(II) carbonate
D Reaction between lead(II) nitrate solution and sodium
chloride solution
Unit 36(E).indd 24 2014/6/19 9:14:18 AM
25. Unit 36 An introduction to rate of reaction 25
Unit
Exercise
6 The concentration-time graph for a certain chemical
reaction in a closed vessel of fixed volume is shown
below:
$PODFOUSBUJPO
NPMEN
m
5JNF T
1 H
2 H
Which of the following chemical equations correctly
represents the reaction?
A P(g) Q(g)
B Q(g) P(g)
C P(g) 2Q(g)
D Q(g) 2P(g)
(HKDSE, Paper 1A, 2012, 26)
7 Excess marble chips (calcium carbonate) were added
to 25 cm
3
of 2 mol dm
–3
hydrochloric acid. Which
measurement, taken at regular time intervals and
plotted against time, will give the graph shown
below?
5JNF
A Temperature
B Volume of gas produced
C pH of solution
D Mass of the beaker and contents
8 The graph shows the variation of concentration of a
reactant with time as a reaction proceeds.
5JNF T
$PODFOUSBUJPO
NPMEN
m
What is the average reaction rate during the first
20 s?
A 0.0025 mol dm–3
s
–1
B 0.0050 mol dm
–3
s
–1
C 0.0075 mol dm
–3
s
–1
D 0.0150 mol dm
–3
s
–1
9 Jasmine investigated the reaction between magnesium
powder and dilute hydrochloric acid. She added one
spatula of magnesium powder to 25 cm
3
of dilute
hydrochloric acid.
The volume of hydrogen produced during the reaction
was measured every 30 seconds, until after the reaction
had finished.
Which graph shows the results that Jasmine should
have obtained?
5JNF
A
7PMVNFPG
IZESPHFO
5JNF
B
7PMVNFPG
IZESPHFO
5JNF
C
7PMVNFPG
IZESPHFO
5JNF
D
7PMVNFPG
IZESPHFO
(Edexcel GCSE (Foundation Tier), Chemistry, Unit C2,
Jun. 2010, 15)
Unit 36(E).indd 25 2014/6/19 9:14:20 AM
26. Topic 10 Rate of Reaction
26
Unit
Exercise
10 For which of the following can their progress of reaction
be followed by colorimetry?
(1) 2MnO4
–
(aq) + 5C2O4
2–
(aq) + 16H
+
(aq)
2Mn
2+
(aq) + 10CO2(g) + 8H2O(l)
(2) SO3
2–
(aq) + 2H
+
(aq) SO2(aq) + H2O(l)
(3) Br2(aq) + HCOOH(aq)
2Br
–
(aq) + CO2(g) + 2H
+
(aq)
A (1) and (2) only
B (1) and (3) only
C (2) and (3) only
D (1), (2) and (3)
(HKDSE, Paper 1A, 2013, 33)
Part III Structured questions
11 For each of the following reactions, suggest with
reason(s) one method that can be used to follow the
progress of the reaction.
a) Fermentation of glucose
C6H12O6(aq) 2C2H5OH(aq) + 2CO2(g)
b) Reaction between bromate ions and iodide ions
BrO3
–
(aq) + 6I
–
(aq) + 6H
+
(aq)
3I2(aq) + 3H2O(l) + Br
–
(aq)
c) The thermal decomposition of sulphur dichloride
dioxide
SO2Cl2(g) SO2(g) + Cl2(g)
d) The acid catalyzed hydrolysis of methyl ethanoate
CH3COOCH3(l) + H2O(l)
CH3COOH(aq) + CH3OH(aq)
12 The gaseous reaction below takes place at 750 °C in
a closed container with a fixed volume.
2NO(g) + 2H2(g) N2(g) + 2H2O(g)
a) Suggest, with a reason, one method that can be
used to follow the progress of the reaction.
b) In an experiment, a certain amount of NO(g) and
excess H2(g) were allowed to react in a 1.00 dm
3
closed container at 750 °C.
The following graph shows how the concentration
of NO(g) in the reaction mixture varies with time.
/0 H
5JNF NJO
$PODFOUSBUJPO
NPMEN
m
i) From the graph, calculate the average rate of
reaction from the start of the experiment to the
20.0 minute with respect to the concentration
of NO(g).
ii) Suggest how the initial rate of reaction can be
determined from the graph.
iii) Copy the graph and sketch the variation of
concentration of N2(g) with time during the
experiment.
Unit 36(E).indd 26 2014/6/19 9:14:21 AM
27. Unit 36 An introduction to rate of reaction 27
Unit
Exercise
13 Chris investigates the reaction of a weak acid with
magnesium ribbon.
He adds a small amount of magnesium ribbon to
50 cm3
of the weak acid.
He measures the total volume of hydrogen made every
10 seconds.
Look at the apparatus he uses.
XFBLBDJE
NBHOFTJVNSJCCPO
HBTTZSJOHF
At the end of the reaction there was still some
magnesium ribbon in the flask.
Look at the graph of Chris’ results.
5JNF T
7PMVNFPGIZESPHFO
DN
a) What is the total volume of hydrogen made after
18 seconds?
b) At what time did the reaction stop?
c) Explain why the reaction stops.
(OCR GCSE Gateway Science (Higher Tier), Chem. B, Unit 2,
Jun. 2010, 5(c))
14 An experiment was carried out to study the rate of
the following reaction:
CaCO3(s) + 2HCl(aq)
CaCl2(aq) + H2O(l) + CO2(g)
A sample of marble chips was allowed to react with
0.1 mol dm–3
hydrochloric acid, which had been
saturated with carbon dioxide. The graph below shows
the experimental results obtained.
5JNF NJO
7PMVNFPGDBSCPOEJPYJEF
DPMMFDUFE
DN
a) With reference to the graph, calculate the initial
rate of the reaction with respect to the volume of
carbon dioxide collected.
b) Describe, as fully as you can, how the volume of
gas produced changes with time.
Unit 36(E).indd 27 2014/6/19 9:14:23 AM
28. Topic 10 Rate of Reaction
28
Unit
Exercise
15 The effect of temperature changes on reaction rate
can be studied using the reaction between ethanedioic
acid solution and acidified potassium permanganate
solution.
5(COOH)2(aq) + 6H
+
(aq) + 2MnO4
–
(aq)
2Mn
2+
(aq) + 10CO2(g) + 8H2O(l)
BDJEJGJFEQPUBTTJVN
QFSNBOHBOBUFTPMVUJPO
FUIBOFEJPJDBDJE
a) Describe how the reaction time can be
measured.
b) The headings for a set of results are shown
below:
Temperature of
reaction (°C)
Reaction time (s)
Describe how the rate of reaction can be obtained
from the experimental results.
16 A student investigated the rate of reaction between permanganate ions (MnO4
–
) and ethanedioate ions (C2O4
2–
) under
an acidic condition, in the presence of a small concentration of Cu
2+
(aq).
a) Complete and balance the equation of the reaction under an acidic condition:
MnO4
–
(aq) + C2O4
2–
(aq) + Mn
2+
(aq) + CO2(g) +
b) Suggest an experimental method to follow the change in concentration of MnO4
–
(aq) ions in the reaction mixture.
Give a reason for your suggestion.
c) The results are shown in the graph below.
5JNF T
$PODFOUSBUJPOPG.O0
m
BR
JPOT
Y
m
NPMEN
m
i) Calculate the average rate of consumption of MnO4
–
(aq) ions in the first 20 seconds.
ii) Calculate the initial rate of consumption of MnO4
–
(aq) ions.
Unit 36(E).indd 28 2014/6/19 9:14:25 AM
29. Unit 36 An introduction to rate of reaction 29
Unit
Exercise
◀
A catalyst is a substance which
alters the rate of a reaction
without itself undergoing any
permanent chemical changes.
We will discuss this in Unit 37.
17 The decomposition of hydrogen peroxide solution into water and oxygen can be catalyzed by a catalyst
◀
contained
in potatoes.
2H2O2(aq) 2H2O(l) + O2(g)
The progress of the reaction can be followed by recording the mass over a period of time.
9999H
FMFDUSPOJDCBMBODF
QPUBUPEJTDT
IZESPHFOQFSPYJEFTPMVUJPO
The following graph was obtained from experiments to find the effect of pH on the efficiency of the catalyst.
5JNF NJO
.BTTPGBQQBSBUVT
H
Q)
Q)
Q)
a) Calculate the average rate of reaction over the first 20 minutes, in g min
–1
, for the experiment at pH 10.
b) Suggest how the rate of reaction at a particular time can be determined, for the experiment at pH 7.
c) Suggest another way of following the progress of the reaction. Draw a labelled diagram of the experimental
set-up.
Unit 36(E).indd 29 2014/6/19 9:14:26 AM