1. Onuoha, Vivian
December 3, 2015
Statistics 3502
Dr. Bruce Trumbo
Personal Pulse Rate Analysis
Abstract
This statistical analysis provides thirty observations of my pulse rate while I experienced two extremes
of emotional and physical exertion. Fifteen observations were classified under the relaxed category,
providing an average heart rate of 62 beats per minute. The remaining fifteen were determined to belong
to the strenuous category, with an average heart rate of 114.8 beats per minute. The main objective of
this analysis was to observe any underlying statistically significant differences in the observed heart
rates conducted for this class. Computation and analysis of the data was performed with R programming
software.
Keywords: boxplot, skewed, descriptive statistics, inferential analysis, 95% confidence intervals, null
hypothesis
Method
For this project, I identified the activities that I engage in on a regular basis and documented my heart
rate for each activity. I took thirty heart rate measurements over the course of one full week, October 9th
to October 13th, 2015. First, I categorized my daily activities based on stress and/ or exertion levels. The
two categories that I adapted to fit my routines were relaxed and strenuous. For the relaxed
categorization, I labeled activities that required little to no physical effort. Some of the relaxed activities
In order to generate more data, I included activities that I found promoted my mental health and
heighten my sense of relaxation or calm, at that time.
For the strenuous identification, I identified activities where my body was active or when my sense of
anxiety was triggered. From the time of my data collection, I worked from 8:00 am-3:00 pm every day.
After work, I drive from the Oakland airport to the Hayward campus. I attended class from 4:00 pm-
8:00 pm, maintaining about 12 hours of work time and 3-4 hours dedicated to my studies. My stress
levels were monitored at the times that I found myself to be overworked physically or stressed about
completing a class assignment. Physical exertion was observed when I went to the gym or ran to catch
up with the bus. At these moments, I took my heart rate and documented my results. However, this
method did not provide uniform data, as my activities, state of mind, and alertness differed daily.
At the end of each activity, I monitored my heart rate. The method in which I took my heart rate was
consistent with the method that I use from my daily workouts: I checked my pulse for ten seconds and
multiply by six, in order to get an estimate of my heart beat per minute. I used this technique to prevent
myself from losing count after a strenuous activity or distracting situation. However, as a result of
calculating my heart rate in such a manner, I have treated my heart as a chronologically accurate organ,
which is not the case. I did not account for my heart beats decreasing over time within the 60 second
required for counting. Since it was not feasible for me to re-evaluate my heart rate by replicating my
activities, for the purpose of reporting, I maintained the data that I collected and have accounted for the
collection method.
Numerical Descriptions
2. Attached to this report, I have provided a table with the activities, dates, times, and the corresponding
heart rate in beats per minute (bpm). In the activities column, a detailed description is given to add
context to the activities that were performed.
The descriptive statistics for the relaxed category and strenuous category, taken from R outputs, are as
follows:
Table 1: Relaxed and Strenuous Descriptive Data
Minimum 1st Qu. Median Mean 3rd Qu. Maximum Standard
Deviation
Relaxing 48.0 54.0 60.0 62.0 66.0 84.0 9.53
Strenuous 78.0 99.0 114.0 114.8 126.0 168.0 22.89
From my observed data, I was able to derive that my average relaxed pulse rate was 62 beats per minute,
which is within the range of a normal resting heart rate. My fifteen observed relaxed heart rates had a
standard deviation of 9.53bpm, suggesting that there was very little variation between each observation.
With regards to my strenuous data, the average was 114.8 beats per minute with a standard deviation of
22.89 beats per minute. The observed quartile data for the strenuous state reflects that my heart rate was
high, but varied based on the activities in which my mind and body were exerting a significant amount
of effort to complete a particular activity. Below, the relaxed and the strenuous data were plotted on the
same axis for a comparative analysis.
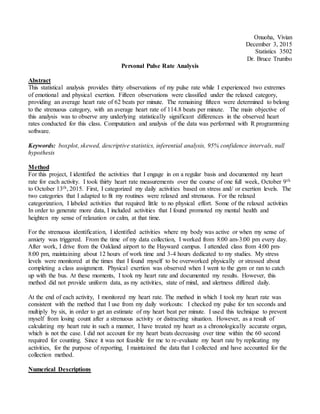
Figure 1: Stripchart of Relaxed and Strenuous Data
Based on the graph, it is evident that I had little overlap between my relaxed and strenuous data. The
observed heart rate that was shared by both categories was 84 bpm, in which this heart rate was
calculated after coming out of the shower and after searching for parking: each belonging to the relaxed
and strenuous classification, respectively. The relaxed data appears to be normally distributed and
symmetrical. The data is slightly skewed to the right. The strenuous data, however, is widely dispersed
and has an apparent outlier at 168 bpm. The strenuous observations are also skewed to the right.
3. Below, there are two histograms illustrating that the relaxed and the strenuous data are skewed towards
the right.
Figure 2: Side by Side Histograms of R and S
The histograms were plotted along with a normal curve. The observations did fall underneath the curve
and seemed to be normal distributed, with inferential analysis to confirm that this is the case in the next
section of this report.
According to this side by side box plot comparison of my relaxed heart rate and my strenuous heart rate,
there was some significant overlap. Although the box plots provide another perspective, it is not as
apparent that the relaxed data and the strenuous data are skewed to the right. The median lines are
approximately centered in the middle of the boxes. For the strenuous data, the R software did plot the
outlier observation of 168 bpm.
Below, a pair of boxplots will provide descriptive data of the quartile calculations:
4. Figure 3:Boxplot of Heart Rates
Inference
Given that the relaxed measurements and the strenuous measurement do have overlap, there is not a
complete separation between the data. However, in performing a one-sided Welch two sample t test with
the alternative hypothesis stating that the population mean of S is smaller than the population mean of R,
the p-value was 0.00000005942 or 5.942 x 10⁻⁸.
Table 2: R software output of Welch Two Sample t-test
Welch Two Sample t-test
data: R and S
t = -8.2477, df = 18.714, p-value = 5.942e-08
alternative hypothesis: true difference in means is less than 0 95
percent confidence interval:
-Inf -41.7218
sample estimates:
mean of x mean of y
62.0 114.8
With this p-value, we know that the populations have different means and that the alternative hypothesis
should be accepted over the null hypothesis, which would have had the differences in population means
equal zero. Due to the fact that the p-value is extremely small, there is complete separation between the
two populations, despite the shared heart rate of 84 beats per minute for the relaxed and the strenuous
observations.
Below, the paired quantile-quantile plots showed the fitness of the relaxed and strenuous data to a
normal distribution. In order for the data to resemble a normal distribution, the observation points should
reside the y=x line, where the data points fit along a straight line with a positive slope of 1. Looking at
the Q-Q plot for the relaxed observations, the relaxed measurements did not quite fit a y=x line.
5. However, the observations are not sporadically dispersed. Interestingly, the strenuous data was closer to
being normally distributed. This was surprising because of the large variance in the data.
Figure 4: Quantile-Quantile Plot
Although it is obvious that the one-sided Welch t-test highlighted that the populations of the gathered
observations are different, it is important to gather if the observations are normally distributed. In order
to do this, I used the Shapiro Wilk test to see if my relaxed observations and my strenuous observations
are consistent with a normal distribution.
The null hypothesis, with regards to the Shapiro Wilk test was that the relaxed measurements and the
strenuous observations are “normal”. With a 95% confidence level, any p-value less than 0.05 would
result in the rejection of the null hypothesis, which is the assumed rejection criterion. In using the
Shapiro Wilk test, the p-value of the relaxed measurements was 0.181 and the p-value for the strenuous
measurements was 0.6795. So, my relaxed and my strenuous observations are normal.
Table 3: R Output for Shapiro-WilkTest
Since both the relaxed data and the strenuous data are approximately normal, a 95% confidence interval
for the population mean could be determined using a Student’s t distribution. Using R software, the 95%
confidence intervals are as follows:
Table 4: 95% Confidence Intervals for R and S
Shapiro-Wilk test
Observation W p-value
Relaxed 0.9182 0.181
Strenuous 0.9593 0.6795
95% confidence intervals (beats per minutes)
Observation Sample Mean
(bpm)
Lower
Bound
Upper Bound
Relaxed 62 56.7 67.3
Strenuous 114.8 102.1 127.5
6. Although the rough rule for a standard resting heart rate for women is 78 bpm, my relaxed observations
illustrate that my 95% confidence interval is about 11 beats per minute below- if my upper bound level
is used. However, a sample size of 15 observations and the procedure in which the data was collected
are possible factors from the deviation away from 78bpm. To add some context to my lower heart rate, I
am physically active and have measured a resting heart rate of 54 beats per minute, which is
theoretically due to my heart’s efficiency. The strenuous observations had a 95% confidence interval of
102.1 bpm to 127.5 bpm. Since my observations were normal, a Wilcoxon Signed Rank test is not
necessary to find the 95% confidence interval for the population mean.
Additionally, since the relaxed observations are approximately normal, I used the chi-squared
distribution to find 95% confidence interval for the population standard deviation. From manual
computation, I determined that the CI for the population standard deviation was as follows:
Table 5: 95% Confidence Interval for Standard Deviation- Relaxed
To test the hypothesis that the two populations have equal variances, I used the F-distribution, with the
assurance that my observations are normally distributed. The ratio of the variances is 5.77. Using the F
distribution with 14 degrees of freedom for the relaxed observations and the strenuous observations, the
null hypothesis is that the population variances for R and S are equal. Since the test statistic, F, is greater
than the F distribution of the upper 0.025 percentile of Fα,df1,df2 =0.3333, I can reject that the relaxed and
the strenuous populations have equal variances with a p-value of 0.001.
After computing the confidence intervals and Shapiro-Wilk test, I have concluded that the tests were
valid. I believe that all relevant assumptions about my observations have been met, especially since my
data resulted in being normal.
Conclusion
There was little overlap in the data obtained while I was in the relaxed state and in the strenuous state.
Some of my relaxed activities did not reflect my heart rate being at rest, so the overlap between the
strenuous and the relaxed was inevitable. For instance, my heart rate after a relaxing shower and my
heart rate recorded after struggling to find a parking spot on a busy street were the same. For the
strenuous and the relaxed activities, my interpretation of what they would consist of varied daily and the
data was greatly dependent on my ability to record and remember to record. My approach was lax,
especially because my personal and academic obligations were often at odds.
In examining my results, I had to take into account my medical and physical history, such my
metabolism and mood. Given that my heart rate, metabolism, and mood fluctuate sporadically, I can
infer that they might result in abnormal and inconsistent readings.
Although my method of data collection was flawed, performing a one-sided Welch t-test and Shapiro-
Wilk test illustrated that there was enough separation in my data to conclude that that the relaxed and
strenuous observations came from distinct populations. The inferential statistics provided the concrete
conclusion that my relaxed and strenuous observations are in fact normally distributed. If more data was
collected during this experiment, I would be able to increase the probability that my relaxed data was
more that 18.1% in the range of normality.
95% confidence intervals (beats per minutes)
Observation Sample Standard
Deviation(bpm)
Lower
Bound
Upper Bound
Relaxed 9.53 6.97 15.03