More Related Content More from VickyAulakh1 (20) 1. For immediate release
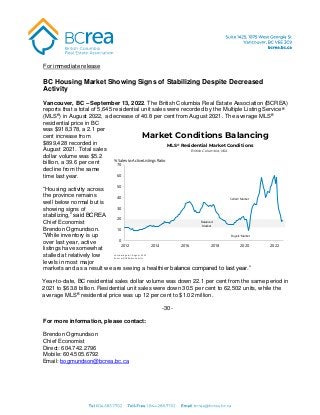
BC Housing Market Showing Signs of Stabilizing Despite Decreased
Activity
Vancouver, BC – September 13, 2022. The British Columbia Real Estate Association (BCREA)
reports that a total of 5,645 residential unit sales were recorded by the Multiple Listing Service®
(MLS®) in August 2022, a decrease of 40.8 per cent from August 2021. The average MLS®
residential price in BC
was $918,378, a 2.1 per
cent increase from
$899,428 recorded in
August 2021. Total sales
dollar volume was $5.2
billion, a 39.6 per cent
decline from the same
time last year.
“Housing activity across
the province remains
well below normal but is
showing signs of
stabilizing,” said BCREA
Chief Economist
Brendon Ogmundson.
“While inventory is up
over last year, active
listings have somewhat
stalled at relatively low
levels in most major
markets and as a result we are seeing a healthier balance compared to last year.”
Year-to-date, BC residential sales dollar volume was down 22.1 per cent from the same period in
2021 to $63.8 billion. Residential unit sales were down 30.5 per cent to 62,502 units, while the
average MLS® residential price was up 12 per cent to $1.02 million.
-30-
For more information, please contact:
Brendon Ogmundson
Chief Economist
Direct: 604.742.2796
Mobile: 604.505.6792
Email: bogmundson@bcrea.bc.ca
2. BC Housing Market Showing Signs of Stabilizing Despite Decreased Activity
August 2022 Residential Average Price, Active Listings
and Sales-to-Active-Listings Data by Board
Residential Average Price ($) Active Listings Sales-to-Active Listings
Board
August 2022
Residential
Average
Price ($)
August 2021
Residential
Average
Price ($) % Change
August 2022
Residential
Active
Listings
(Units)
August 2021
Residential
Active
Listings
(Units) % Change
August 2022
Residential
Sales to
Active
Listings (%)
August 2021
Residential
Sales to
Active
Listings (%)
BC Northern 429,491 399,499 7.5 1,999 1,799 11.1 17.3 27.1
Chilliwack 748,227 711,765 5.1 1,220 531 129.8 12.0 64.6
Fraser Valley 979,584 984,714 -0.5 5,059 3,286 54.0 19.0 60.3
Greater
Vancouver 1,195,428 1,174,176 1.8 10,099 9,494 6.4 18.7 33.7
Interior*
Okanagan 775,967 698,474 11.1 4,210 2,479 69.8 17.7 44.4
Kamloops 580,128 558,291 3.9 1,088 697 56.1 17.2 42.2
Kootenay 533,202 420,940 26.7 1,355 1,127 20.2 19.9 31.6
South Peace** 278,867 326,385 -14.6 256 343 -25.4 16.0 20.7
Powell River 707,707 515,212 37.4 147 120 22.5 23.8 27.5
Vancouver Island 717,002 695,085 3.2 3,140 1,507 108.4 17.6 57.4
Victoria 980,262 875,711 11.9 1,694 867 95.4 27.6 92.7
Province Totals*** 918,378 899,428 2.1 30,267 22,250 36.0 18.7 42.9
*NOTES: The Okanagan Mainline Real Estate Board (OMREB) amalgamated with the South Okanagan Real Estate Board (SOREB) on January 1, 2021, to form
the Association of Interior REALTORS©
. In February 2022, the Association merged with the Kootenay and Kamloops real estate boards.
**The former Northern Lights Board, which was merged with SOREB in 2011, will now be called the South Peach River Region and is part of the new Association
of Interior REALTORS©
.
***Numbers may not add due to rounding
August 2022 BC Residential Multiple Listing Service® Data by Board
Dollar Volume in 000's ($) Unit Sales
Board
August 2022 Dollar
Volume in 000's ($)
August 2021 Dollar
Volume in 000's ($) % Change
August 2022
Unit Sales
August 2021
Unit Sales % Change
BC Northern 148,604 194,955 -23.8 346 488 -29.1
Chilliwack 109,989 244,135 -54.9 147 343 -57.1
Fraser Valley 942,360 1,952,687 -51.7 962 1,983 -51.5
Greater
Vancouver 2,261,750 3,762,060 -39.9 1,892 3,204 -40.9
Interior*
Okanagan 578,871 769,020 -24.7 746 1,101 -32.2
Kamloops 108,484 164,137 -33.9 187 294 -36.4
Kootenay 143,431 149,855 -4.3 269 356 -24.4
South Peace** 11,434 23,173 -50.7 41 71 -42.3
Powell River 24,770 17,002 45.7 35 33 6.1
Vancouver Island 395,785 601,248 -34.2 552 865 -36.2
Victoria 458,762 704,071 -34.8 468 804 -41.8
Province Totals*** 5,184,241 8,582,344 -39.6 5,645 9,542 -40.8
*NOTES: The Okanagan Mainline Real Estate Board (OMREB) amalgamated with the South Okanagan Real Estate Board (SOREB) on January 1, 2021, to form
the Association of Interior REALTORS©
. In February 2022, the Association merged with the Kootenay and Kamloops real estate boards.
**The former Northern Lights Board, which was merged with SOREB in 2011, will now be called the South Peach River Region and is part of the new Association
of Interior REALTORS©
.
***Numbers may not add due to rounding
3. BC Housing Market Showing Signs of Stabilizing Despite Decreased Activity
August 2022 Year-to-Date BC Residential Multiple Listing Service® Data by Board
YTD Dollar Volume in 000's ($) YTD Unit Sales YTD Average Price
Board
August
2022 YTD
Dollar
Volume in
000's ($)
August
2021 YTD
Dollar
Volume in
000's ($)
%
Change
August
2022 YTD
Unit Sales
August
2021 YTD
Unit Sales
%
Change
August
2022 YTD
Average
Price
August
2021 YTD
Average
Price
%
Change
BC Northern 1,327,311 1,462,360 -9.2 3,159 3,861 -18.2 420,168 378,752 10.9
Chilliwack 1,722,032 2,502,634 -31.2 2,018 3,557 -43.3 853,336 703,580 21.3
Fraser Valley 13,107,609 19,085,407 -31.3 11,476 19,256 -40.4 1,142,176 991,141 15.2
Greater
Vancouver 29,262,392 37,525,736 -22.0 22,708 31,910 -28.8 1,288,638 1,175,987 9.6
Interior*
Okanagan 5,862,827 7,140,672 -17.9 7,325 10,389 -29.5 800,386 687,330 16.4
Kamloops 1,337,841 1,473,039 -9.2 2,045 2,698 -24.2 654,201 545,974 19.8
Kootenay 1,184,894 1,216,828 -2.6 2,313 2,762 -16.3 512,276 440,560 16.3
South Peace** 108,559 109,338 -0.7 398 382 4.2 272,760 286,225 -4.7
Powell River 168,055 165,715 1.4 242 326 -25.8 694,441 508,328 36.6
Vancouver
Island 4,599,974 4,974,208 -7.5 5,841 7,735 -24.5 787,532 643,078 22.5
Victoria 5,148,797 6,251,900 -17.6 4,977 7,054 -29.4 1,034,518 886,291 16.7
Province
Totals*** 63,830,291 81,907,842 -22.1 62,502 89,930 -30.5 1,021,252 910,796 12.1
*NOTES: The Okanagan Mainline Real Estate Board (OMREB) amalgamated with the South Okanagan Real Estate Board (SOREB) on January 1, 2021, to form
the Association of Interior REALTORS©
. In February 2022, the Association merged with the Kootenay and Kamloops real estate boards.
**The former Northern Lights Board, which was merged with SOREB in 2011, will now be called the South Peach River Region and is part of the new Association
of Interior REALTORS©
.
***Numbers may not add due to rounding
BCREA is the professional association for about 24,000 REALTORS® in BC, focusing on provincial
issues that impact real estate. Working with the province’s eight real estate boards, BCREA provides
continuing professional education, advocacy, economic research and standard forms to help
REALTORS® provide value for their clients.
For detailed statistical information, contact your local real estate board. MLS® is a cooperative
marketing system used only by Canada’s real estate boards to ensure maximum exposure of properties
listed for sale.