This study evaluated resistance trends among gram-positive cocci in the US over the past decade and assessed the activity of tigecycline against resistant isolates. The key findings were:
1) Resistance increased substantially for MRSA and VRE between 1998-2008, while PRSP and macrolide-resistant Streptococcus pyogenes fluctuated between 15-22% and 8-11%, respectively.
2) Resistance varied regionally, with higher rates in the South and Southeast US compared to other areas.
3) Tigecycline maintained activity against resistant subpopulations of MRSA, PRSP, VRE and macrolide-resistant S. pyogenes, with MICs within
1. Resistance Trends among Gram-Positive Cocci across the US and the Activity Profile of Tigecycline against
Resistant Isolates
Background: Due to the prevalence of methicillin
resistant S. aureus (MRSA); vancomycin resistant
enterococci (VRE); and penicillin resistant S. pneu-
moniae (PRSP), agents used to treat gram-positive
infections should maintain activity against these re-
sistant subpopulations. Data from The Surveillance
Network (TSN) were reviewed for rates of MRSA,
VRE and PRSP in the US over the past 10 years.
The impact of resistance on the activity of tigecy-
cline (TIG), used to treat infections where resistant
gram-positives are commonly encountered, was de-
termined.
Methods: Resistant rates were evaluated using data
from TSN, a database of test results from >150 US
hospitals. Also, recent (‘06-‘09) US clinical isolates
of S. aureus (n=4,158), vancomycin susceptible E.
faecalis (VSE; n=256), S. pneumoniae (n=658) and
S. pyogenes (n=741) were centrally tested by broth
microdilution (CLSI; M7-A8) against TIG. TSN
data were used to evaluate TIG MICs for VRE.
Results: MRSA rates increased from 32-53% dur-
ing ’98-‘08. VRE rates increased (E. faecium: 68-
77%; E. faecalis 2.6-3.8%) over this period while
PRSP rates and macrolide resistance among S. pyo-
genes fluctuated between 16-22% and 8-11%, re-
spectively. Regionally, there was a trend towards
higher rates in the South Atlantic and Mid Atlantic
regions and lower rates in the Pacific and Mountain
regions. TIG had MIC50/MIC90s (g/ml) for MRSA
(0.12/0.25), PRSP (0.015/0.03), and macrolide re-
sistant S. pyogenes (0.03/0.06) identical or within 1
doubling dilution compared with the susceptible
subpopulations. The susceptibility rate for TIG for
S. aureus, S. pnuemoniae, and S. pyogenes was
>99.7%. 87.9% of VSE were susceptible to TIG
with an MIC90 of 0.5 g/ml. For VRE, TIG activity
was similar to VSE based on MIC distributions.
Conclusion: Resistant gram-positive organisms are
common, MRSA and VRE rates have increased in
the US in the past 10 years and rates varied region-
ally. TIG maintained its activity profile for these re-
sistant subpopulations showing that current resis-
tance commonly encountered among target GP has
no impact on its in vitro activity.
Mohana K. Torres1
, Deborah C. Draghi1
, Karla Tomfohrde1
, Chris M. Pillar1
, Venkat Alluru1
, Michael J. Dowzicky2
, Daniel F. Sahm1
1
Eurofins Medinet, Chantilly, VA, USA
2
Wyeth Pharmaceuticals, Collegeville, PA, USA
Poster No. C2-1957
Contact Information:
Chris M. Pillar, Ph.D.
Eurofins Medinet
14100 Park Meadow Drive
Chantilly, VA, USA 20151
Tel. 1.703.480.2500
ResultsIntroductionRevised Abstract
Methods
Conclusions
This study was supported by a grant from Wyeth Pharmaceuticals.
Resistance among frequently encountered gram-positive
pathogens continues to be an issue across the US, given the
prevalence of methicillin resistant S. aureus (MRSA), penicil-
lin and multi-drug resistant S. pneumoniae (PRSP, MDRSP),
and vancomycin resistant enterococci (VRE). Tigecycline, a
broad spectrum glycylcycline, is approved for use in the treat-
ment of complicated skin and skin structure infections
(cSSSIs) and community-acquired pneumoniae (CAP) and,
given these indications, it is important to understand tigecy-
cline activity against resistant subpopulations of gram-positive
organisms likely to be encountered with cSSSIs and CAP.
This study evaluates the prevalence of resistance among gram-
positive cocci both across the US and regionally over the past
10 years and reports the current activity profile of tigecycline
against both resistant and susceptible populations of recent
clinical isolates of gram-positive cocci.
Current resistance rates were evaluated using data from The
Surveillance Network®
(TSN), an electronic database of test re-
sults from >150 US hospitals. Also, recent (2006-2009) US
clinical isolates of S. aureus (n=4,158), vancomycin susceptible
E. faecalis (n=256), S. pneumoniae (n=658) and S. pyogenes
(n=741) were collected from 176 hospitals across the nine US
Census Regions (table) and centrally tested at Eurofins Medi-
net by broth microdilution (CLSI M7-A8; CLSI M100-S18)
against tigecycline. Tigecycline activity against gram-positive
cocci from surveillance studies were analyzed by relevant resis-
tance phenotypes. TSN data were used to evaluate tigecycline
MICs for vancomycin resistant enterococci (VRE). Multi-drug
resistant S. pneumoniae (MDRSP) was defined as resistant to
≥2 of the following agents: penicillin, cefuroxime, erythromy-
cin, tetracycline, and
trimethoprim-
sulfamethoxazole. Tigecy-
cline FDA breakpoints were
used to interpret data. S.
aureus with MICs ≤0.5 µg/
mL, S. pneumoniae ≤0.06 µg/
mL, S. pyogenes ≤0.25 µg/
mL, and E. faecalis
(vancomycin susceptible
only) ≤0.25 µg/mL were in-
terpreted as susceptible.
Acknowledgments
Resistance among gram-positive cocci is common in the US with a
large increase in the amount of MRSA over the past decade.
There is variation in the rates of resistance regionally with a general
trend towards increased resistance in the south and south eastern US
relative to other areas, with lower resistance in the western US, in par-
ticular for PRSP and MRSA.
Tigecycline maintains the same activity profile against the evaluated re-
sistant subpopulations of gram-positive cocci (MRSA, PRSP, VRE and
macrolide-resistant S. pyogenes) relative to the respective susceptible
subpopulations.
Due to its broad-spectrum of activity which includes resistant gram-
positive cocci, tigecycline is a valuable therapeutic option for the treat-
ment of cSSSI and CAP, infections where resistant gram-positive iso-
lates are likely to be encountered.
Streptococci
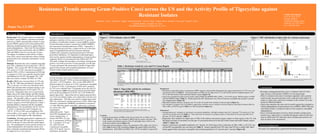
Resistance to penicillin among S. pnuemoniae (PRSP; based on oral penicillin breakpoints) has ranged from between 15-22% over a ten
year period in the US (Table 1). Current prevalence of PRSP vary by region from 11% in the Pacific and New England regions to 20-
25% in the West South Central and South Atlantic regions (Figure 1b).
Tigecycline maintained similar activity profiles against PRSP and MDRSP (MIC50/MIC90 = 0.015/0.03 g/ml, 100%S) relative to PSSP
and non-MDRSP isolates (Table 2). Similar tigecycline MIC distributions were observed between susceptible and resistant S. pneumo-
niae subpopulations (Figure 2b).
Macrolide resistance among S. pyogenes was 11% in the US overall with variation in rates by region (Figure 1c).
All evaluated S. pyogenes were susceptible to tigecycline, and there was no variation in activity based on macrolide resistance either by
MIC50/MIC90 (0.03/0.06 g/ml; Table 2) or MIC distribution (Figure 2c).
Enterococci
Among enterococci, resistance to vancomycin was species dependent, with high resistance rates for E. faecium (77%) relative to E. fae-
calis (4%) currently in the US (Table 1). These rates show an increase in resistance relative to that observed 10 years ago (68% for E.
faecium, 3% for E. faecalis; Table 1).
Regionally, there tended to be higher rates of VRE in the midwest and eastern regions relative to other regions in the US, with
the largest increases in resistance over the past 10 year period observed in the East South Central and South Atlantic regions
(Table 1, Figure 1d).
Against vancomycin susceptible population of E. faecalis, for which tigecycline is indicated, an MIC50/MIC90 of 0.12/0.5 g/
ml and 88% susceptibility rate was observed (Table 2). Results reported from TSN show that TIG has a similar MIC distri-
bution against both vancomycin susceptible and resistant populations of E. faecalis and E. faecium (Figure 2d).
S. aureus
Overall, the prevalence of MRSA in the US rose from 32% in 1998 to 53% in
2008 (Table 1). There was variation in MRSA rates by region, with rates <50%
in the western and northeast regions of the US and higher rates (>60%) in the
south and southeast regions (Figure 1a).
Tigecycline activity against S. aureus was identical by MIC50/MIC90 (0.12/0.25
g/ml; Table 2) and by MIC distribution (Figure 2a) against MRSA and MSSA
subpopulations. Both MSSA and MRSA were >99.8% susceptible to tigecycline.
Source % overall
Lower respiratory tract 15.9
Upper respiratory tract 14.8
Urine 5.0
Blood 13.6
Skin/Wound 47.3
Other 3.4
Region
East North Central 17.7
East Sout Central 9.5
Mid Atlantic 11.7
Mountain 10.4
New England 6.2
Pacific 11.3
South Atlantic 12.2
West North Central 11.4
West South Central 9.6
Strain Diversity from '06-'09 Clinical Isolates
Figure 2. MIC distribution of tigecycline by resistance phenotype
a. S. aureus b. S. pneumoniae
MSSA/ MRSA, methicillin susceptible/ resistant S. aureus PSSP/ PRSP, penicillin susceptible/ resistant S. pneumoniae ; MDR, multi-drug resistant
c. S. pyogenes d. Enterococci from TSN database (2006-2008)
Ery S/ Ery R, erythromycin sysceptible/ resistant VSEfc/ VREfc, vancomycin susceptible/ resistant E. faecalis; VSEfm/ VREfm, vancymycin susceptible/ resistant E. faecium
FDA MIC breakpoints for vancomycin susceptible E. faecalis were used for interpretation
0
10
20
30
40
50
60
≤0.008 0.015 0.03 0.06 0.12 0.25 0.5 1 2 4
MIC (g/mL)
%ofisolatesatMIC
MSSA
MRSA
S NS
0
10
20
30
40
50
60
70
80
≤0.008 0.015 0.03 0.06 0.12 0.25 0.5 1 2 4
MIC (g/mL)
%ofisolatesatMIC
Ery S
Ery R
S NS
0
10
20
30
40
50
60
70
80
90
100
≤0.12 0.25 0.5 1 2 4 >4
MIC (g/mL)
%ofisolatesatMIC
VSEfc
VREfc
VSEfm
VREfm
S NS
0
10
20
30
40
50
60
70
80
90
≤0.008 0.015 0.03 0.06 0.12 0.25 0.5 1 2 4
MIC (g/mL)
%ofisolatesatMIC
PSSP
PRSP
non-MDR
MDR
S NS
Table 2. Tigecycline activity by resistance
phenotypes (2006-2009)
Figure 1. TSN resistance rates in 2008
a. MRSA b. PRSP (in 2007*) c. EryR SPY (in 2006-2008*) d. VREfc / VREfm
MRSA, methicillin resistant S. aureus PRSP, penicillin resistant S. pneumoniae EryR SPY, erythromycin resistant S. pyogenes VREfc/ VREfm, vancomycin resistant E. faecalis / E. faecium
*Data from 2007 interpreted using oral penicillin breakpoints *Due to low reporting, resistance rates determined from 2006-2008
DC
50-59.9%
≤ 40-49.9% R
60% R
43.3%
N=43,538
59.6%
N=11,841
53.1%
N=11,636
62.2%
N=21,521
51.4%
N=17,736
68.8%
N=3,422
58.3%
N=48,621
48.6%
N=25,161
44.3%
N=8,476
DC
15-19.9%
≤ 10-14.9% R
20% R
10.7%
N=1,233
15.5%
N=536
18.0%
N=1,099
20.2%
N=1,284
18.6%
N=908
14.6%
N=233
24.0%
N=1,720
17.8%
N=843
11.0%
N=547
DC
10-14.9%
≤ 5-9.9% R
15% R
11.4%
N=438
9.6%
N=94
13.7%
N=190
17.2%
N=203
7.7%
N=273
9.2%
N=76
15.2%
N=1,272
8.2%
N=608
13.7%
N=612
DC
VREfc: 2.5%, N=4,525
VREfm: 73.4%, N=1,548
VREfc: 1.1%, N=2,884
VREfm: 52.8%, N=430
VREfc: 4.0%, N=1,803
VREfm: 62.2%, N=635
VREfc: 2.0%, N=3,200
VREfm: 79.3%,
N=1,547
VREfc: 9.0%, N=3,730
VREfm: 77.8%, N=1,530
VREfc: 2.2%, N=770
VREfm: 65.5%, N=174
VREfc: 3.3%, N=6,090
VREfm: 81.8%, N=3,372
VREfc: 4.5%, N=3,234
VREfm: 79.8%, N=1,551
VREfc: 4.3%, N=1,288
VREfm: 74.0%, N=308
Table 1. Resistance trends by year and US Census Region
US Census Region 1998 2001 2004 2008 2008-1998 1998 2001 2004 2007* 2007-1998 1998 2001 2004 2008 2008-1998 1998 2001 2004 2008 2008-1998 1998 2001 2004 2008 2008-1998
Overall 32.4 42.9 52.3 52.7 20.3 16.4 22.0 15.5 17.8 1.4 9.3 7.5 10.6 11.0 1.7 2.6 2.9 3.4 3.8 1.2 67.7 71.2 70.1 76.8 9.1
East North Central 34.7 41.6 49.5 51.4 16.7 13.1 18.0 16.6 18.6 5.5 3.2 5.8 6.9 7.1 3.9 4.1 6.0 7.6 9.0 4.9 73.4 80.4 82.0 77.8 4.4
East South Central 46.9 48.5 62.8 68.8 21.9 19.6 27.3 13.9 14.6 -5.0 –
a
– 12.7 – ND 0.9 2.2 4.5 – – ND 31.0 81.7 68.8 65.5 34.5
Mid Atlantic 35 41.9 45.8 48.6 13.6 13.9 18.6 12.4 17.8 3.9 – 10.3 8.8 6.9 ND 4.7 3.7 4.1 4.5 -0.2 76.1 73.4 68.6 79.8 3.7
Mountain 28.9 37 51.1 59.6 30.7 16.1 15.3 10.7 15.5 -0.6 – – 1.6 – ND 1.3 1.5 2.7 1.1 -0.2 71.8 69.7 62.3 52.8 -19.0
New England 21.6 38.4 43.2 44.3 22.7 7.0 30.8 9.9 11.0 4.0 – – – 18.4 ND – – 0.6 – – 4.3 ND – – 62.4 – – 74.0 ND
Pacific 22.6 31 46.2 43.3 20.7 16.4 17.9 14.9 10.7 -5.7 14.4 11.5 10.2 3.8 -10.6 2.1 0.6 1.6 2.5 0.4 74.9 52.0 53.1 73.4 -1.5
South Atlantic 40.2 53.4 56.8 58.3 18.1 20.2 26.8 19.8 24.0 3.8 11.3 3.6 15.8 13.3 2.0 1.6 2.9 2.4 3.3 1.7 55.2 72.0 70.1 81.8 26.6
West North Central 37 42.5 49.7 53.1 16.1 12.2 21.3 14.2 18.0 5.8 – 7.9 6.9 – ND 0.8 1.2 1.4 4.0 3.2 64.9 65.7 68.7 62.2 -2.7
West South Central 29.3 43.1 59.4 62.2 32.9 18.4 26.7 17.1 20.2 1.8 5.5 5.2 13.6 12.1 6.6 3.4 1.5 1.1 2.0 -1.4 66.3 69.6 70.5 79.3 13.0
*2008 data excluded due to reporting on non-meningitis isolates with both parenteral and oral breakpoints during that year
a
Single dashed line (–) indicates that < 50 results were reported; double dashed line (– –) indicates that <100 results were reported
ND - not determined
%R
VREfmMRSA VREfcPRSP EryR SPY
Organism Phenotype
a
Total n Mode MIC5 0 MIC90 (%S) (%I) (%R)
S. aureus MSSA 1,552 0.12 0.12 0.25 (99.9) (0.0) (0.1)
MRSA 2,606 0.12 0.12 0.25 (99.8) (0.0) (0.2)
S. pneumoniae PSSP* 479 0.015 0.015 0.03 (99.6) (0.0) (0.0)
PRSP 56 0.015 0.015 0.03 (100.0) (0.0) (0.0)
non-MDR 555 0.015 0.015 0.03 (99.6) (0.0) (0.0)
MDR 103 0.015 0.015 0.03 (100.0) (0.0) (0.0)
S. pyogenes Ery S 645 0.03 0.03 0.06 (100.0) (0.0) (0.0)
Ery R 96 0.03 0.03 0.06 (100.0) (0.0) (0.0)
E. faecalis VSE 256 0.12 0.12 0.5 (87.9) (0.0) (0.0)
MDR, multi-drug resistant; Ery S/ Ery R, erythromycin susceptible/ resistant; VSE, vancomycin susceptible E. faecalis
*Penicillin (oral penicillin V) CLSI MIC interpretive standard used
MIC (µg/mL)
a
MSSA/ MRSA, methicillin susceptible/ resistant S. aureus ; PSSP/ PRSP, penicillin susceptible/ resistant S.